Booking Holdings Inc. and Airbnb, Inc. are two giants reshaping the travel services industry with distinct yet overlapping market approaches. While Booking Holdings offers a comprehensive suite of online travel reservations, Airbnb revolutionizes lodging through its peer-to-peer marketplace. Their innovation strategies reflect different facets of consumer demand in travel. In this article, I will analyze both companies to help you identify which presents the most compelling investment opportunity in 2026.

Table of contents
Companies Overview
I will begin the comparison between Booking Holdings Inc. and Airbnb, Inc. by providing an overview of these two companies and their main differences.
Booking Holdings Inc. Overview
Booking Holdings Inc. operates as a global provider of travel and restaurant online reservation services. The company’s mission focuses on offering a broad range of travel solutions, including accommodation bookings, rental cars, flights, and restaurant reservations through multiple brands like Booking.com, Priceline, and OpenTable. Headquartered in Norwalk, Connecticut, it holds a leading position in the travel services industry with a diverse portfolio catering to consumer and business needs worldwide.
Airbnb, Inc. Overview
Airbnb, Inc. runs an online marketplace platform that connects hosts and guests globally to offer stays and experiences. The company emphasizes enabling unique lodging options such as private rooms and vacation homes, focusing on a peer-to-peer sharing economy model. Founded in 2007 and based in San Francisco, Airbnb has established itself as a prominent player in the consumer cyclical sector by facilitating personalized travel experiences through its digital platform.
Key similarities and differences
Both Booking and Airbnb operate in the travel services industry and leverage online platforms to connect consumers with travel accommodations. Booking Holdings offers a wider range of services including flights, car rentals, and restaurant bookings, while Airbnb specializes primarily in home and experience rentals. Additionally, Booking has a larger workforce and market capitalization, reflecting its broader market scope, whereas Airbnb’s marketplace model focuses more on peer-to-peer engagement and unique stays.
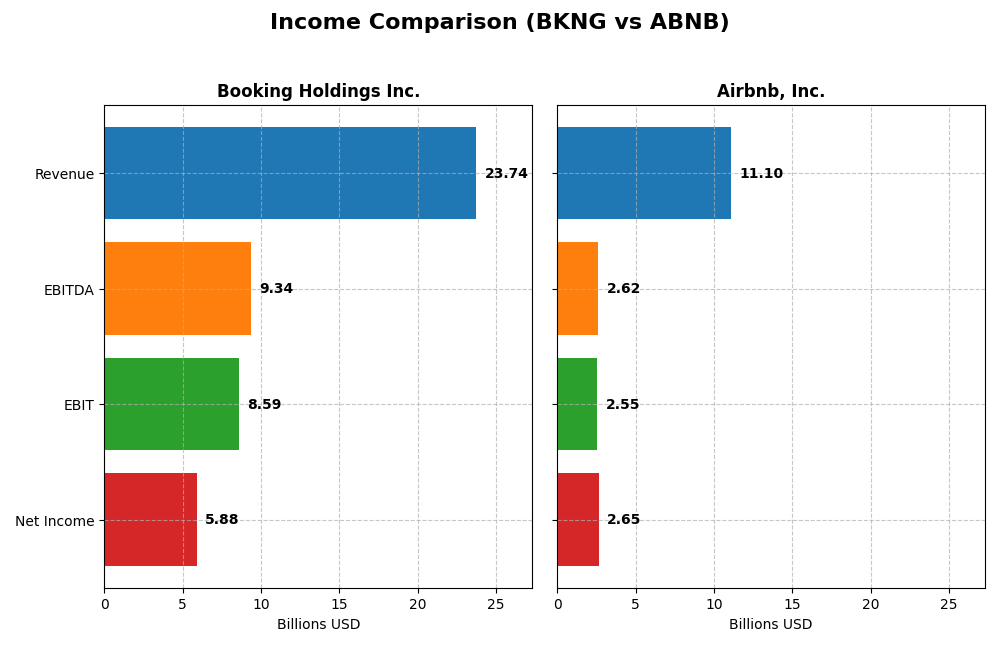
Income Statement Comparison
The table below compares the key income statement metrics for Booking Holdings Inc. and Airbnb, Inc. for the fiscal year 2024, providing a snapshot of their financial performance.
| Metric | Booking Holdings Inc. (BKNG) | Airbnb, Inc. (ABNB) |
|---|---|---|
| Market Cap | 177B | 86.1B |
| Revenue | 23.7B | 11.1B |
| EBITDA | 9.3B | 2.6B |
| EBIT | 8.6B | 2.6B |
| Net Income | 5.9B | 2.6B |
| EPS | 174.96 | 4.19 |
| Fiscal Year | 2024 | 2024 |
Income Statement Interpretations
Booking Holdings Inc.
Booking Holdings Inc. demonstrated strong revenue and net income growth from 2020 to 2024, with revenue rising from 6.8B to 23.7B and net income from 59M to 5.9B. Margins remained robust, with a consistent 100% gross margin and improving EBIT margin reaching 36.2% in 2024. The latest year showed an 11.1% revenue increase and a notable 23.4% net margin growth, reflecting enhanced profitability.
Airbnb, Inc.
Airbnb, Inc. also experienced substantial revenue growth, from 3.4B in 2020 to 11B in 2024, with net income rising from a loss of 4.6B to a profit of 2.6B. Gross margin stood at 83.1%, and EBIT margin improved to 23% by 2024. The most recent year saw an 11.9% revenue increase, but net margin fell by 50.6%, and EPS declined by 43.2%, indicating some margin pressure despite top-line growth.
Which one has the stronger fundamentals?
Booking Holdings shows stronger fundamentals with a higher gross margin and EBIT margin, significant net margin expansion, and consistent EPS growth. Airbnb’s rapid revenue increase is positive, but its recent margin compression and EPS decline introduce caution. Overall, Booking Holdings’ stable margin improvement and robust profitability growth suggest more favorable income statement fundamentals.
Financial Ratios Comparison
The table below presents a side-by-side comparison of key financial ratios for Booking Holdings Inc. and Airbnb, Inc. based on their most recent full-year fiscal data for 2024.
| Ratios | Booking Holdings Inc. (BKNG) | Airbnb, Inc. (ABNB) |
|---|---|---|
| ROE | -146.3% | 31.5% |
| ROIC | 44.1% | 18.7% |
| P/E | 28.4 | 31.4 |
| P/B | -41.6 | 9.87 |
| Current Ratio | 1.31 | 1.69 |
| Quick Ratio | 1.31 | 1.69 |
| D/E (Debt-to-Equity) | -4.25 | 0.27 |
| Debt-to-Assets | 61.6% | 10.9% |
| Interest Coverage | 5.83 | 0 |
| Asset Turnover | 0.86 | 0.53 |
| Fixed Asset Turnover | 17.1 | 38.2 |
| Payout ratio | 20.0% | 0% |
| Dividend yield | 0.70% | 0% |
Interpretation of the Ratios
Booking Holdings Inc.
Booking Holdings shows a mixed ratio profile with a strong net margin of 24.78% and a high return on invested capital at 44.14%, indicating effective capital use. However, its negative return on equity (-146.32%) and unfavorable debt-to-assets ratio (61.65%) raise concerns about financial leverage and equity returns. The dividend yield is low at 0.7%, with potential risks linked to distributions and buybacks.
Airbnb, Inc.
Airbnb presents a generally favorable ratio set with a solid net margin of 23.85%, positive return on equity (31.48%), and controlled debt-to-assets ratio (10.95%), reflecting strong profitability and conservative leverage. It carries no dividend, consistent with its reinvestment strategy and growth focus, supported by positive free cash flow and prioritization of R&D expenditures.
Which one has the best ratios?
Airbnb’s ratios are more favorable overall, with a higher proportion of positive metrics, including strong profitability, equity returns, and conservative debt levels. Booking Holdings exhibits strong profitability but is weighed down by negative equity returns and leverage concerns. Thus, Airbnb’s financial ratios appear comparatively more balanced and robust.
Strategic Positioning
This section compares the strategic positioning of Booking Holdings Inc. and Airbnb, Inc. across market position, key segments, and exposure to technological disruption:
Booking Holdings Inc.
- Leading global travel services provider with significant market cap; faces competitive pressure in online travel space.
- Diversified revenue streams from accommodation, car rentals, flights, restaurant bookings, and travel insurance.
- Operates multiple platforms; potential disruption from evolving travel tech but strong brand portfolio mitigates risk.
Airbnb, Inc.
- Strong platform-based travel marketplace, smaller market cap; competes in peer-to-peer lodging and experiences market.
- Focused on private and vacation home rentals plus experiences; revenue primarily from single marketplace segment.
- Technology-driven platform vulnerable to innovation but benefits from network effects and mobile usage growth.
Booking Holdings Inc. vs Airbnb, Inc. Positioning
Booking Holdings exhibits a diversified business model across various travel and restaurant services, providing multiple revenue drivers. Airbnb concentrates on a single marketplace segment, focusing on private lodging and experiences, which offers agility but less diversification.
Which has the best competitive advantage?
Both companies show very favorable MOAT evaluations with growing ROIC above WACC, indicating durable competitive advantages; however, Booking Holdings’ larger scale and diversified services suggest a stronger economic moat overall.
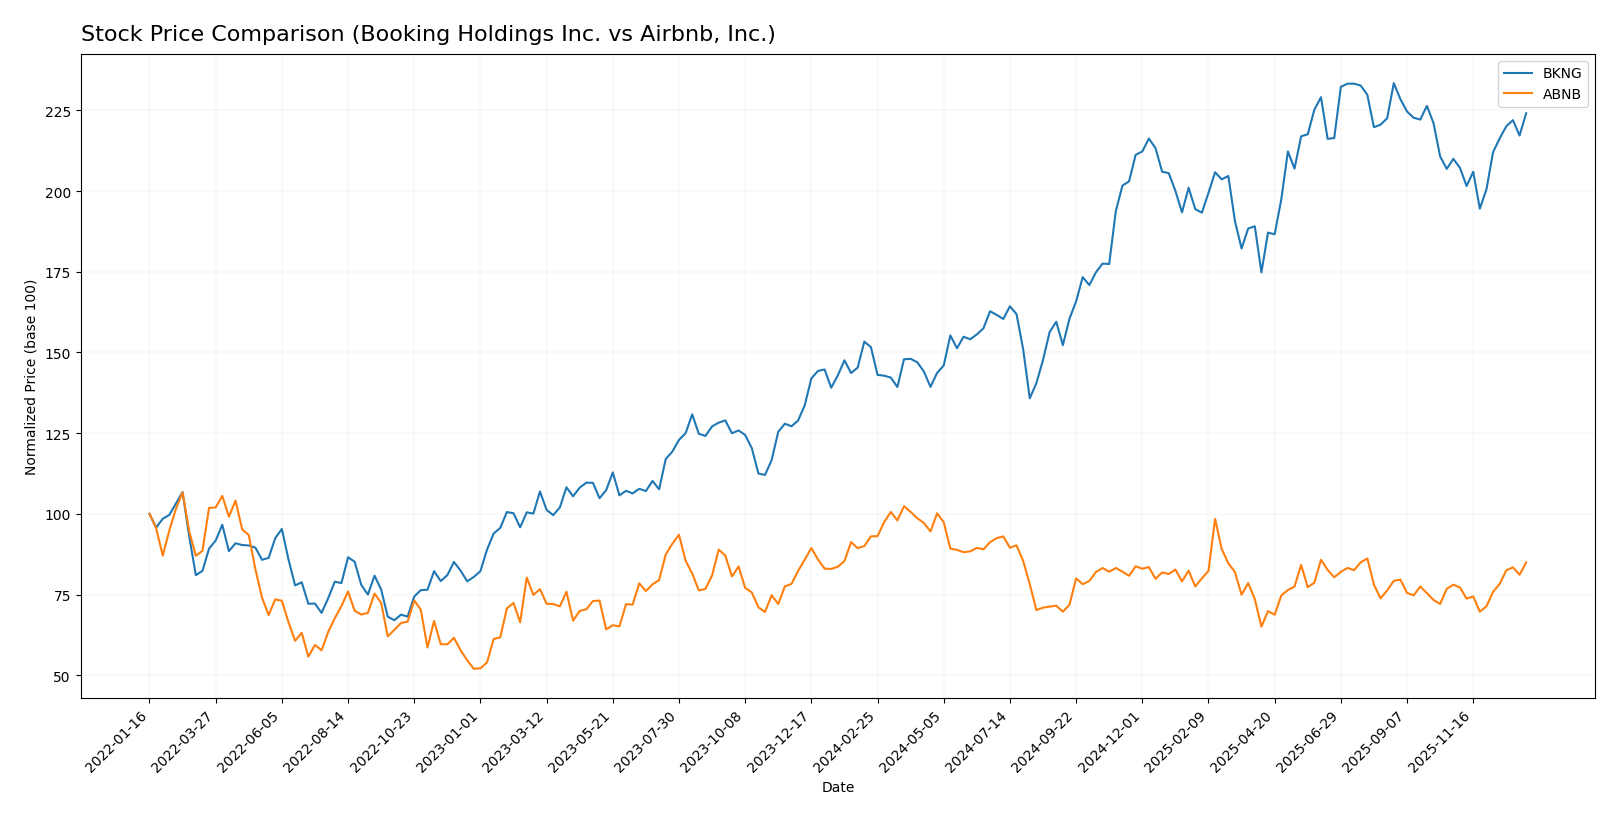
Stock Comparison
The past year shows a marked divergence in stock performance, with Booking Holdings Inc. experiencing a strong bullish acceleration and Airbnb, Inc. facing a bearish trend despite recent positive momentum.
Trend Analysis
Booking Holdings Inc. (BKNG) posted a 47.76% price increase over the past 12 months, indicating a bullish trend with accelerating gains and a notable price range between 3,328 and 5,721.
Airbnb, Inc. (ABNB) recorded an 8.68% price decline over the same period, reflecting a bearish trend with accelerating downward movement, despite a recent 8.81% short-term rise.
Comparing both, Booking Holdings delivered the highest market performance with a significant bullish trend, while Airbnb showed a longer-term bearish trajectory, despite recent recovery signs.
Target Prices
Analysts present a clear target price consensus for Booking Holdings Inc. and Airbnb, Inc., reflecting a generally positive outlook.
| Company | Target High | Target Low | Consensus |
|---|---|---|---|
| Booking Holdings Inc. | 6806 | 5407 | 6141.38 |
| Airbnb, Inc. | 170 | 107 | 142.5 |
Target prices for Booking Holdings suggest potential upside from the current price of 5492.11 USD, while Airbnb’s consensus target of 142.5 USD slightly exceeds its current price of 139.27 USD. Overall, analysts expect moderate growth for both stocks.
Analyst Opinions Comparison
This section compares analysts’ ratings and grades for Booking Holdings Inc. and Airbnb, Inc.:
Rating Comparison
Booking Holdings Inc. Rating
- Rating: B-, considered very favorable overall.
- Discounted Cash Flow Score: 5, very favorable valuation.
- ROE Score: 1, very unfavorable efficiency in generating profit.
- ROA Score: 5, very favorable asset utilization.
- Debt To Equity Score: 1, very unfavorable financial risk.
- Overall Score: 3, moderate overall financial standing.
Airbnb, Inc. Rating
- Rating: A-, also very favorable overall.
- Discounted Cash Flow Score: 5, very favorable valuation.
- ROE Score: 5, very favorable efficiency in generating profit.
- ROA Score: 5, very favorable asset utilization.
- Debt To Equity Score: 3, moderate financial risk.
- Overall Score: 4, favorable overall financial standing.
Which one is the best rated?
Based strictly on the provided data, Airbnb’s ratings and scores are generally higher and more favorable, particularly in return on equity and overall score, while Booking Holdings shows weaknesses in those areas.
Scores Comparison
Here is a comparison of the financial health scores for Booking Holdings Inc. and Airbnb, Inc.:
BKNG Scores
- Altman Z-Score: 7.16, indicating a safe zone with very low bankruptcy risk.
- Piotroski Score: 7, classified as strong financial health.
ABNB Scores
- Altman Z-Score: 4.34, indicating a safe zone with low bankruptcy risk.
- Piotroski Score: 7, classified as strong financial health.
Which company has the best scores?
Both BKNG and ABNB fall within the safe zone for Altman Z-Score, with BKNG scoring higher at 7.16 versus ABNB’s 4.34. Both companies share an identical Piotroski Score of 7, indicating strong financial health.
Grades Comparison
Here is a comparison of the latest reliable grades for Booking Holdings Inc. and Airbnb, Inc.:
Booking Holdings Inc. Grades
The following table summarizes recent grades from established financial institutions for Booking Holdings Inc.:
| Grading Company | Action | New Grade | Date |
|---|---|---|---|
| Wells Fargo | Maintain | Equal Weight | 2026-01-09 |
| Cantor Fitzgerald | Maintain | Neutral | 2026-01-08 |
| Bernstein | Maintain | Market Perform | 2026-01-06 |
| Argus Research | Maintain | Buy | 2026-01-06 |
| BTIG | Maintain | Buy | 2025-12-23 |
| B of A Securities | Upgrade | Buy | 2025-11-24 |
| BTIG | Maintain | Buy | 2025-11-24 |
| Wedbush | Upgrade | Outperform | 2025-11-13 |
| DA Davidson | Maintain | Buy | 2025-10-29 |
| UBS | Maintain | Buy | 2025-10-29 |
Booking Holdings shows a positive trend with multiple upgrades and a majority of “Buy” and “Outperform” ratings, reflecting generally favorable analyst sentiment.
Airbnb, Inc. Grades
The following table summarizes recent grades from established financial institutions for Airbnb, Inc.:
| Grading Company | Action | New Grade | Date |
|---|---|---|---|
| Barclays | Upgrade | Equal Weight | 2026-01-09 |
| Wells Fargo | Upgrade | Equal Weight | 2026-01-09 |
| Cantor Fitzgerald | Upgrade | Neutral | 2026-01-08 |
| Bernstein | Maintain | Outperform | 2026-01-06 |
| Wedbush | Maintain | Neutral | 2025-12-19 |
| RBC Capital | Upgrade | Outperform | 2025-12-17 |
| Jefferies | Maintain | Buy | 2025-12-05 |
| DA Davidson | Maintain | Buy | 2025-12-05 |
| Truist Securities | Maintain | Sell | 2025-12-04 |
| Wells Fargo | Maintain | Underweight | 2025-12-01 |
Airbnb’s grades exhibit mixed signals with some upgrades and a few downgrades, resulting in a consensus closer to “Hold” with notable divergence among analysts.
Which company has the best grades?
Booking Holdings receives stronger and more consistent buy-side ratings compared to Airbnb, which has a more mixed consensus including hold and sell opinions. This difference could influence investors’ perceptions of risk and growth potential between the two companies.
Strengths and Weaknesses
Below is a comparative overview of key strengths and weaknesses for Booking Holdings Inc. (BKNG) and Airbnb, Inc. (ABNB) based on the most recent data available.
| Criterion | Booking Holdings Inc. (BKNG) | Airbnb, Inc. (ABNB) |
|---|---|---|
| Diversification | High revenue diversification across agency, merchant, and advertising segments with $14.1B merchant revenue in 2024 | Less diversified, focused mainly on peer-to-peer lodging, with $11.1B total revenue in 2024 |
| Profitability | Strong net margin at 24.78%, but negative ROE (-146.32%) signals some financial structure concerns | Healthy profitability with 23.85% net margin and positive ROE of 31.48% |
| Innovation | Established platform with growing ROIC (44.14%) showing efficient capital use and durable moat | Also demonstrates durable competitive advantage with growing ROIC (18.69%) and strong innovation in alternative lodging |
| Global presence | Extensive global footprint with diverse revenue streams worldwide | Global presence but more concentrated in peer-to-peer and experiential travel markets |
| Market Share | Large market share in traditional online travel agency and merchant booking sectors | Rapidly growing market share in home-sharing and unique stays segment |
Key takeaways: Booking Holdings shows exceptional diversification and strong capital efficiency but faces some financial leverage challenges. Airbnb offers solid profitability with a favorable financial structure and continues to innovate in alternative lodging, positioning itself well for growth. Both companies demonstrate durable competitive moats and growing profitability trends.
Risk Analysis
Below is a comparative risk assessment table for Booking Holdings Inc. (BKNG) and Airbnb, Inc. (ABNB) based on the most recent 2024 financial and operational data.
| Metric | Booking Holdings Inc. (BKNG) | Airbnb, Inc. (ABNB) |
|---|---|---|
| Market Risk | Beta 1.23 indicates moderate volatility | Beta 1.10 indicates somewhat lower volatility |
| Debt level | High debt-to-assets at 61.65% (unfavorable) | Low debt-to-assets at 10.95% (favorable) |
| Regulatory Risk | Moderate, with global travel regulations impacting operations | Moderate, facing local housing and rental regulations worldwide |
| Operational Risk | Diversified platform reduces risk, stable quick ratio at 1.31 | Platform model reliant on hosts, quick ratio 1.69 favorable liquidity |
| Environmental Risk | Exposure to travel sector carbon footprint regulations | Similar exposure with growing focus on sustainable tourism |
| Geopolitical Risk | Moderate, sensitive to international travel bans and restrictions | Moderate, affected by cross-border travel policies and local regulations |
Booking Holdings shows significant debt risk with a debt-to-assets ratio above 60%, which is concerning despite strong operational metrics. Airbnb’s regulatory environment remains a key risk due to local housing laws but benefits from a stronger balance sheet and liquidity. Market volatility is moderate for both. Investors should weigh the high leverage risk of BKNG against ABNB’s regulatory and operational dependencies.
Which Stock to Choose?
Booking Holdings Inc. shows a strong income evolution with 249% revenue growth over five years and a very favorable income statement. Its financial ratios are slightly favorable overall, with high ROIC well above WACC indicating value creation, though return on equity and debt-to-assets ratios are unfavorable. The company holds a very favorable rating of B- and demonstrates robust profitability and controlled debt.
Airbnb, Inc. also displays favorable income growth at 229% over the same period and solid profitability, though with some recent net margin and EPS declines. Its financial ratios are more favorable overall, supported by a strong return on equity and low debt levels. Airbnb holds a very favorable A- rating, with a durable competitive advantage shown by a growing ROIC above WACC, and strong score evaluations.
Investors focused on growth might find Airbnb’s higher overall ratio favorability and rating appealing, while those prioritizing stability could view Booking’s higher income growth and value creation moat as positive. The choice could depend on preference for slightly stronger profitability versus a more balanced financial ratio profile.
Disclaimer: Investment carries a risk of loss of initial capital. The past performance is not a reliable indicator of future results. Be sure to understand risks before making an investment decision.
Go Further
I encourage you to read the complete analyses of Booking Holdings Inc. and Airbnb, Inc. to enhance your investment decisions: