Home > Comparison > Basic Materials > SHW vs APD
The strategic rivalry between The Sherwin-Williams Company and Air Products and Chemicals, Inc. defines the current trajectory of the specialty chemicals sector. Sherwin-Williams operates as a capital-intensive industrial coatings leader, while Air Products specializes in high-margin atmospheric and specialty gases. This head-to-head highlights a contest between diversified product integration and focused technological innovation. This analysis aims to uncover which corporate path offers superior risk-adjusted returns for a diversified portfolio.
Table of contents
Companies Overview
The Sherwin-Williams Company and Air Products and Chemicals, Inc. hold commanding roles in the specialty chemicals market.
The Sherwin-Williams Company: Paints and Coatings Leader
The Sherwin-Williams Company dominates the architectural paints and coatings sector, generating revenue primarily through its Americas Group, Consumer Brands, and Performance Coatings segments. Its strategic focus in 2026 remains on expanding its store footprint and enhancing product innovation for professional and retail customers, reinforcing its broad distribution network across multiple continents.
Air Products and Chemicals, Inc.: Industrial Gases Innovator
Air Products and Chemicals, Inc. leads in atmospheric and specialty gases production, supplying oxygen, nitrogen, hydrogen, and related equipment globally. The company’s 2026 strategy centers on advancing hydrogen compression technology through its partnership with Baker Hughes, targeting growth in energy and manufacturing sectors while expanding its portfolio of gas processing solutions.
Strategic Collision: Similarities & Divergences
Both companies compete within specialty chemicals but pursue distinct business philosophies: Sherwin-Williams leverages a product-centric, retail-driven model, while Air Products focuses on technology-intensive gas supply and equipment. Their primary battleground is industrial and commercial sectors requiring specialized chemical solutions. Investors face contrasting profiles—Sherwin-Williams offers scale and brand reach; Air Products delivers technological edge and energy sector exposure.
Income Statement Comparison
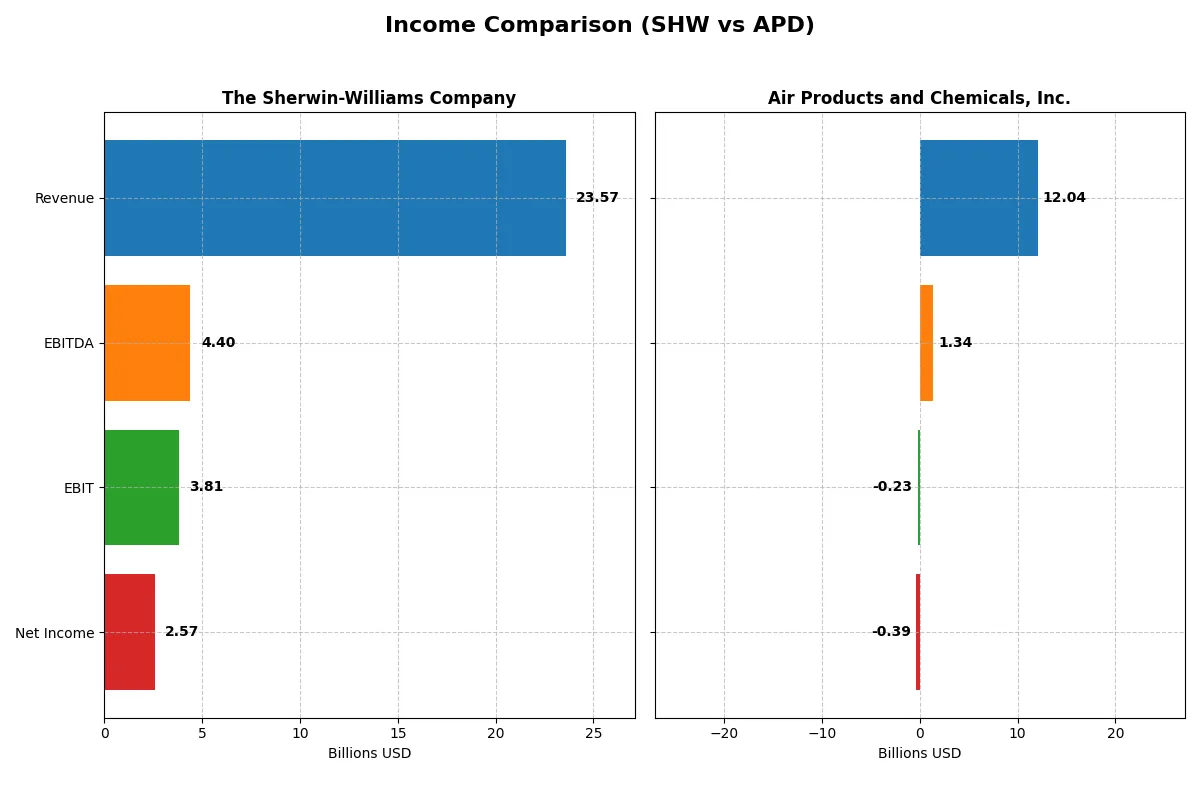
This data dissects the core profitability and scalability of both corporate engines to reveal who dominates the bottom line:
| Metric | The Sherwin-Williams Company (SHW) | Air Products and Chemicals, Inc. (APD) |
|---|---|---|
| Revenue | 23.6B | 12.0B |
| Cost of Revenue | 12.0B | 8.3B |
| Operating Expenses | 7.7B | 4.7B |
| Gross Profit | 11.5B | 3.8B |
| EBITDA | 4.4B | 1.3B |
| EBIT | 3.8B | -227M |
| Interest Expense | 469M | 214M |
| Net Income | 2.6B | -395M |
| EPS | 10.38 | -1.77 |
| Fiscal Year | 2025 | 2025 |
Income Statement Analysis: The Bottom-Line Duel
This income statement comparison reveals the true efficiency and profitability of two distinct corporate engines through their recent financial performance.
The Sherwin-Williams Company Analysis
Sherwin-Williams shows steady revenue growth from $19.9B in 2021 to $23.6B in 2025, with net income rising from $1.86B to $2.57B. Gross margin remains robust near 49%, while net margin holds favorably at 10.9%. Despite a slight one-year dip in EBIT and net margin growth, the company maintains strong overall momentum and operational efficiency.
Air Products and Chemicals, Inc. Analysis
Air Products posted a revenue peak near $12.7B in 2022, slightly declining to $12.0B in 2025. Net income swung from $2.10B in 2021 to a loss of $395M in 2025, reflecting margin pressure. Gross margin at 31.4% contrasts sharply with a negative EBIT and net margin in 2025, signaling operational challenges and deteriorating profitability over the latest year.
Margin Power vs. Revenue Scale
Sherwin-Williams dominates with consistently high margins and growing profits, while Air Products struggles with negative earnings despite similar revenue scale. Sherwin-Williams’ profile suits investors seeking margin resilience and earnings growth. Air Products’ current volatility and losses present heightened risk, demanding caution for portfolio inclusion.
Financial Ratios Comparison
These vital ratios act as a diagnostic tool to expose the underlying fiscal health, valuation premiums, and capital efficiency of the companies analyzed:
| Ratios | The Sherwin-Williams Company (SHW) | Air Products and Chemicals, Inc. (APD) |
|---|---|---|
| ROE | 55.9% | -2.6% |
| ROIC | 15.2% | -1.8% |
| P/E | 31.1 | -154.0 |
| P/B | 17.4 | 4.04 |
| Current Ratio | 0.87 | 1.38 |
| Quick Ratio | 0.53 | 1.20 |
| D/E (Debt-to-Equity) | 2.81 | 1.23 |
| Debt-to-Assets | 50.0% | 44.8% |
| Interest Coverage | 8.11 | -4.10 |
| Asset Turnover | 0.91 | 0.29 |
| Fixed Asset Turnover | 3.84 | 0.46 |
| Payout Ratio | 30.3% | -401.5% |
| Dividend Yield | 0.98% | 2.61% |
| Fiscal Year | 2025 | 2025 |
Efficiency & Valuation Duel: The Vital Signs
Financial ratios serve as a company’s DNA, unveiling hidden risks and operational strengths that raw numbers alone cannot reveal.
The Sherwin-Williams Company
Sherwin-Williams demonstrates strong profitability with a 55.9% ROE and favorable net margin of 10.9%. However, its valuation appears stretched, trading at a high 31.1 P/E and 17.4 P/B, signaling expensive stock. The company offers a modest 0.98% dividend yield, suggesting a focus on steady shareholder returns over aggressive reinvestment.
Air Products and Chemicals, Inc.
Air Products struggles with negative profitability metrics, including a -2.6% ROE and -3.3% net margin. Although the P/E ratio is technically favorable due to negative earnings, other signs, such as a weak asset turnover of 0.29, highlight operational inefficiency. It pays a healthier 2.61% dividend yield, providing income despite underlying financial challenges.
Premium Valuation vs. Operational Safety
Sherwin-Williams balances operational excellence with a rich valuation, while Air Products faces profitability and efficiency headwinds despite a stronger dividend. Investors seeking growth and solid returns may lean toward Sherwin-Williams, whereas income-focused investors might consider Air Products’ dividend profile.
Which one offers the Superior Shareholder Reward?
I compare Sherwin-Williams (SHW) and Air Products and Chemicals (APD) on dividends, buybacks, and sustainability. SHW yields ~0.98% with a 30% payout ratio, balancing dividends and moderate buybacks. APD offers a higher 2.6% yield but struggles with negative free cash flow and heavy capex, limiting buybacks. SHW’s disciplined payout and stable cash flow suggest a more sustainable, attractive total return in 2026.
Comparative Score Analysis: The Strategic Profile
The radar chart reveals the fundamental DNA and trade-offs of The Sherwin-Williams Company and Air Products and Chemicals, Inc.:
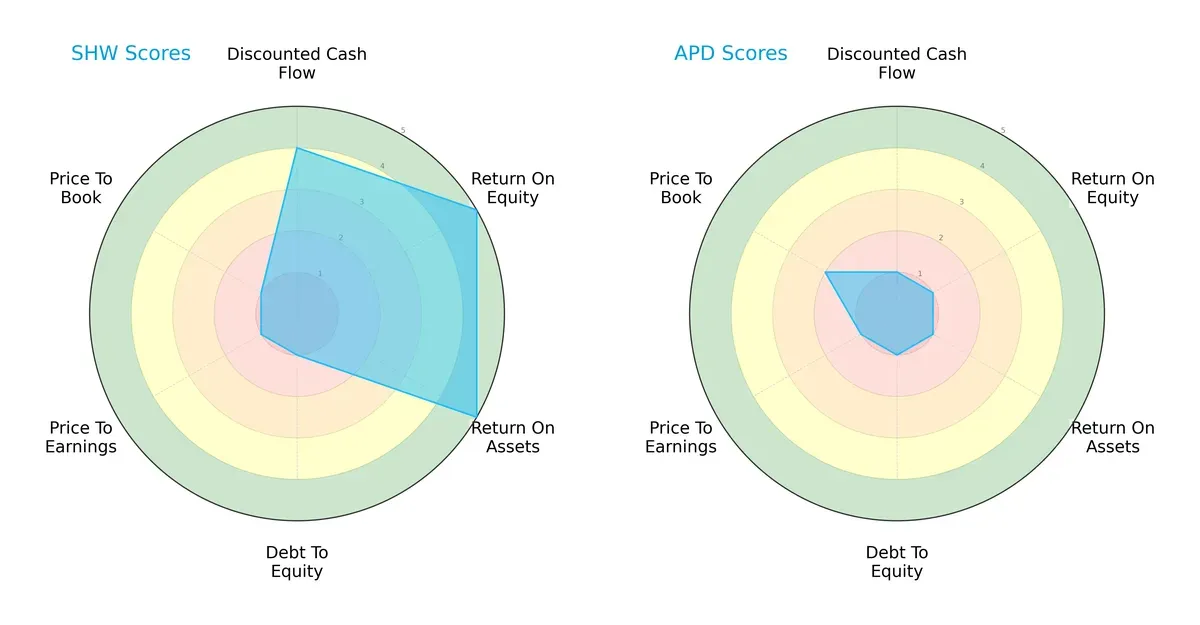
Sherwin-Williams exhibits a balanced profile with strong profitability (ROE 5, ROA 5) and solid discounted cash flow (DCF 4), but it carries significant valuation and leverage risks (Debt/Equity 1, PE/PB 1). Air Products lacks strengths across all metrics, scoring uniformly low except for a slightly better Price-to-Book (2). Sherwin-Williams leverages operational efficiency, while Air Products shows no clear competitive edge.
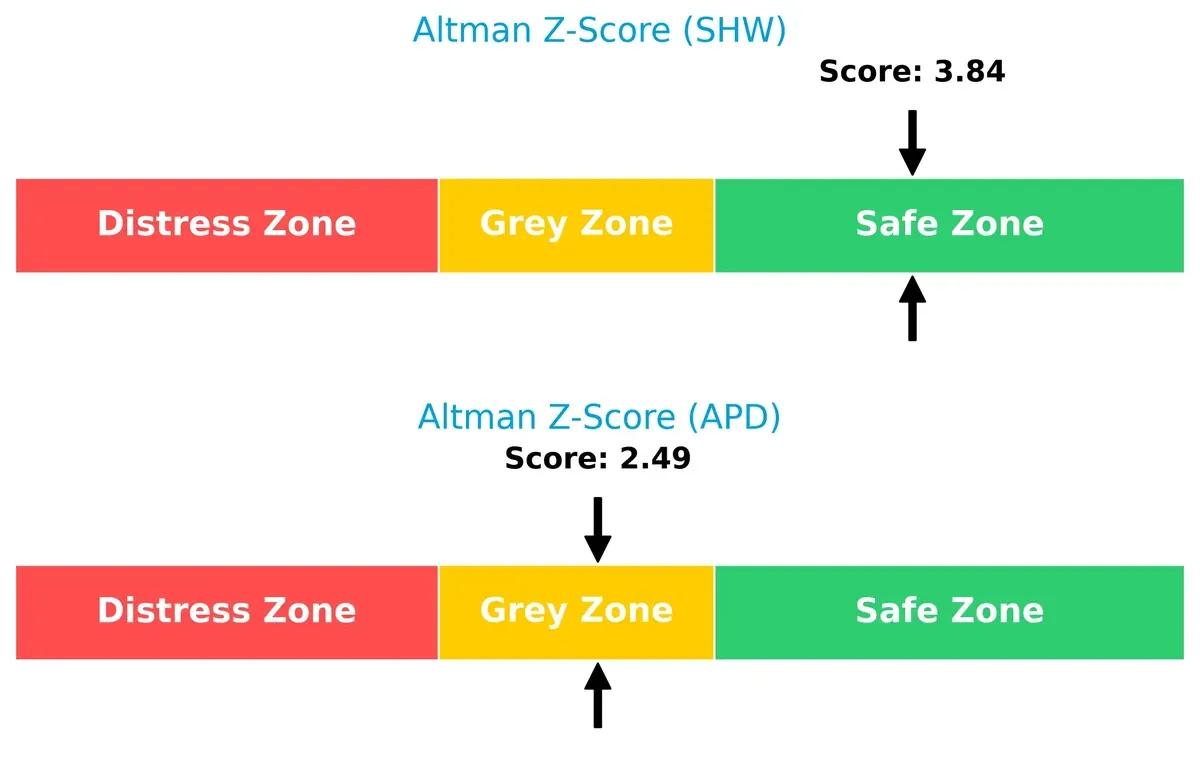
Bankruptcy Risk: Solvency Showdown
The Sherwin-Williams’ Altman Z-Score of 3.84 places it safely above distress risk, while Air Products’ 2.49 situates it in a grey zone, signaling moderate bankruptcy risk in this cycle:
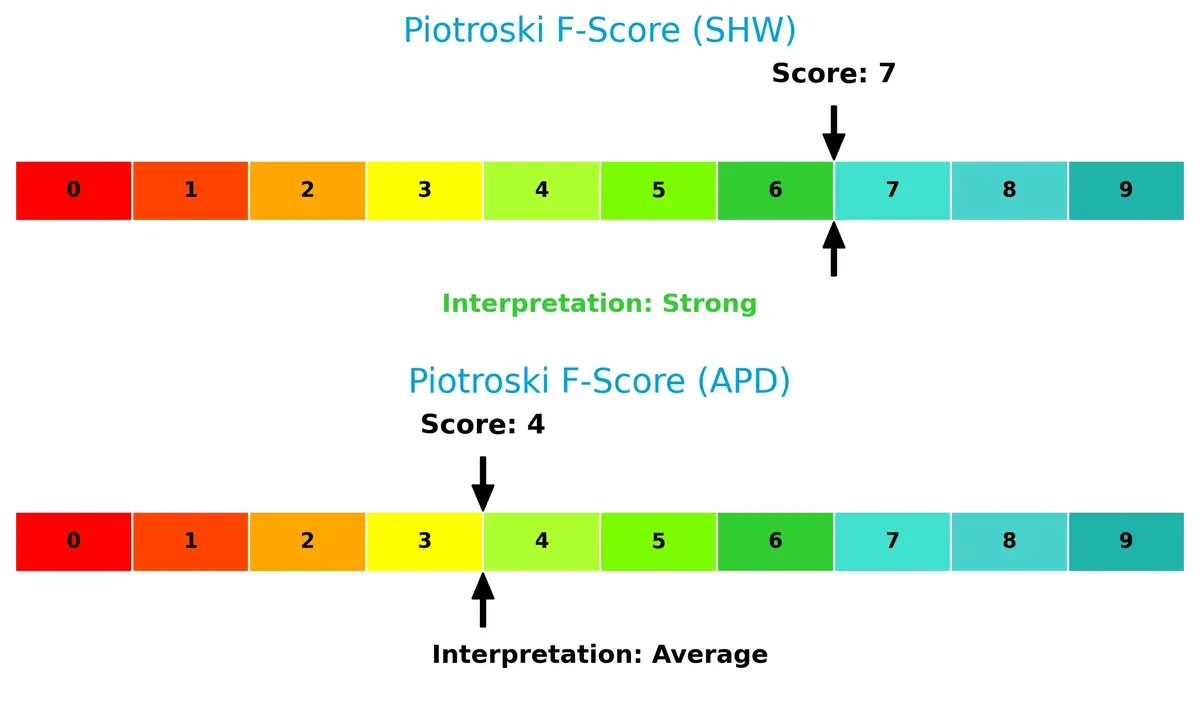
Financial Health: Quality of Operations
Sherwin-Williams scores a robust 7 on the Piotroski F-Score, indicating strong internal financial health. Air Products’ 4 signals average quality, with potential red flags in operational efficiency and liquidity:
How are the two companies positioned?
This section dissects SHW and APD’s operational DNA by comparing revenue distribution and internal strengths and weaknesses. The goal is to confront their economic moats and identify which model offers the most resilient competitive advantage today.
Revenue Segmentation: The Strategic Mix
This visual comparison dissects how The Sherwin-Williams Company and Air Products and Chemicals, Inc. diversify their income streams and where their primary sector bets lie:
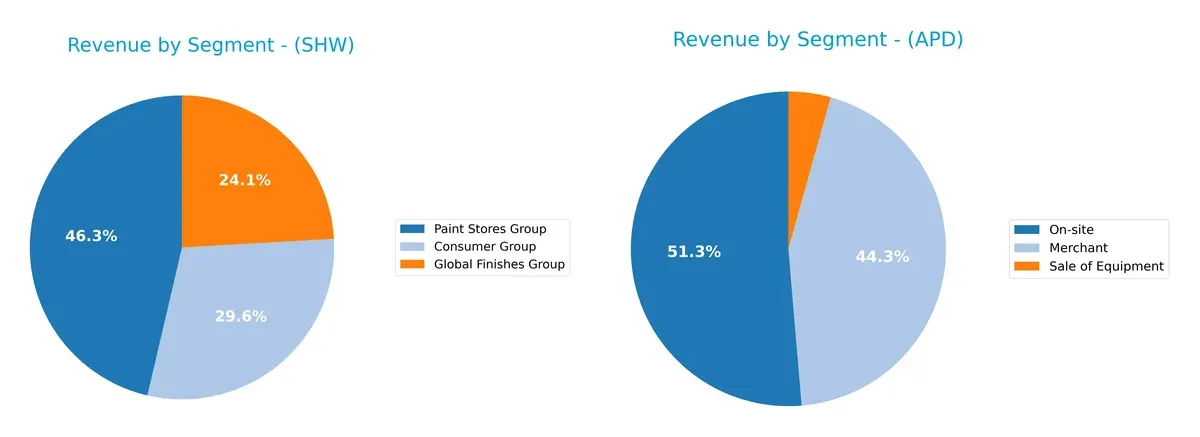
Sherwin-Williams anchors revenue heavily in its Paint Stores Group at $13.2B, complemented by Consumer and Global Finishes Groups, showing moderate diversification. Air Products balances revenue between On-site ($6.2B) and Merchant ($5.3B) segments, with a smaller Sale of Equipment segment. Sherwin-Williams’ focus on retail stores signals ecosystem lock-in, while Air Products’ split reduces concentration risk but depends on industrial infrastructure.
Strengths and Weaknesses Comparison
This table compares the Strengths and Weaknesses of The Sherwin-Williams Company and Air Products and Chemicals, Inc.:
SHW Strengths
- Strong profitability with 10.9% net margin and 55.86% ROE
- ROIC of 15.21% exceeds WACC of 8.87%
- High fixed asset turnover at 3.84
- Large Paint Stores Group revenue of 13.2B
- Well-diversified product segments
APD Strengths
- Favorable WACC at 6.82%
- Positive P/E valuation metric despite losses
- Strong liquidity with current ratio 1.38 and quick ratio 1.2
- Diversified global revenue across Americas, Asia, Europe
- Higher dividend yield at 2.61%
SHW Weaknesses
- Over-leveraged with debt-to-equity ratio at 2.81
- Weak liquidity ratios: current ratio 0.87, quick ratio 0.53
- High valuation multiples: P/E 31.08, P/B 17.36
- Negative dividend yield performance (0.98%)
- Slightly unfavorable global financial ratios overall
APD Weaknesses
- Negative profitability: net margin -3.28%, ROE -2.63%, ROIC -1.82%
- Low asset turnover at 0.29 and fixed asset turnover 0.46
- Unfavorable interest coverage at -1.06
- Debt-to-equity ratio moderately high at 1.23
- Unfavorable global financial ratios overall
Overall, Sherwin-Williams excels in profitability and asset efficiency but faces balance sheet leverage and valuation concerns. Air Products shows stronger liquidity and geographic diversification but struggles with fundamental profitability and operational efficiency. These contrasts influence each company’s strategic focus on financial health and growth sustainability.
The Moat Duel: Analyzing Competitive Defensibility
A structural moat protects a company’s long-term profits from competition’s erosion. Without it, profits inevitably decline:
The Sherwin-Williams Company: Durable Brand and Distribution Moat
Sherwin-Williams leverages strong switching costs and a vast retail network, reflected in a 49% gross margin and rising ROIC. New product lines and geographic expansion in 2026 could deepen this moat.
Air Products and Chemicals, Inc.: Capital-Intensive Scale Advantage
Air Products relies on specialized industrial gases and capital assets, but its declining ROIC and negative margins signal eroding competitiveness compared to Sherwin-Williams. Strategic collaborations may offer limited relief in 2026.
Moat Strength: Brand Loyalty vs. Capital Efficiency
Sherwin-Williams holds a wider and more durable moat, evidenced by growing value creation and stable margins. Air Products faces a shrinking moat and profitability challenges. Sherwin-Williams is better positioned to defend and grow its market share.
Which stock offers better returns?
The stock prices of The Sherwin-Williams Company and Air Products and Chemicals, Inc. exhibit bullish trends over the past year, with notable acceleration and distinct trading volume behaviors.
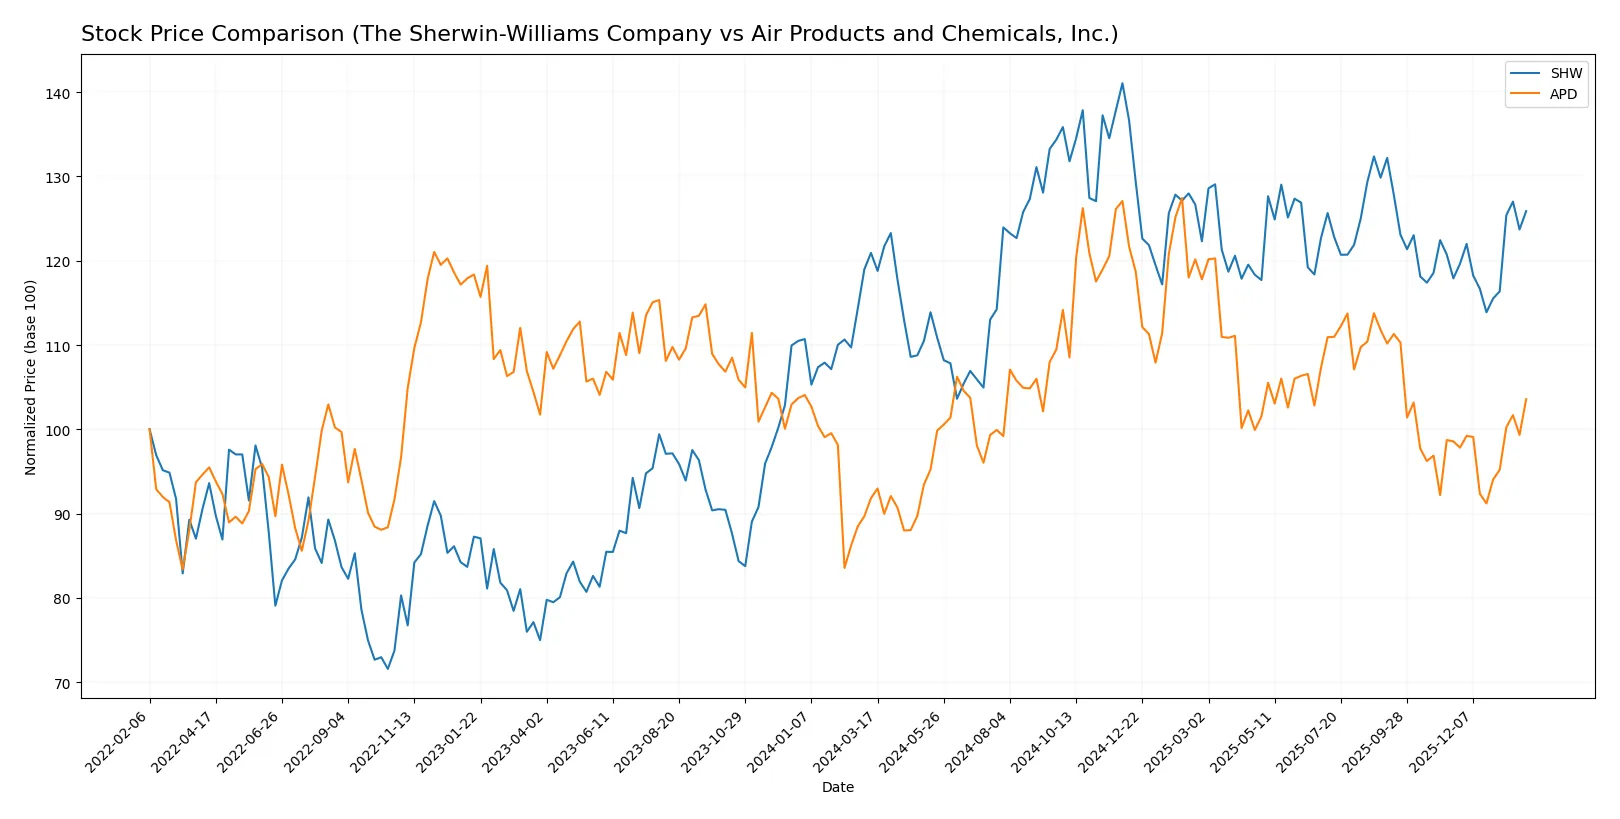
Trend Comparison
The Sherwin-Williams Company’s stock rose 4.09% over the past 12 months, showing acceleration and a bullish trend between a low of 291.95 and a high of 397.4.
Air Products and Chemicals, Inc. gained 12.79% over the same period, also accelerating with a high of 335.26 and a low of 231.53, confirming a stronger bullish trend.
Air Products and Chemicals, Inc. delivered higher returns than Sherwin-Williams, though Sherwin-Williams saw increasing buyer volume, contrasting with Air Products’ declining volume trend.
Target Prices
Analysts show a clear upside consensus for both Sherwin-Williams and Air Products and Chemicals.
| Company | Target Low | Target High | Consensus |
|---|---|---|---|
| The Sherwin-Williams Company | 371 | 420 | 393.5 |
| Air Products and Chemicals, Inc. | 250 | 335 | 280 |
The Sherwin-Williams target consensus stands roughly 11% above the current price of $354.64, signaling moderate upside. Air Products shows a similar pattern, with the consensus target about 3% above its current $272.5 price, reflecting cautious optimism.

Don’t Let Luck Decide Your Entry Point
Optimize your entry points with our advanced ProRealTime indicators. You’ll get efficient buy signals with precise price targets for maximum performance. Start outperforming now!
How do institutions grade them?
The Sherwin-Williams Company Grades
The table below shows recent grades assigned by major institutions for Sherwin-Williams:
| Grading Company | Action | New Grade | Date |
|---|---|---|---|
| RBC Capital | Maintain | Outperform | 2026-01-30 |
| UBS | Maintain | Buy | 2026-01-12 |
| Citigroup | Upgrade | Buy | 2025-12-18 |
| Mizuho | Maintain | Outperform | 2025-12-18 |
| Citigroup | Maintain | Neutral | 2025-10-30 |
| UBS | Maintain | Buy | 2025-10-29 |
| JP Morgan | Maintain | Overweight | 2025-10-29 |
| Wells Fargo | Maintain | Overweight | 2025-10-29 |
| RBC Capital | Maintain | Outperform | 2025-10-29 |
| B of A Securities | Maintain | Neutral | 2025-10-14 |
Air Products and Chemicals, Inc. Grades
Below is a summary of recent institutional grades for Air Products and Chemicals:
| Grading Company | Action | New Grade | Date |
|---|---|---|---|
| Citigroup | Maintain | Neutral | 2026-01-21 |
| B of A Securities | Upgrade | Neutral | 2026-01-08 |
| Wells Fargo | Downgrade | Equal Weight | 2025-12-19 |
| Mizuho | Maintain | Outperform | 2025-12-18 |
| Citigroup | Downgrade | Neutral | 2025-12-15 |
| UBS | Downgrade | Neutral | 2025-12-12 |
| Argus Research | Maintain | Buy | 2025-12-11 |
| Evercore ISI Group | Maintain | Outperform | 2025-11-11 |
| JP Morgan | Maintain | Neutral | 2025-11-07 |
| Wells Fargo | Maintain | Overweight | 2025-11-07 |
Which company has the best grades?
Sherwin-Williams consistently earns higher grades such as Outperform and Buy. Air Products shows mixed ratings, including downgrades to Neutral and Equal Weight. Investors may perceive Sherwin-Williams as a stronger buy signal based on grade consistency.
Risks specific to each company
The following categories identify the critical pressure points and systemic threats facing both firms in the 2026 market environment:
1. Market & Competition
The Sherwin-Williams Company
- Strong market position with diverse coatings portfolio but faces intense specialty chemicals competition.
Air Products and Chemicals, Inc.
- Broad industrial gases market exposure with niche specialty gases; competition from global gas producers is fierce.
2. Capital Structure & Debt
The Sherwin-Williams Company
- High debt-to-equity ratio (2.81) signals leveraged balance sheet and elevated financial risk.
Air Products and Chemicals, Inc.
- Moderate leverage (debt-to-equity 1.23) but negative interest coverage raises solvency concerns.
3. Stock Volatility
The Sherwin-Williams Company
- Beta of 1.26 indicates above-market volatility, reflecting cyclical exposure.
Air Products and Chemicals, Inc.
- Lower beta at 0.88 suggests relative defensive characteristics versus the market.
4. Regulatory & Legal
The Sherwin-Williams Company
- Subject to environmental regulations on paint chemicals and coatings emissions.
Air Products and Chemicals, Inc.
- Faces stringent regulations on industrial gases and hydrogen technologies amid evolving energy policies.
5. Supply Chain & Operations
The Sherwin-Williams Company
- Relies on raw material availability for coatings; global operations face logistical risks.
Air Products and Chemicals, Inc.
- Complex gas production assets require high maintenance; supply disruptions impact customer contracts.
6. ESG & Climate Transition
The Sherwin-Williams Company
- Pressure to reduce volatile organic compounds in products and enhance sustainable practices.
Air Products and Chemicals, Inc.
- Strategic hydrogen initiatives align with climate transition but carry execution and regulatory risks.
7. Geopolitical Exposure
The Sherwin-Williams Company
- Moderate exposure due to operations in Americas, Europe, and Asia with trade tensions impact.
Air Products and Chemicals, Inc.
- Global footprint in energy and manufacturing sectors exposes it to geopolitical uncertainties.
Which company shows a better risk-adjusted profile?
The Sherwin-Williams Company faces its biggest risk from elevated leverage and liquidity constraints. Air Products struggles with negative profitability and interest coverage despite better liquidity ratios. SHW’s Altman Z-Score in the safe zone and stronger Piotroski score indicate superior financial resilience. APD’s grey zone Altman score and weaker profitability heighten bankruptcy risk. Overall, SHW delivers a better risk-adjusted profile, supported by stronger operational metrics and financial stability despite market volatility.
Final Verdict: Which stock to choose?
The Sherwin-Williams Company shines with a durable competitive advantage fueled by an efficient use of invested capital and consistently strong returns. Its superpower lies in its robust profitability and growing ROIC, signaling value creation. A point of vigilance remains its stretched liquidity ratios, suggesting careful monitoring. This stock suits aggressive growth portfolios willing to embrace moderate balance sheet risks.
Air Products and Chemicals, Inc. offers a strategic moat anchored in its stable market position and recurring revenue potential. Relative to Sherwin-Williams, it presents a safer liquidity profile but struggles with value destruction evidenced by declining ROIC and unfavorable profitability trends. It fits a GARP (Growth at a Reasonable Price) portfolio that prioritizes stability over rapid growth.
If you prioritize durable value creation and high returns on capital, Sherwin-Williams is the compelling choice due to its strong economic moat and profitability. However, if you seek better liquidity safety and a more conservative income profile, Air Products offers better stability despite its current challenges. Each appeals to distinct investor profiles with different risk tolerances and growth expectations.
Disclaimer: Investment carries a risk of loss of initial capital. The past performance is not a reliable indicator of future results. Be sure to understand risks before making an investment decision.
Go Further
I encourage you to read the complete analyses of The Sherwin-Williams Company and Air Products and Chemicals, Inc. to enhance your investment decisions: