Home > Comparison > Basic Materials > APD vs PPG
The strategic rivalry between Air Products and Chemicals, Inc. and PPG Industries, Inc. defines the trajectory of the specialty chemicals sector. Air Products operates as a capital-intensive industrial gases provider, while PPG focuses on diversified coatings and specialty materials with broader industrial applications. This head-to-head pits scale and innovation against product diversification. This analysis reveals which company offers a superior risk-adjusted profile for a balanced, growth-oriented portfolio.
Table of contents
Companies Overview
Air Products and Chemicals, Inc. and PPG Industries, Inc. represent key players shaping the specialty chemicals landscape in 2026.
Air Products and Chemicals, Inc.: Global Leader in Industrial Gases
Air Products dominates the atmospheric and specialty gases market, generating revenue primarily from industrial gases like oxygen, nitrogen, and hydrogen. Its strategic focus in 2026 centers on advancing hydrogen compression technologies through collaboration with Baker Hughes, reinforcing its competitive advantage in clean energy solutions and industrial gas equipment.
PPG Industries, Inc.: Specialty Coatings and Materials Powerhouse
PPG Industries commands a strong presence in paints, coatings, and specialty materials. The company earns revenue by providing coatings and sealants across automotive, aerospace, and industrial sectors. In 2026, PPG prioritizes innovation in specialty coatings and expanding its market position in protective and decorative finishes, responding to evolving industrial and consumer demands.
Strategic Collision: Similarities & Divergences
Both companies operate in specialty chemicals but differ in business philosophy; Air Products invests in technology-driven gas solutions while PPG focuses on diversified coatings and materials. Their primary battleground lies in industrial applications where gas products and protective coatings intersect. This contrast creates distinct investment profiles: Air Products offers exposure to energy transition trends, while PPG provides diversified industrial coatings growth.
Income Statement Comparison
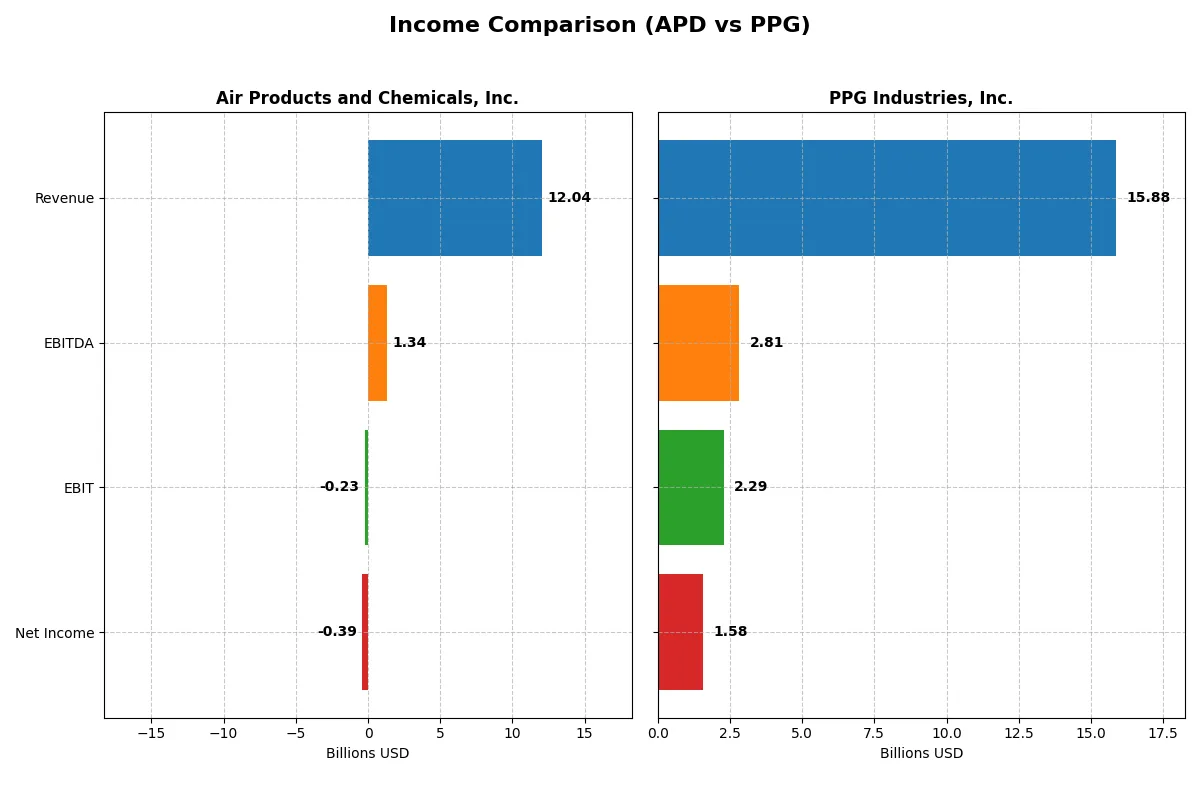
This data dissects the core profitability and scalability of both corporate engines to reveal who dominates the bottom line:
| Metric | Air Products and Chemicals, Inc. (APD) | PPG Industries, Inc. (PPG) |
|---|---|---|
| Revenue | 12.0B | 15.9B |
| Cost of Revenue | 8.3B | 9.8B |
| Operating Expenses | 4.7B | 3.9B |
| Gross Profit | 3.8B | 6.0B |
| EBITDA | 1.3B | 2.8B |
| EBIT | -227M | 2.3B |
| Interest Expense | 214M | 241M |
| Net Income | -395M | 1.6B |
| EPS | -1.77 | 6.96 |
| Fiscal Year | 2025 | 2025 |
Income Statement Analysis: The Bottom-Line Duel
This income statement comparison reveals which company operates its corporate engine with superior efficiency and profitability.
Air Products and Chemicals, Inc. Analysis
Air Products’ revenue declined slightly in 2025 to 12B from 12.1B in 2024, while net income swung sharply negative to -394M from a strong 3.8B. The gross margin remains decent at 31.4%, but the net margin collapsed to -3.3%, reflecting operational and non-operating challenges that severely hurt profitability and momentum.
PPG Industries, Inc. Analysis
PPG’s revenue edged up to 15.9B in 2025, nearly flat compared to 2024. Gross margin holds firm at 38%, and net margin improved to a healthy 9.9%. Net income rose to 1.58B from 1.12B, driven by solid EBIT growth and margin expansion, signaling resilient operational efficiency and profit momentum despite modest revenue growth.
Margin Strength vs. Profit Resilience
PPG clearly outperforms Air Products in profitability and margin control, boasting a robust 9.9% net margin versus Air Products’ -3.3%. While Air Products shows revenue resilience over five years, its steep net income decline marks a fundamental weakness. PPG’s profile, with margin expansion and positive earnings growth, offers a more compelling operational model for investors focused on sustained profit generation.
Financial Ratios Comparison
These vital ratios act as a diagnostic tool to expose the underlying fiscal health, valuation premiums, and capital efficiency of the companies analyzed:
| Ratios | Air Products and Chemicals, Inc. (APD) | PPG Industries, Inc. (PPG) |
|---|---|---|
| ROE | -2.63% (2025) | -44.48% (2025) |
| ROIC | -1.82% (2025) | 43.13% (2025) |
| P/E | -154.0 (2025) | 14.71 (2025) |
| P/B | 4.04 (2025) | -6.54 (2025) |
| Current Ratio | 1.38 (2025) | 1.62 (2025) |
| Quick Ratio | 1.20 (2025) | 1.22 (2025) |
| D/E (Debt-to-Equity) | 1.23 (2025) | -2.10 (2025) |
| Debt-to-Assets | 44.8% (2025) | 93.6% (2025) |
| Interest Coverage | -4.10 (2025) | 9.00 (2025) |
| Asset Turnover | 0.29 (2025) | 1.99 (2025) |
| Fixed Asset Turnover | 0.46 (2025) | 0 (2025) |
| Payout ratio | -401.5% (2025) | 39.8% (2025) |
| Dividend yield | 2.61% (2025) | 2.71% (2025) |
| Fiscal Year | 2025 | 2025 |
Efficiency & Valuation Duel: The Vital Signs
Financial ratios act as the company’s DNA, revealing hidden risks and operational excellence critical to investment decisions.
Air Products and Chemicals, Inc.
Air Products shows weak profitability with negative ROE and margins, signaling operational challenges. Its P/E is favorable but a high P/B ratio indicates stretched valuation. The company offers a 2.61% dividend yield, suggesting steady shareholder returns despite reinvestment constraints.
PPG Industries, Inc.
PPG presents mixed signals: strong ROIC and reasonable net margin contrast with a sharply negative ROE. Its P/E is attractively low, and the company maintains a 2.71% dividend yield. High debt-to-assets ratio raises concerns, but operational efficiency remains commendable.
Valuation Stretch vs. Operational Strength
PPG balances valuation and operational efficiency better than Air Products, which struggles with profitability and valuation stretch. PPG fits investors seeking operational resilience; Air Products suits those prioritizing dividend income amid risks.
Which one offers the Superior Shareholder Reward?
I observe that Air Products and Chemicals (APD) and PPG Industries (PPG) both pay dividends with yields near 2.6% and 2.7%, respectively. APD sustains a payout ratio around 40%, supported by strong free cash flow coverage despite recent dips. PPG’s payout ratio is slightly lower near 40%, with more modest free cash flow and operating cash flow ratios. APD’s buyback activity appears more aggressive and consistent, enhancing shareholder value amid capital intensity. PPG’s significant debt levels and weaker coverage ratios raise sustainability concerns. I conclude APD offers a more attractive total return profile in 2026, balancing steady dividends with robust buybacks and healthier capital allocation.
Comparative Score Analysis: The Strategic Profile
The radar chart reveals the fundamental DNA and trade-offs of Air Products and Chemicals, Inc. and PPG Industries, Inc., highlighting their financial strengths and weaknesses:
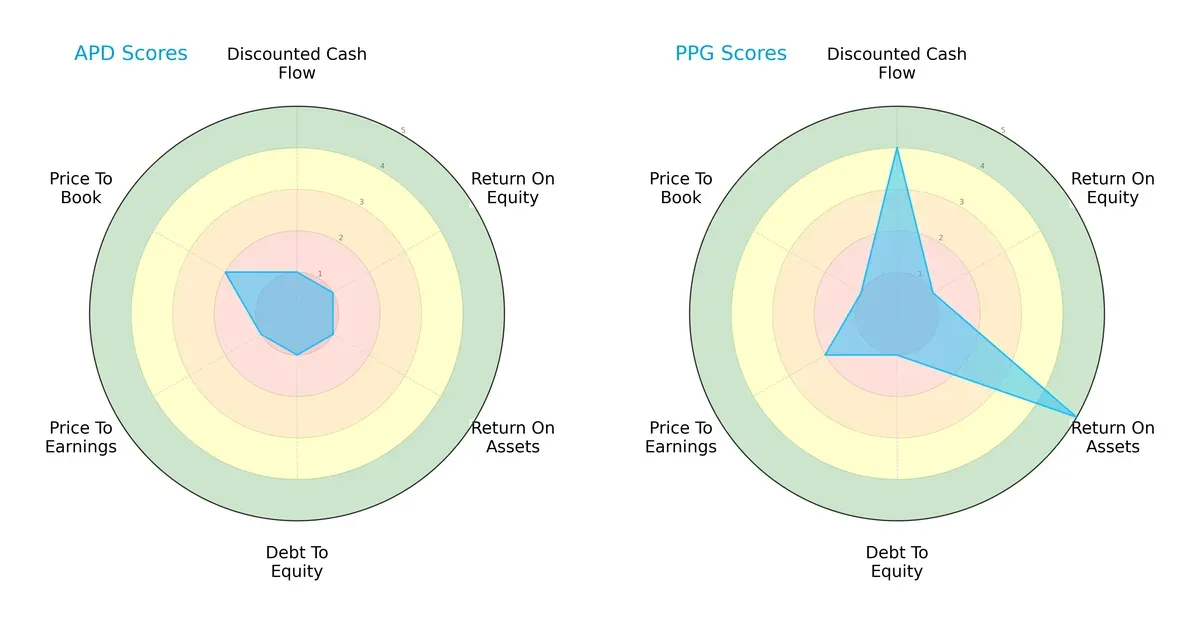
PPG delivers a more balanced profile, excelling in discounted cash flow (score 4) and return on assets (score 5). Air Products lags with uniformly low scores (mostly 1), relying slightly on price-to-book valuation (score 2). Both struggle with return on equity and debt-to-equity, but PPG’s edge in asset efficiency is notable.
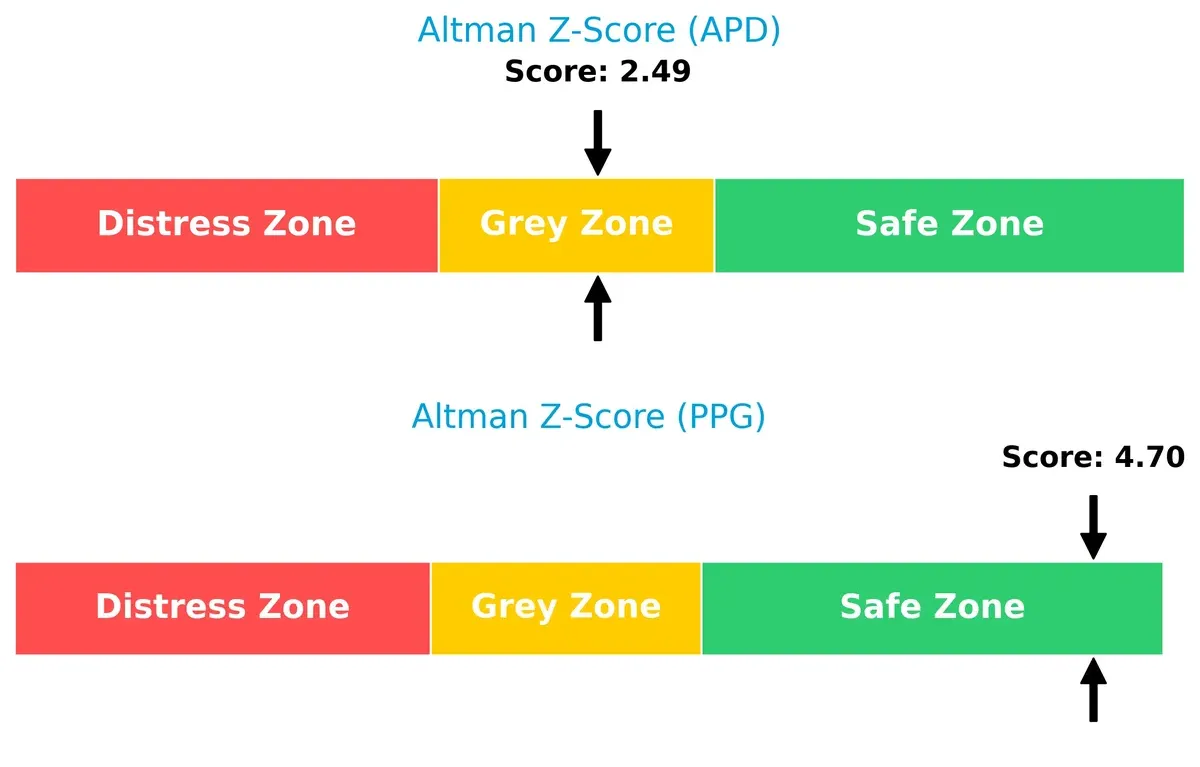
Bankruptcy Risk: Solvency Showdown
The Altman Z-Score difference shows PPG (4.7) in a safe zone, signaling strong long-term survival prospects versus Air Products (2.5) in a grey zone, indicating moderate bankruptcy risk in this cycle:
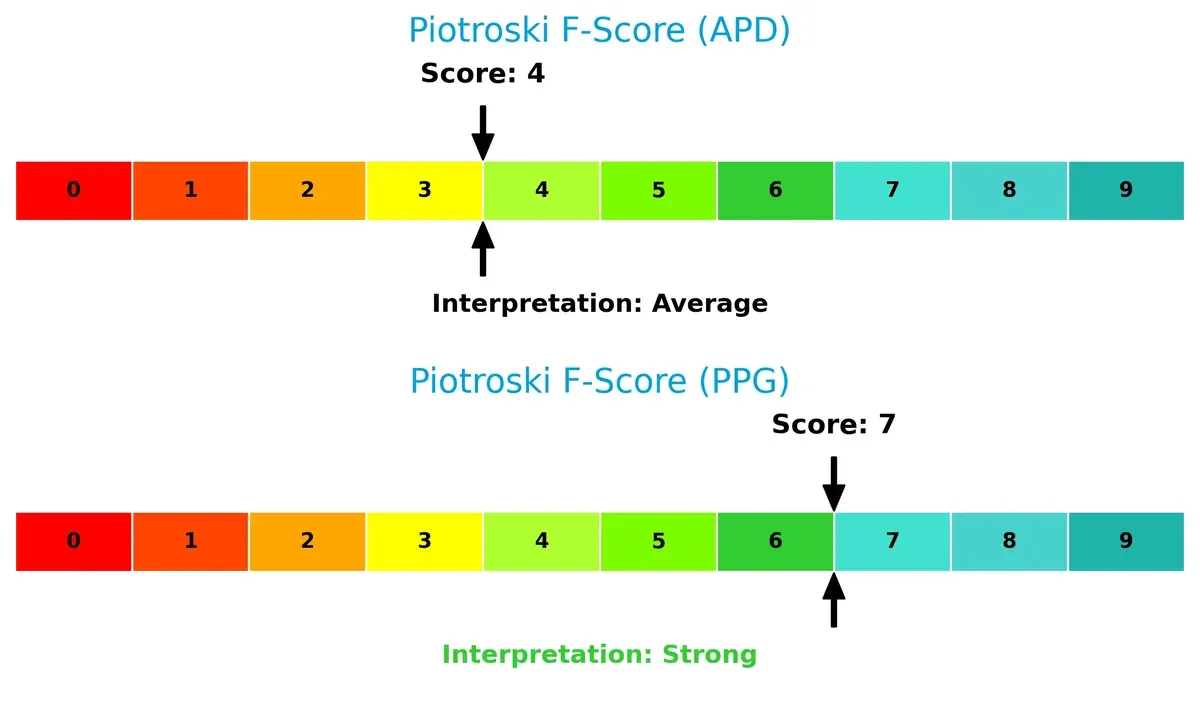
Financial Health: Quality of Operations
PPG’s Piotroski F-Score of 7 indicates strong financial health and operational quality, while Air Products scores a middling 4, flagging potential internal weaknesses compared to its peer:
How are the two companies positioned?
This section dissects the operational DNA of APD and PPG by comparing their revenue distribution and internal dynamics, including strengths and weaknesses. The goal is to confront their economic moats and identify which model offers the most resilient, sustainable competitive advantage today.
Revenue Segmentation: The Strategic Mix
This visual comparison dissects how Air Products and Chemicals, Inc. and PPG Industries, Inc. diversify their income streams and highlights their primary sector bets:
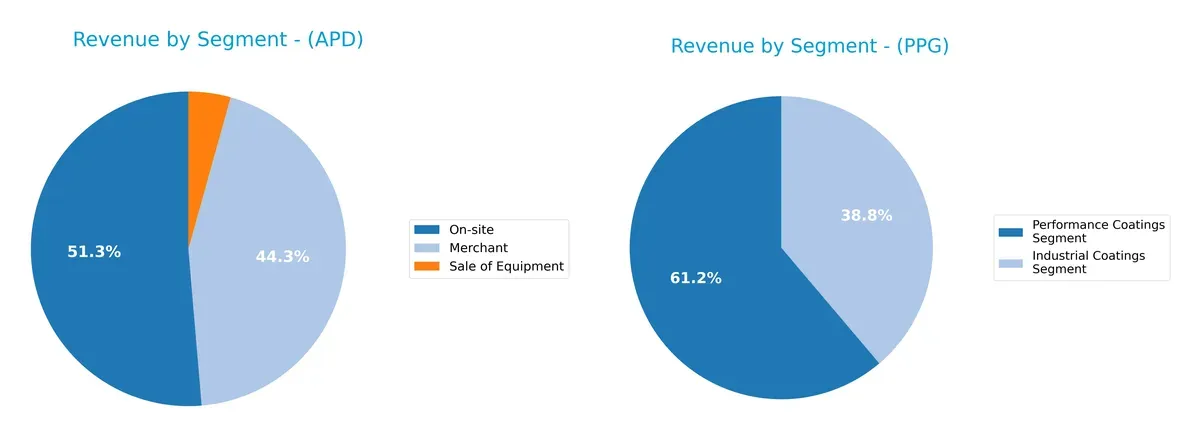
Air Products pivots on two strong segments: On-site at $6.18B and Merchant at $5.34B in 2025, with a smaller $520M equipment sale. PPG leans heavily on two coatings segments, with Performance Coatings dwarfs Industrial Coatings at $11.16B versus $7.08B in 2023. Air Products shows moderate diversification, reducing concentration risk, while PPG’s reliance on coatings signals exposure to cyclicality but benefits from market leadership in industrial finishes.
Strengths and Weaknesses Comparison
This table compares the Strengths and Weaknesses of APD and PPG based on diversification, profitability, financials, innovation, global presence, and market share:
APD Strengths
- Diversified revenue streams across Merchant, On-site, and Equipment segments
- Stable global presence in Americas, Asia, Europe, Middle East
- Favorable quick ratio and dividend yield reflect liquidity and shareholder return
PPG Strengths
- Strong profitability with high ROIC and favorable net margin
- Favorable leverage metrics and excellent interest coverage
- Leading market share in Industrial and Performance Coatings segments
APD Weaknesses
- Negative net margin, ROE, and ROIC indicate poor profitability
- High debt-to-equity ratio and negative interest coverage raise financial risk
- Low asset turnover suggests inefficient asset use
PPG Weaknesses
- Negative ROE and extremely high debt-to-assets ratio imply financial distress
- Zero fixed asset turnover signals potential asset utilization issues
- Less diversified product segmentation with dependence on coatings
Both companies show clear strategic contrasts. APD’s diversified global footprint contrasts with weaker profitability and financial health. PPG displays robust profitability and financial metrics but carries elevated leverage and less diversification. These differences shape each firm’s strategic challenges and opportunities going forward.
The Moat Duel: Analyzing Competitive Defensibility
A structural moat stands as the sole barrier protecting long-term profits from relentless competitive erosion. Let’s dissect the moats of two specialty chemical giants:
Air Products and Chemicals, Inc. (APD): Capital-Intensive Asset Moat
APD’s moat hinges on high barriers to entry via specialized gas production assets. Yet, declining ROIC and shrinking margins suggest its moat is eroding in 2026 amid operational challenges.
PPG Industries, Inc. (PPG): Brand and Innovation Moat
PPG leverages strong brand loyalty and innovation in coatings, driving superior ROIC and stable margins. Its growing profitability signals a deepening moat with expansion into new markets this year.
Asset Base vs. Innovation: Which Moat Holds Stronger?
PPG’s accelerating ROIC and margin expansion reveal a wider, more durable moat than APD’s capital-heavy, value-eroding position. PPG stands better equipped to defend and grow its market share.
Which stock offers better returns?
Over the past 12 months, Air Products and Chemicals, Inc. showed steady price appreciation with accelerating momentum, while PPG Industries, Inc. faced a longer-term decline despite strong recent gains.
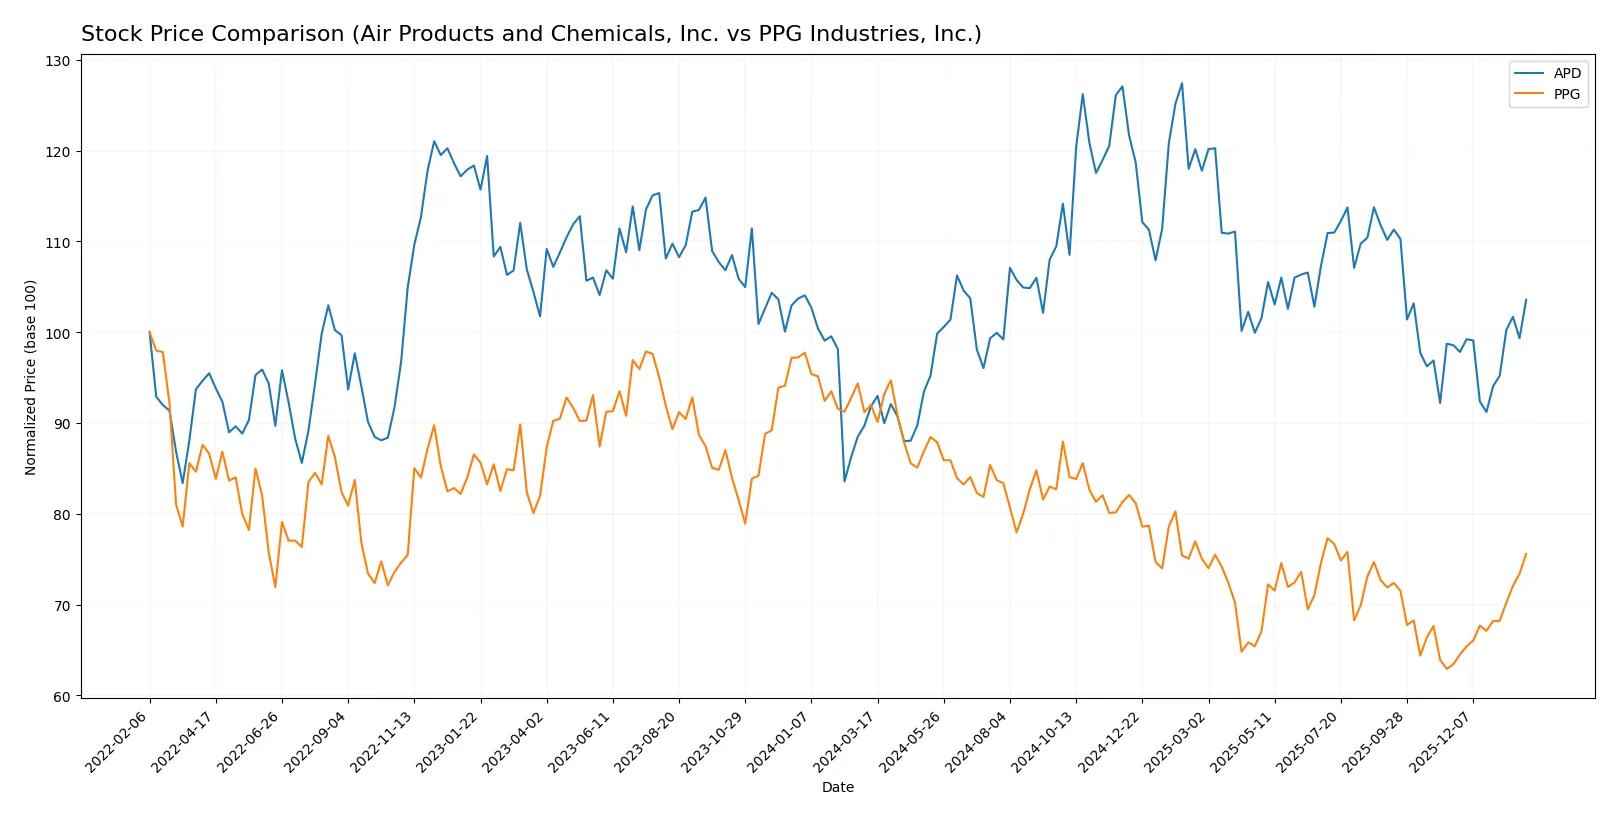
Trend Comparison
Air Products and Chemicals, Inc. posted a bullish 12.79% price increase over the past year, with accelerating upward momentum and a high volatility level of 25.54. The stock hit a peak of 335.26 and a low of 231.53.
PPG Industries, Inc. experienced a bearish trend with a -17.84% price drop over the same period, but showed accelerated recovery recently, gaining 19.17% in the last two and a half months amid lower volatility at 5.4.
PPG’s recent rally contrasts with its annual decline, while Air Products sustained a strong annual uptrend. Overall, Air Products delivered the highest market performance over the full year.
Target Prices
Analysts show a moderate upside potential for both Air Products and Chemicals, Inc. and PPG Industries, Inc.
| Company | Target Low | Target High | Consensus |
|---|---|---|---|
| Air Products and Chemicals, Inc. | 250 | 335 | 280 |
| PPG Industries, Inc. | 115 | 135 | 126 |
The target consensus for Air Products at $280 suggests a modest 3% upside versus the current $272.5 stock price. PPG’s $126 consensus implies an 8.9% potential increase from its $115.63 market price.

Don’t Let Luck Decide Your Entry Point
Optimize your entry points with our advanced ProRealTime indicators. You’ll get efficient buy signals with precise price targets for maximum performance. Start outperforming now!
How do institutions grade them?
Here is a summary of recent institutional grades for Air Products and Chemicals, Inc. and PPG Industries, Inc.:
Air Products and Chemicals, Inc. Grades
The following table shows the latest grades from major financial institutions for Air Products and Chemicals, Inc.:
| Grading Company | Action | New Grade | Date |
|---|---|---|---|
| Citigroup | Maintain | Neutral | 2026-01-21 |
| B of A Securities | Upgrade | Neutral | 2026-01-08 |
| Wells Fargo | Downgrade | Equal Weight | 2025-12-19 |
| Mizuho | Maintain | Outperform | 2025-12-18 |
| Citigroup | Downgrade | Neutral | 2025-12-15 |
| UBS | Downgrade | Neutral | 2025-12-12 |
| Argus Research | Maintain | Buy | 2025-12-11 |
| Evercore ISI Group | Maintain | Outperform | 2025-11-11 |
| JP Morgan | Maintain | Neutral | 2025-11-07 |
| Wells Fargo | Maintain | Overweight | 2025-11-07 |
PPG Industries, Inc. Grades
The following table summarizes recent institutional grades for PPG Industries, Inc.:
| Grading Company | Action | New Grade | Date |
|---|---|---|---|
| UBS | Maintain | Neutral | 2026-01-29 |
| JP Morgan | Maintain | Overweight | 2026-01-29 |
| Jefferies | Maintain | Hold | 2026-01-29 |
| Citigroup | Maintain | Buy | 2026-01-29 |
| Wells Fargo | Maintain | Overweight | 2026-01-29 |
| RBC Capital | Maintain | Sector Perform | 2026-01-29 |
| Goldman Sachs | Maintain | Buy | 2026-01-29 |
| Mizuho | Maintain | Outperform | 2026-01-28 |
| Citigroup | Maintain | Buy | 2025-12-18 |
| JP Morgan | Maintain | Overweight | 2025-11-21 |
Which company has the best grades?
PPG Industries, Inc. consistently receives stronger ratings, including multiple Buy and Overweight grades. Air Products and Chemicals, Inc. shows more Neutral and downgraded grades. Investors may interpret PPG’s ratings as reflecting higher confidence from analysts.
Risks specific to each company
The following categories identify the critical pressure points and systemic threats facing both firms in the 2026 market environment:
1. Market & Competition
Air Products and Chemicals, Inc.
- Faces pressure from specialty gas competitors and shifting industrial demand.
PPG Industries, Inc.
- Competes fiercely in coatings amid innovation and raw material cost pressures.
2. Capital Structure & Debt
Air Products and Chemicals, Inc.
- Debt-to-equity ratio is high at 1.23, signaling leverage risks; interest coverage is negative.
PPG Industries, Inc.
- Extremely high debt-to-assets at 93.55% raises solvency concerns despite strong interest coverage.
3. Stock Volatility
Air Products and Chemicals, Inc.
- Beta of 0.88 suggests lower volatility than the market.
PPG Industries, Inc.
- Beta of 1.16 indicates above-market volatility, increasing price risk.
4. Regulatory & Legal
Air Products and Chemicals, Inc.
- Exposure to environmental regulations in gases and energy sectors.
PPG Industries, Inc.
- Subject to stringent regulations on coatings, especially volatile organic compounds (VOC).
5. Supply Chain & Operations
Air Products and Chemicals, Inc.
- Complex logistics for gas production and equipment manufacturing create operational risks.
PPG Industries, Inc.
- Raw material price volatility and manufacturing complexity weigh on margins.
6. ESG & Climate Transition
Air Products and Chemicals, Inc.
- Strategic hydrogen initiatives align with climate trends but require heavy capital.
PPG Industries, Inc.
- Faces challenges transitioning coatings portfolio to sustainable alternatives.
7. Geopolitical Exposure
Air Products and Chemicals, Inc.
- Global operations sensitive to trade disruptions and energy market volatility.
PPG Industries, Inc.
- International footprint exposes it to tariff and regulatory fluctuations.
Which company shows a better risk-adjusted profile?
Air Products grapples with heavy leverage and poor profitability metrics, reflected in its negative interest coverage and unfavorable ROIC versus WACC. PPG, despite a worrying debt load relative to assets, shows stronger operational efficiency and a safer Altman Z-Score. PPG’s higher beta flags elevated stock volatility, yet its balance sheet robustness and stronger Piotroski Score suggest a more resilient risk profile. For Air Products, the critical risk is financial distress from leverage and operational inefficiencies. PPG’s main concern is its high debt burden relative to assets. Overall, PPG demonstrates a better risk-adjusted position, supported by its safe-zone Altman Z-Score and more favorable financial ratios.
Final Verdict: Which stock to choose?
Air Products and Chemicals, Inc. (APD) showcases a superpower in its resilient gross margin and dividend yield, appealing for income-focused investors. However, its declining ROIC and persistent value destruction highlight a point of vigilance. It fits portfolios aiming for steady income but tolerant of cyclical operational challenges.
PPG Industries, Inc. (PPG) commands a strategic moat through its strong and growing ROIC, reflecting efficient capital use and a durable competitive advantage. Its favorable income statement profile and financial stability offer better safety than APD. PPG suits portfolios seeking growth combined with reasonable valuation discipline.
If you prioritize capital efficiency and sustained value creation, PPG outshines due to its robust and improving profitability. However, if your focus leans toward income generation despite operational headwinds, APD might fit that scenario better. Both require careful risk management given their distinct financial profiles and market dynamics.
Disclaimer: Investment carries a risk of loss of initial capital. The past performance is not a reliable indicator of future results. Be sure to understand risks before making an investment decision.
Go Further
I encourage you to read the complete analyses of Air Products and Chemicals, Inc. and PPG Industries, Inc. to enhance your investment decisions: