Home > Comparison > Basic Materials > APD vs LYB
The strategic rivalry between Air Products and Chemicals, Inc. and LyondellBasell Industries N.V. shapes the specialty chemicals sector’s evolution. Air Products operates as a global provider of atmospheric and specialty gases with a capital-intensive model focused on industrial gas infrastructure. In contrast, LyondellBasell emphasizes diversified chemical production with integrated refining and polymer solutions. This analysis explores which company offers superior risk-adjusted returns amid their contrasting operational strategies and sector leadership ambitions.
Table of contents
Companies Overview
Air Products and Chemicals and LyondellBasell lead in the specialty chemicals market, shaping industrial supply chains globally.
Air Products and Chemicals, Inc.: Global Leader in Industrial Gases
Air Products dominates the atmospheric and specialty gases market. Its core revenue stems from selling oxygen, nitrogen, argon, and process gases worldwide. In 2026, it focuses strategically on hydrogen compression, partnering with Baker Hughes to expand clean energy solutions, reinforcing its competitive edge in gas technologies and equipment manufacturing.
LyondellBasell Industries N.V.: Polyolefins and Refining Powerhouse
LyondellBasell excels in producing olefins, polyolefins, and refining crude oil into fuels. Its core revenue relies on diverse chemical segments including polyethylene, polypropylene, and advanced polymers. The company concentrates on expanding its global refining footprint and licensing proprietary chemical technologies to sustain innovation and market reach.
Strategic Collision: Similarities & Divergences
Both companies emphasize specialty chemicals but diverge sharply in business models: Air Products focuses on gases and equipment, LyondellBasell on polymers and refining. Their primary battleground is industrial material supply, with Air Products leading in clean energy gases and LyondellBasell in polyolefin production. Investors face contrasting profiles: stable, tech-driven growth versus volume-driven chemical manufacturing.
Income Statement Comparison
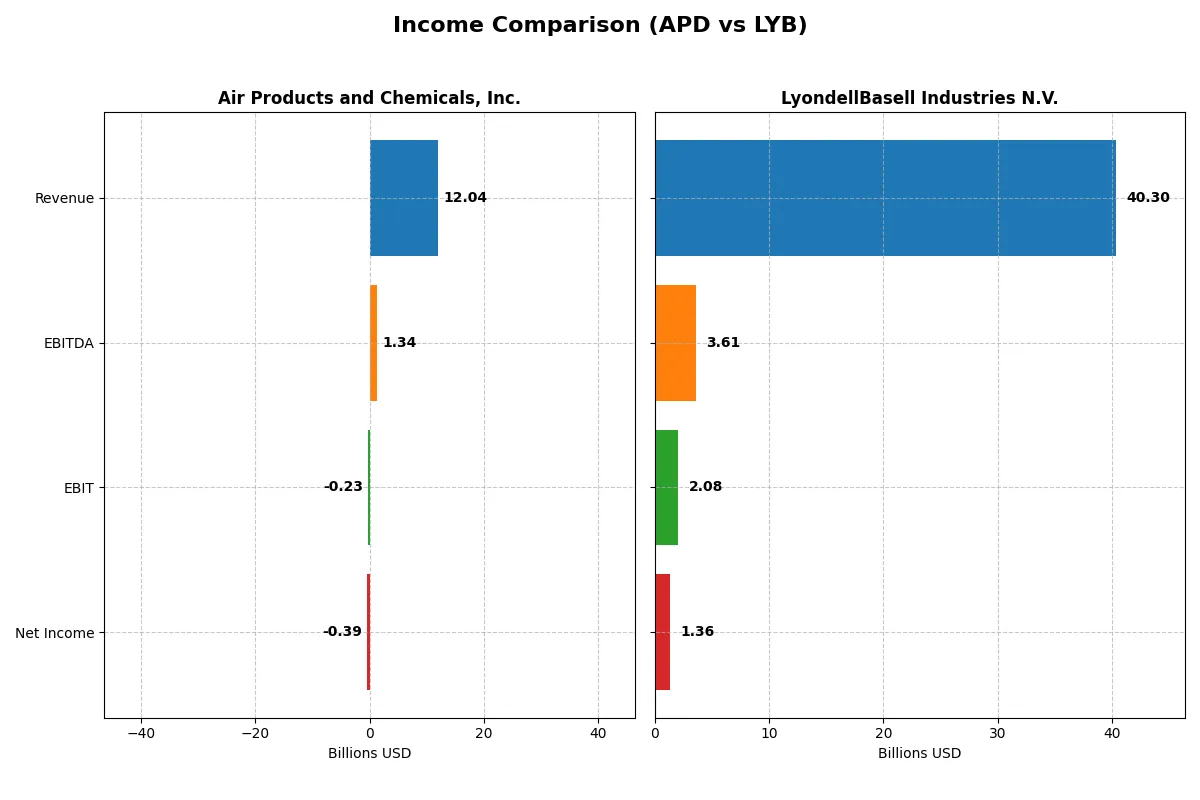
The following data dissects the core profitability and scalability of both corporate engines to reveal who dominates the bottom line:
| Metric | Air Products and Chemicals, Inc. (APD) | LyondellBasell Industries N.V. (LYB) |
|---|---|---|
| Revenue | 12.0B | 40.3B |
| Cost of Revenue | 8.3B | 35.7B |
| Operating Expenses | 4.7B | 2.7B |
| Gross Profit | 3.8B | 4.6B |
| EBITDA | 1.3B | 3.6B |
| EBIT | -0.2B | 2.1B |
| Interest Expense | 0.2B | 0.5B |
| Net Income | -0.4B | 1.4B |
| EPS | -1.77 | 4.16 |
| Fiscal Year | 2025 | 2024 |
Income Statement Analysis: The Bottom-Line Duel
This income statement comparison reveals which company manages its revenue and expenses most efficiently to generate sustainable profits.
Air Products and Chemicals, Inc. Analysis
Air Products posted a slight revenue decline from $12.1B in 2024 to $12.0B in 2025, while net income swung sharply from a $3.8B profit to a $395M loss. The gross margin remains healthy at 31.4%, but a negative EBIT margin of -1.9% highlights operational challenges. The recent downturn signals deteriorating momentum and margin pressure.
LyondellBasell Industries N.V. Analysis
LyondellBasell’s revenue edged down 2% to $40.3B in 2024, with net income dropping 36% to $1.36B. Gross margin stands at a modest 11.3%, and a 5.2% EBIT margin shows moderate operational efficiency. Despite recent declines, the firm sustains positive profitability, albeit with weaker margin trends compared to prior years.
Margin Strength vs. Profitability Consistency
Air Products offers superior gross margins but suffered a steep net income reversal in 2025, undermining recent profitability. LyondellBasell maintains consistent positive net income and EBIT margins, though at lower margin levels. For investors, the choice hinges on preferring high-margin volatility or steadier, moderate-margin profitability.
Financial Ratios Comparison
These vital ratios act as a diagnostic tool to expose the underlying fiscal health, valuation premiums, and capital efficiency of the companies compared below:
| Ratios | Air Products and Chemicals, Inc. (APD) | LyondellBasell Industries N.V. (LYB) |
|---|---|---|
| ROE | -2.63% (2025) | 10.91% (2024) |
| ROIC | -1.82% (2025) | 5.15% (2024) |
| P/E | -154.0 (2025) | 17.75 (2024) |
| P/B | 4.04 (2025) | 1.94 (2024) |
| Current Ratio | 1.38 (2025) | 1.83 (2024) |
| Quick Ratio | 1.20 (2025) | 1.13 (2024) |
| D/E | 1.23 (2025) | 1.04 (2024) |
| Debt-to-Assets | 44.8% (2025) | 36.2% (2024) |
| Interest Coverage | -4.10 (2025) | 3.78 (2024) |
| Asset Turnover | 0.29 (2025) | 1.13 (2024) |
| Fixed Asset Turnover | 0.46 (2025) | 2.44 (2024) |
| Payout Ratio | -401.5% (2025) | 126.5% (2024) |
| Dividend Yield | 2.61% (2025) | 7.13% (2024) |
| Fiscal Year | 2025 | 2024 |
Efficiency & Valuation Duel: The Vital Signs
Financial ratios act as the company’s DNA, unveiling hidden risks and operational strengths that raw numbers alone cannot reveal.
Air Products and Chemicals, Inc.
Air Products shows weak profitability with negative ROE and margins, signaling operational challenges. Its P/E ratio appears favorable due to negative earnings, but a high P/B ratio suggests stretched valuation. The company rewards shareholders with a 2.6% dividend yield, reflecting some income return despite reinvestment limits.
LyondellBasell Industries N.V.
LyondellBasell delivers moderate profitability, with a neutral ROE of 10.9% and a P/E of 17.75, indicating fair valuation. The company maintains strong operational efficiency as seen in asset turnover. A 7.1% dividend yield highlights a robust shareholder return, balancing income with stable cash flow generation.
Operational Efficiency vs. Valuation Discipline
LyondellBasell offers a better blend of profitability and valuation stability than Air Products, which struggles with negative returns and stretched book value. Investors seeking income and operational resilience may find LyondellBasell’s profile more aligned with risk-conscious portfolios.
Which one offers the Superior Shareholder Reward?
I compare Air Products and Chemicals, Inc. (APD) and LyondellBasell Industries N.V. (LYB) by assessing dividend yield, payout ratios, and buyback intensity. APD yields around 2.6% with a payout ratio near 41%, but it posts negative free cash flow, raising sustainability concerns. LYB offers a striking 7.1% dividend yield with payout exceeding 126%, yet it generates strong free cash flow of 6B, supporting distributions and buybacks. LYB’s robust operating cash flow and capex coverage ratio of 2.08 indicate a sustainable payout model. APD’s weak free cash flow and negative margins pose risks despite steady dividends. LYB’s aggressive buybacks and high yield create a more attractive total return profile for 2026 investors. I conclude LYB offers the superior shareholder reward due to its sustainable, high-yield distribution and strong cash flow backing.
Comparative Score Analysis: The Strategic Profile
The radar chart reveals the fundamental DNA and trade-offs of Air Products and Chemicals, Inc. and LyondellBasell Industries N.V., highlighting their financial strengths and weaknesses:
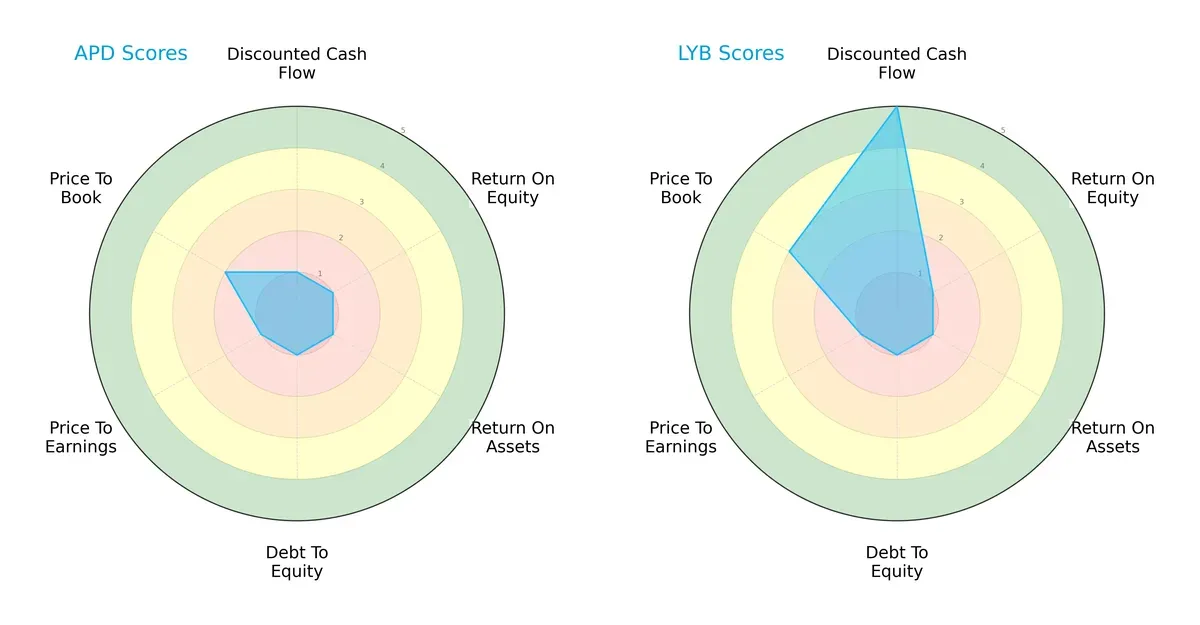
Air Products and Chemicals shows a uniformly low score profile, reflecting consistent struggles across DCF, ROE, ROA, Debt/Equity, and P/E valuations. LyondellBasell stands out with a strong discounted cash flow score, suggesting undervaluation, but shares equally weak profitability and leverage metrics. LyondellBasell’s profile hinges on valuation advantage, while Air Products exhibits a more uniformly weak financial base.
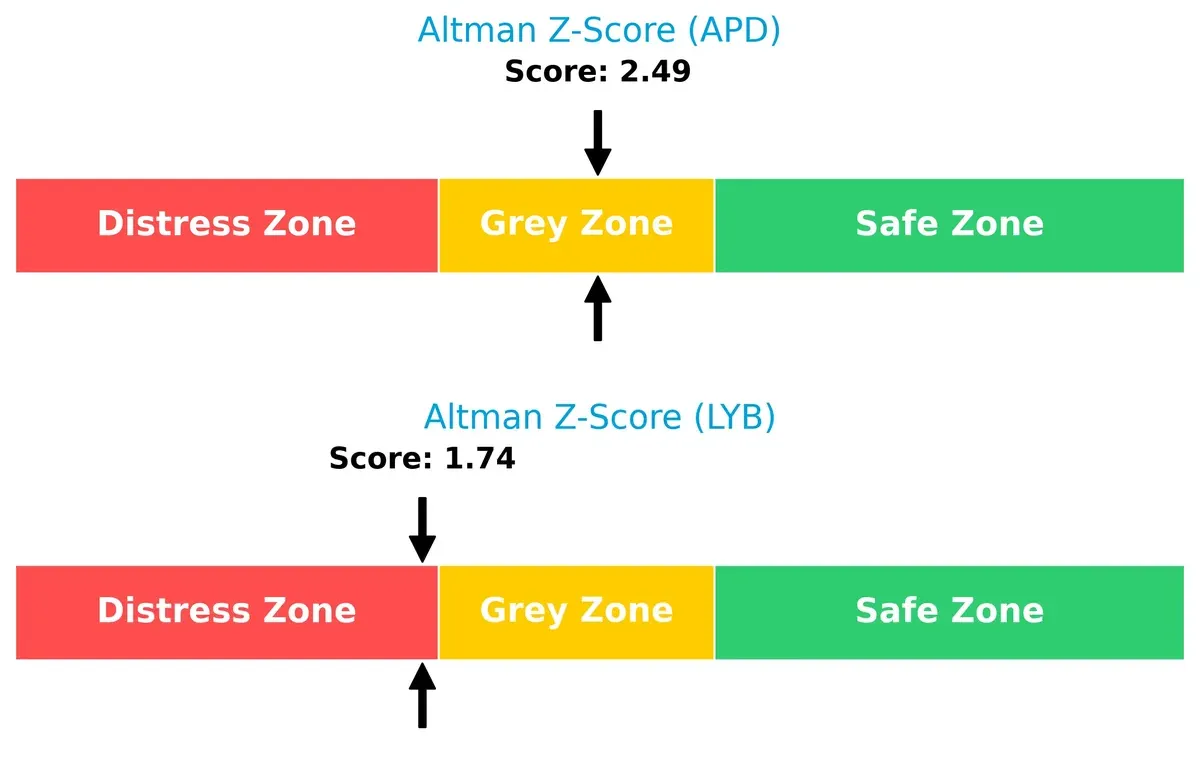
Bankruptcy Risk: Solvency Showdown
The Altman Z-Score gap signals a crucial risk difference: Air Products is in the grey zone (2.49), moderately shielded from bankruptcy, while LyondellBasell’s 1.74 places it in the distress zone, indicating higher long-term survival risk.
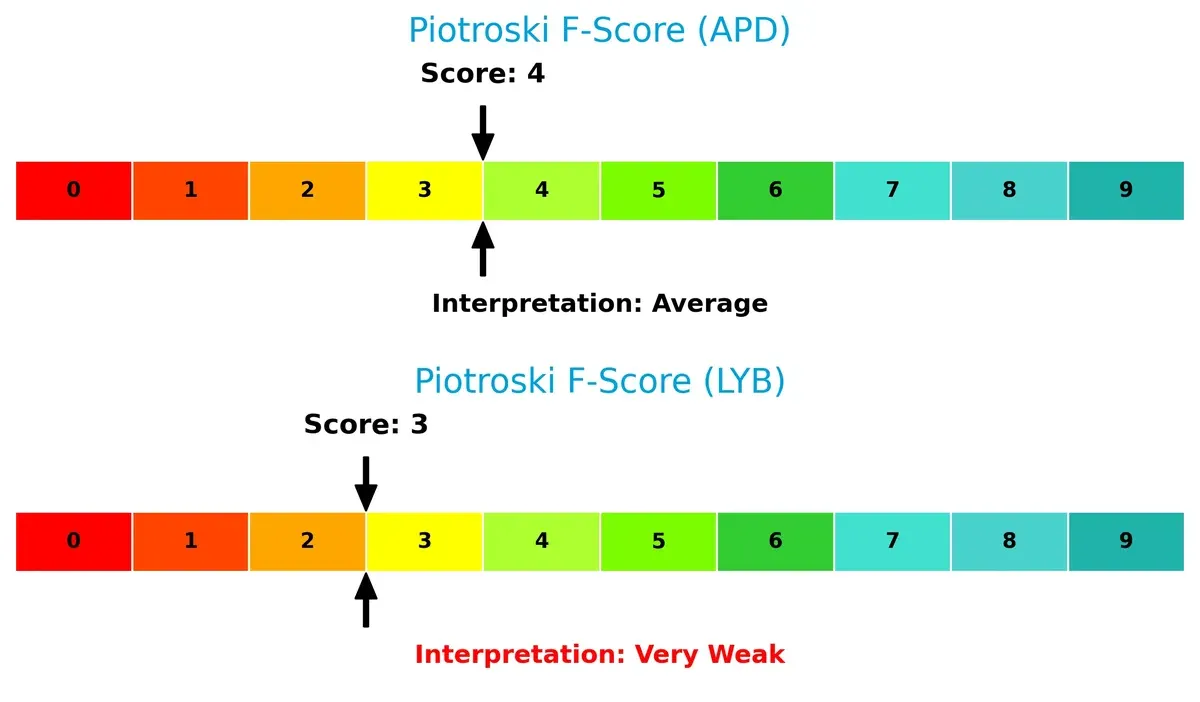
Financial Health: Quality of Operations
Air Products posts a Piotroski F-Score of 4, indicating average financial health, whereas LyondellBasell’s 3 signals very weak operational quality. This suggests Air Products manages internal metrics with slightly better discipline, despite overall weakness.
How are the two companies positioned?
This section dissects the operational DNA of APD and LYB by comparing their revenue distribution and internal dynamics, including strengths and weaknesses. The goal is to confront their economic moats and identify which model delivers the most resilient, sustainable advantage today.
Revenue Segmentation: The Strategic Mix
This visual comparison dissects how Air Products and Chemicals, Inc. and LyondellBasell Industries N.V. diversify income and where their primary sector bets lie:
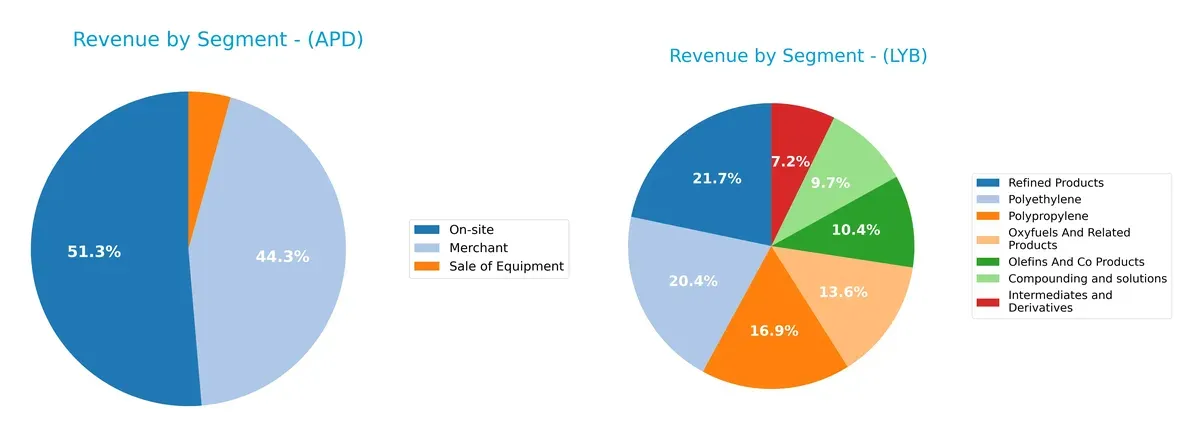
Air Products and Chemicals anchors its revenue in two main segments: On-site at $6.18B and Merchant at $5.34B, showing moderate diversification with a smaller equipment sales portion. LyondellBasell leans heavily on Refined Products at $8.08B and Polyethylene at $7.58B, but also spreads income across Polypropylene, Oxyfuels, and intermediates. LyondellBasell’s broad portfolio suggests infrastructure dominance, while Air Products’ focus hints at ecosystem lock-in but with some concentration risk.
Strengths and Weaknesses Comparison
This table compares the strengths and weaknesses of Air Products and Chemicals, Inc. (APD) and LyondellBasell Industries N.V. (LYB):
APD Strengths
- Diverse revenue streams across Merchant, On-site, and Equipment sales
- Global presence in Americas, Asia, and Europe
- Favorable quick ratio at 1.2 indicates liquidity
- Dividend yield of 2.61% supports income investors
LYB Strengths
- Broad product portfolio including Polyethylene, Polypropylene, and Refined Products
- Strong asset turnover at 1.13 reflects operational efficiency
- Favorable current and quick ratios (1.83 and 1.13) show sound liquidity
- Global footprint with significant US and European sales
APD Weaknesses
- Negative net margin (-3.28%) and ROE (-2.63%) highlight profitability challenges
- High debt-to-equity ratio (1.23) and negative interest coverage (-1.06) raise financial risk
- Low asset turnover (0.29) signals inefficiency
- Price-to-book ratio of 4.04 suggests possible overvaluation
LYB Weaknesses
- Net margin modest at 3.37% and neutral ROE (10.91%)
- Debt-to-equity ratio of 1.04 indicates leverage concerns
- Interest coverage moderate at 4.33
- WACC unavailable, limiting cost of capital assessment
APD shows diversified global sales but struggles with profitability and financial leverage. LYB maintains stronger operational efficiency and liquidity but faces moderate profitability and leverage risks. Both companies exhibit contrasting financial health that will shape their strategic focus.
The Moat Duel: Analyzing Competitive Defensibility
Structural moats are the only reliable shield protecting long-term profits from relentless competitive erosion:
Air Products and Chemicals, Inc.: Intangible Assets Moat
Air Products leverages patented gas production technologies creating high switching costs. Yet, declining ROIC and margin pressure signal weakening moat durability heading into 2026.
LyondellBasell Industries N.V.: Cost Advantage Moat
LyondellBasell exploits scale and integrated refining-polymer operations, driving stable margins despite industry headwinds. Its modest ROIC trend suggests steady, if unspectacular, competitive resilience.
Technology Innovation vs. Scale Efficiency: The Moat Contest
Air Products’ intangible asset moat appears eroding with falling profitability. LyondellBasell’s cost advantage is more stable but less differentiated. I see LyondellBasell better positioned to defend market share amid chemical sector volatility.
Which stock offers better returns?
Over the past 12 months, Air Products and Chemicals, Inc. showed a strong bullish price trend with accelerating gains, while LyondellBasell Industries N.V. experienced a steep bearish decline despite recent positive momentum.
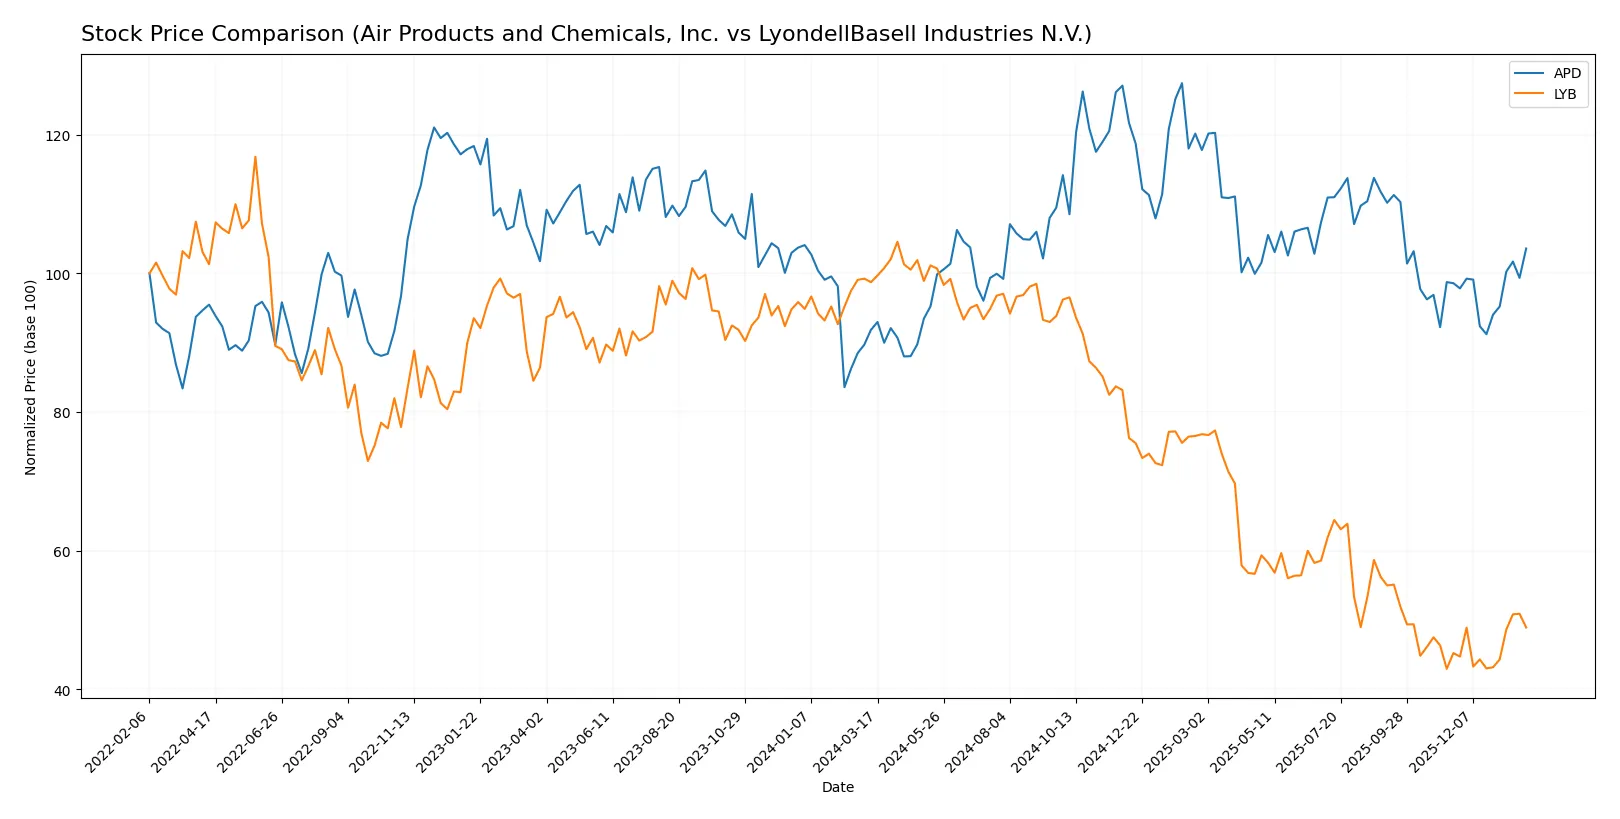
Trend Comparison
Air Products and Chemicals, Inc. posted a 12.79% price increase over the last year, reflecting a bullish trend with accelerating momentum and a high volatility level of 25.54. The stock reached a peak of 335.26 and a low of 231.53.
LyondellBasell Industries N.V. suffered a 50.48% price drop over the same period, signaling a bearish trend with accelerating decline. Its volatility is moderate at 20.23, with price ranging between 43.02 and 104.78.
Comparing both, Air Products and Chemicals, Inc. outperformed LyondellBasell Industries N.V. by delivering the highest market returns amid contrasting trend directions.
Target Prices
Analysts present a moderate upside potential for both Air Products and Chemicals, Inc. and LyondellBasell Industries N.V.
| Company | Target Low | Target High | Consensus |
|---|---|---|---|
| Air Products and Chemicals, Inc. | 250 | 335 | 280 |
| LyondellBasell Industries N.V. | 36 | 51 | 45.75 |
The target consensus for Air Products at $280 suggests a slight premium to its current $272.5 price, signaling steady confidence. LyondellBasell’s $45.75 consensus sits just below the current $49, indicating cautious expectations from analysts.

Don’t Let Luck Decide Your Entry Point
Optimize your entry points with our advanced ProRealTime indicators. You’ll get efficient buy signals with precise price targets for maximum performance. Start outperforming now!
How do institutions grade them?
Air Products and Chemicals, Inc. Grades
The table below summarizes recent grades from established financial institutions for Air Products and Chemicals, Inc.:
| Grading Company | Action | New Grade | Date |
|---|---|---|---|
| Citigroup | Maintain | Neutral | 2026-01-21 |
| B of A Securities | Upgrade | Neutral | 2026-01-08 |
| Wells Fargo | Downgrade | Equal Weight | 2025-12-19 |
| Mizuho | Maintain | Outperform | 2025-12-18 |
| Citigroup | Downgrade | Neutral | 2025-12-15 |
| UBS | Downgrade | Neutral | 2025-12-12 |
| Argus Research | Maintain | Buy | 2025-12-11 |
| Evercore ISI Group | Maintain | Outperform | 2025-11-11 |
| JP Morgan | Maintain | Neutral | 2025-11-07 |
| Wells Fargo | Maintain | Overweight | 2025-11-07 |
LyondellBasell Industries N.V. Grades
The table below summarizes recent grades from established financial institutions for LyondellBasell Industries N.V.:
| Grading Company | Action | New Grade | Date |
|---|---|---|---|
| RBC Capital | Maintain | Sector Perform | 2026-01-16 |
| Citigroup | Maintain | Neutral | 2026-01-15 |
| UBS | Maintain | Sell | 2025-12-23 |
| Wells Fargo | Downgrade | Equal Weight | 2025-12-19 |
| Citigroup | Maintain | Neutral | 2025-12-18 |
| BMO Capital | Downgrade | Underperform | 2025-12-15 |
| Mizuho | Maintain | Neutral | 2025-12-11 |
| Citigroup | Maintain | Neutral | 2025-11-19 |
| Evercore ISI Group | Maintain | In Line | 2025-11-11 |
| Wells Fargo | Maintain | Overweight | 2025-11-03 |
Which company has the best grades?
Air Products and Chemicals, Inc. generally holds stronger ratings, including multiple Outperform and Buy grades. LyondellBasell Industries N.V. shows more Neutral and Sell ratings. This suggests a more positive institutional sentiment toward Air Products, which could influence investor confidence and market positioning.
Risks specific to each company
The following categories identify critical pressure points and systemic threats facing both firms in the 2026 market environment:
1. Market & Competition
Air Products and Chemicals, Inc.
- Faces stiff competition in specialty gases with slow asset turnover and negative margins.
LyondellBasell Industries N.V.
- Operates in diverse chemical segments with better asset turnover but margin pressure persists.
2. Capital Structure & Debt
Air Products and Chemicals, Inc.
- High debt-to-equity (1.23) and negative interest coverage signal financial strain.
LyondellBasell Industries N.V.
- Slightly better debt metrics but interest coverage remains modest at 4.33.
3. Stock Volatility
Air Products and Chemicals, Inc.
- Beta of 0.88 suggests moderate volatility below market average.
LyondellBasell Industries N.V.
- Lower beta of 0.74 indicates less sensitivity to market swings.
4. Regulatory & Legal
Air Products and Chemicals, Inc.
- Exposure to environmental regulations due to gas production and hydrogen tech partnerships.
LyondellBasell Industries N.V.
- Faces complex multinational regulations across several regions and refining operations.
5. Supply Chain & Operations
Air Products and Chemicals, Inc.
- Operations depend on advanced equipment manufacturing and global industrial customers.
LyondellBasell Industries N.V.
- Supply chain complexity heightened by refining and polymer segments across multiple continents.
6. ESG & Climate Transition
Air Products and Chemicals, Inc.
- Strategic focus on hydrogen and clean energy aligns with transition risks and opportunities.
LyondellBasell Industries N.V.
- ESG risks elevated by refining segment; transition requires significant capital investment.
7. Geopolitical Exposure
Air Products and Chemicals, Inc.
- Primarily US-based with some international exposure, limiting geopolitical risk.
LyondellBasell Industries N.V.
- Wide global footprint including Europe and Asia increases exposure to geopolitical uncertainties.
Which company shows a better risk-adjusted profile?
LyondellBasell’s main risk is its exposure to volatile refining markets and global regulatory complexity. Air Products struggles with financial health, marked by negative profitability and weak interest coverage. Despite geopolitical risks, LyondellBasell shows a slightly better risk-adjusted profile supported by stronger operational efficiency and liquidity. Notably, Air Products’ negative ROIC and interest coverage highlight acute financial stress, justifying caution.
Final Verdict: Which stock to choose?
Air Products and Chemicals, Inc. (APD) exhibits a superpower in its strong market positioning and gross margin resilience. However, its declining profitability and value destruction pose a point of vigilance. APD might suit investors seeking aggressive growth with tolerance for volatility and turnaround risk.
LyondellBasell Industries N.V. (LYB) commands a strategic moat through efficient asset utilization and robust free cash flow generation. Its financial stability and better liquidity profile offer a safer investment relative to APD. LYB could fit well in a GARP (Growth at a Reasonable Price) portfolio focused on steady cash flows.
If you prioritize high-growth potential and can stomach near-term earnings pressure, APD is a compelling choice due to its market strength despite profitability headwinds. However, if you seek better stability and cash flow reliability, LYB offers superior financial resilience and operational efficiency. Each stock appeals to distinct investor profiles with different risk appetites.
Disclaimer: Investment carries a risk of loss of initial capital. The past performance is not a reliable indicator of future results. Be sure to understand risks before making an investment decision.
Go Further
I encourage you to read the complete analyses of Air Products and Chemicals, Inc. and LyondellBasell Industries N.V. to enhance your investment decisions: