Home > Comparison > Basic Materials > LIN vs APD
The strategic rivalry between Linde plc and Air Products and Chemicals, Inc. defines the current trajectory of the specialty chemicals sector. Linde operates as a capital-intensive industrial gas and engineering powerhouse with global reach. In contrast, Air Products focuses on specialty gases and equipment, emphasizing innovative collaborations. This analysis pits Linde’s scale against Air Products’ technological integration to identify which offers superior risk-adjusted returns for a diversified portfolio.
Table of contents
Companies Overview
Linde plc and Air Products and Chemicals, Inc. both dominate the specialty chemicals sector with global industrial gas leadership.
Linde plc: Global Industrial Gas Powerhouse
Linde plc excels as a global industrial gas and engineering leader, generating revenue from atmospheric and process gases. Its strategic focus in 2026 remains on expanding turnkey process plant construction and deepening industry penetration across healthcare, energy, aerospace, and manufacturing sectors. Linde leverages its extensive geographic footprint and engineering prowess to sustain competitive advantage.
Air Products and Chemicals, Inc.: Industrial Gases Innovator
Air Products stands out as a top specialty gases and equipment provider, selling atmospheric and process gases alongside sophisticated air separation and purification systems. Its 2026 strategy emphasizes innovation through collaborations, notably with Baker Hughes on hydrogen compression, reinforcing its position in energy transition markets and industrial applications. The firm’s technology edge drives steady growth in refining and manufacturing industries.
Strategic Collision: Similarities & Divergences
Both companies compete fiercely in specialty gases but diverge in business models—Linde focuses on integrated plant engineering while Air Products champions equipment innovation and strategic partnerships. Their main battleground lies in hydrogen and energy transition technologies. Linde’s vast scale contrasts with Air Products’ nimble technological investment, creating distinct risk-return profiles for investors.
Income Statement Comparison
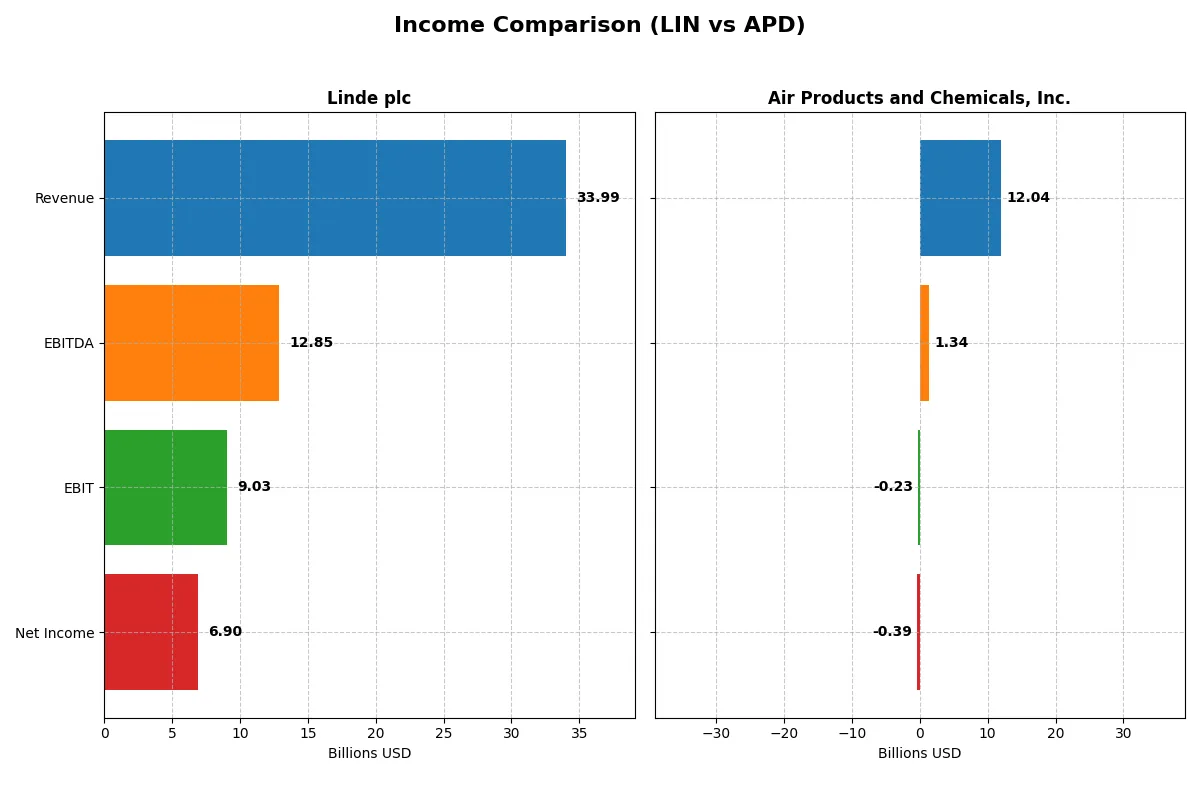
The following data dissects the core profitability and scalability of both corporate engines to reveal who dominates the bottom line:
| Metric | Linde plc (LIN) | Air Products and Chemicals, Inc. (APD) |
|---|---|---|
| Revenue | 34B | 12B |
| Cost of Revenue | 19.3B | 8.3B |
| Operating Expenses | 5.8B | 4.7B |
| Gross Profit | 14.7B | 3.8B |
| EBITDA | 12.9B | 1.3B |
| EBIT | 9.0B | -227M |
| Interest Expense | 212M | 214M |
| Net Income | 6.9B | -395M |
| EPS | 14.67 | -1.77 |
| Fiscal Year | 2025 | 2025 |
Income Statement Analysis: The Bottom-Line Duel
This income statement comparison reveals the true efficiency and profitability of each company’s operational engine over recent years.
Linde plc Analysis
Linde’s revenue grew steadily from $30.8B in 2021 to $34B in 2025, while net income surged 80% to $6.9B. Gross margin expanded favorably to 43.3%, supporting a strong net margin of 20.3%. Despite a slight EBIT dip in 2025, Linde maintains robust profitability and margin momentum, reflecting operational efficiency.
Air Products and Chemicals, Inc. Analysis
APD’s revenue showed modest growth from $10.3B in 2021 to $12B in 2025 but slipped slightly in the last year. It recorded a sharp net income decline, swinging to a $395M loss in 2025. While gross margin held at a favorable 31.4%, negative EBIT and net margins highlight efficiency challenges and deteriorating profitability in the latest fiscal year.
Margin Strength vs. Profitability Stress
Linde dominates with consistent revenue growth and expanding margins, translating into strong net income gains. In contrast, Air Products struggles with profitability, showing losses and compressed margins despite steady revenue. For investors prioritizing reliable profit growth and margin resilience, Linde’s profile offers superior fundamental stability.
Financial Ratios Comparison
These vital ratios act as a diagnostic tool to expose the underlying fiscal health, valuation premiums, and capital efficiency of the companies compared below:
| Ratios | Linde plc (LIN) | Air Products and Chemicals, Inc. (APD) |
|---|---|---|
| ROE | 17.23% | -2.63% |
| ROIC | 9.19% | -1.82% |
| P/E | 30.53 | -154.02 |
| P/B | 5.26 | 4.04 |
| Current Ratio | 0.89 | 1.38 |
| Quick Ratio | 0.76 | 1.20 |
| D/E (Debt-to-Equity) | 0.59 | 1.23 |
| Debt-to-Assets | 28.21% | 44.83% |
| Interest Coverage | 15.03 | -4.10 |
| Asset Turnover | 0.41 | 0.29 |
| Fixed Asset Turnover | 1.28 | 0.46 |
| Payout Ratio | 40.44% | -401.55% |
| Dividend Yield | 1.32% | 2.61% |
| Fiscal Year | 2024 | 2025 |
Efficiency & Valuation Duel: The Vital Signs
Financial ratios act as the company’s DNA, revealing hidden risks and operational excellence essential for assessing investment quality.
Linde plc
Linde delivers strong profitability with a 17.23% ROE and a robust 19.89% net margin, signaling operational efficiency. However, its P/E of 30.53 and P/B of 5.26 suggest the stock trades at a premium. Linde supports shareholders with a 1.32% dividend yield, balancing payout with reinvestment in growth.
Air Products and Chemicals, Inc.
Air Products shows negative returns with a -2.63% ROE and -3.28% net margin, reflecting operational challenges. Despite a favorable negative P/E due to losses, its P/B at 4.04 and weak asset turnover indicate inefficiency. The company offers a 2.61% dividend yield, emphasizing shareholder returns amid adverse profitability.
Premium Valuation vs. Operational Safety
Linde offers a healthier mix of profitability and valuation discipline, despite a stretched price multiple. Air Products struggles with negative returns and high leverage, though it maintains dividends. Risk-averse investors may prefer Linde’s stable profile, while income-focused ones might consider Air Products’ dividend despite operational risks.
Which one offers the Superior Shareholder Reward?
I find Linde plc (LIN) offers a more balanced and sustainable shareholder reward in 2026. LIN yields around 1.3% with a payout ratio near 40%, supported by strong free cash flow coverage (~52%). Its buyback program is steady, enhancing total returns. Air Products (APD) pays a higher yield near 2.6%, but its free cash flow is negative due to heavy capex, raising sustainability concerns. APD’s buybacks are limited by cash constraints. Historically, LIN’s disciplined capital allocation and consistent returns outweigh APD’s riskier distribution model, making LIN the superior total return choice this year.
Comparative Score Analysis: The Strategic Profile
The radar chart reveals the fundamental DNA and trade-offs of Linde plc and Air Products and Chemicals, Inc., highlighting each firm’s core financial strengths and vulnerabilities:
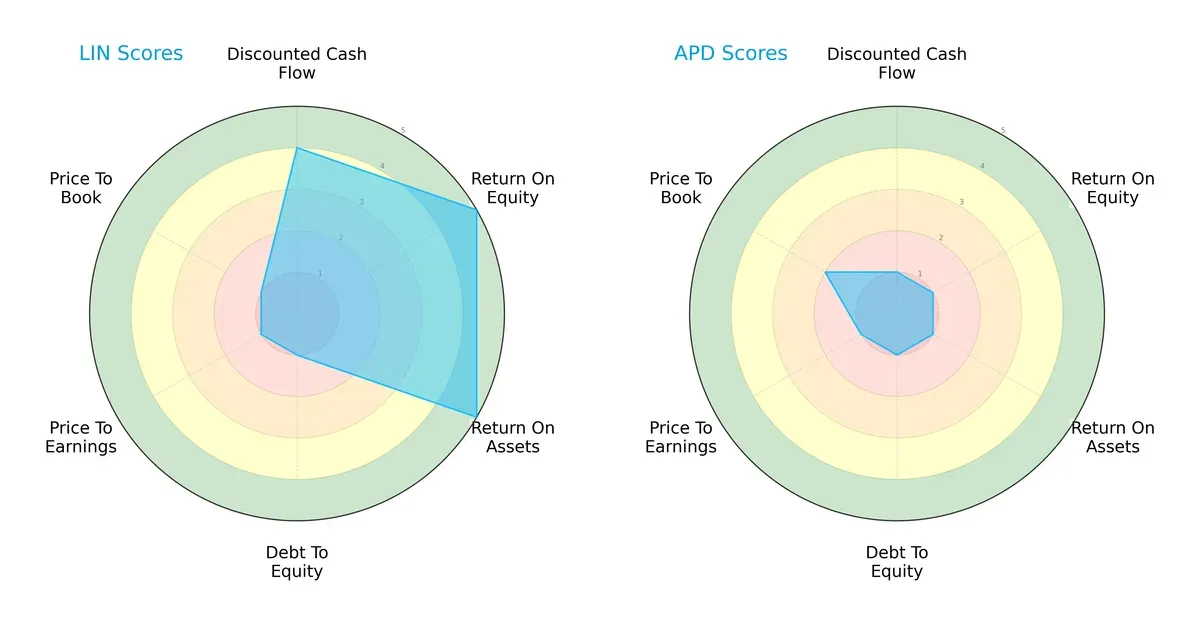
Linde shows superior profitability metrics with strong ROE and ROA scores at 5 each, reflecting efficient capital and asset use. However, its financial leverage is a red flag, scoring just 1 on debt-to-equity, indicating significant reliance on debt. Air Products scores uniformly low across DCF, ROE, and ROA, showing limited operational efficiency and valuation appeal. Linde’s profile is more balanced but risky due to leverage, while Air Products depends on a consistently weak foundation without a clear competitive edge.
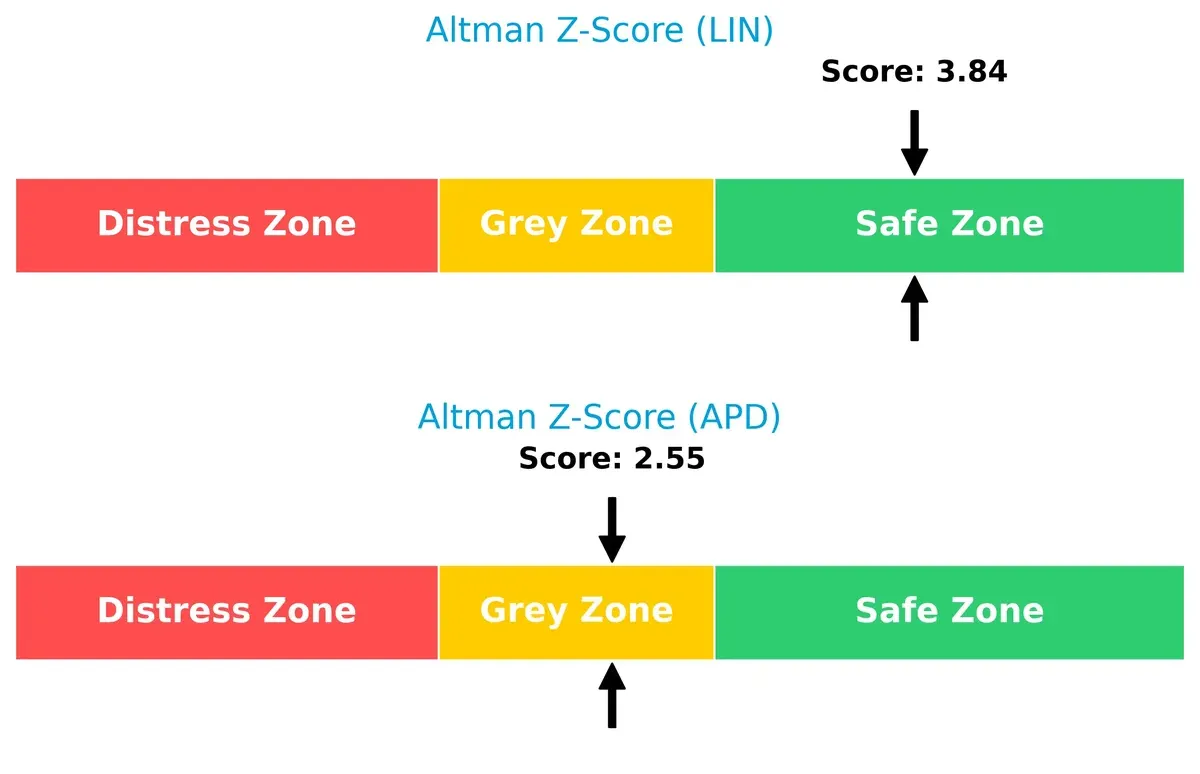
Bankruptcy Risk: Solvency Showdown
Linde’s Altman Z-Score of 3.84 places it firmly in the safe zone, signaling strong financial stability. Air Products’ 2.55 score in the grey zone indicates moderate bankruptcy risk in this economic cycle:
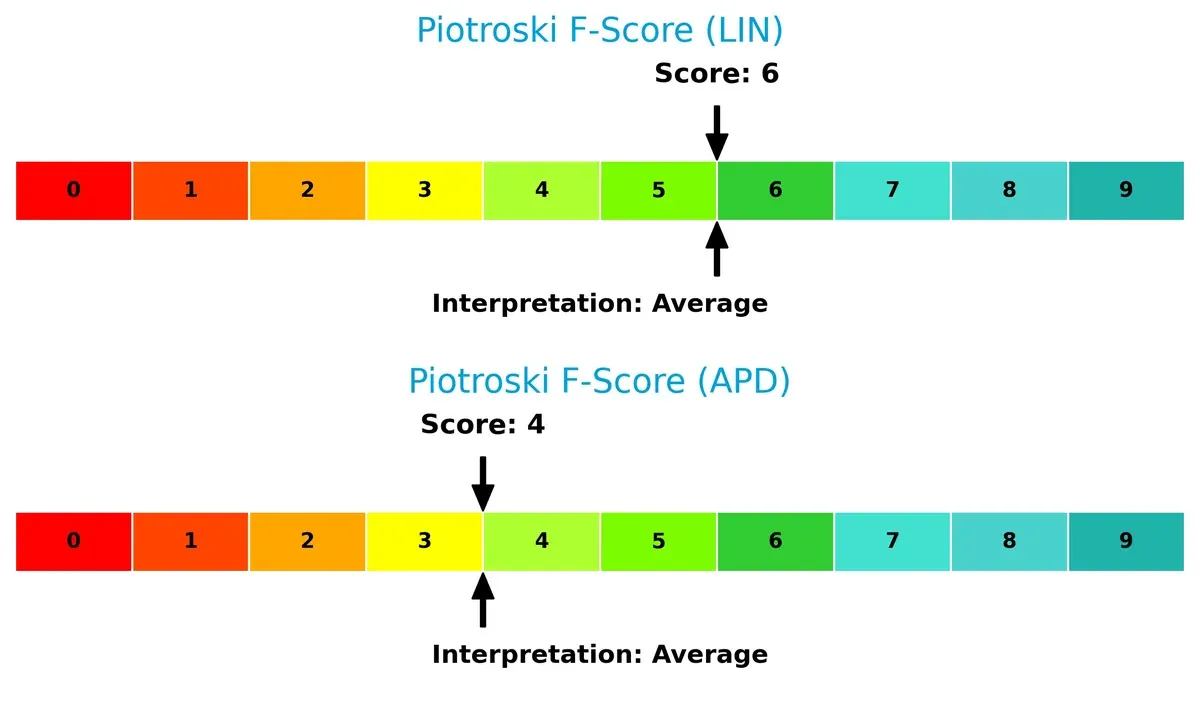
Financial Health: Quality of Operations
Both firms exhibit average Piotroski F-Scores, with Linde at 6 and Air Products at 4, suggesting moderate operational health. Neither shows critical red flags, but Linde’s higher score points to stronger internal metrics and better financial resilience:
How are the two companies positioned?
This section dissects the operational DNA of Linde and Air Products by comparing their revenue distribution and internal dynamics. The goal is to confront their economic moats and identify which model offers the most resilient competitive advantage today.
Revenue Segmentation: The Strategic Mix
This comparison dissects how Linde plc and Air Products and Chemicals, Inc. diversify their income streams and reveals their primary sector bets:
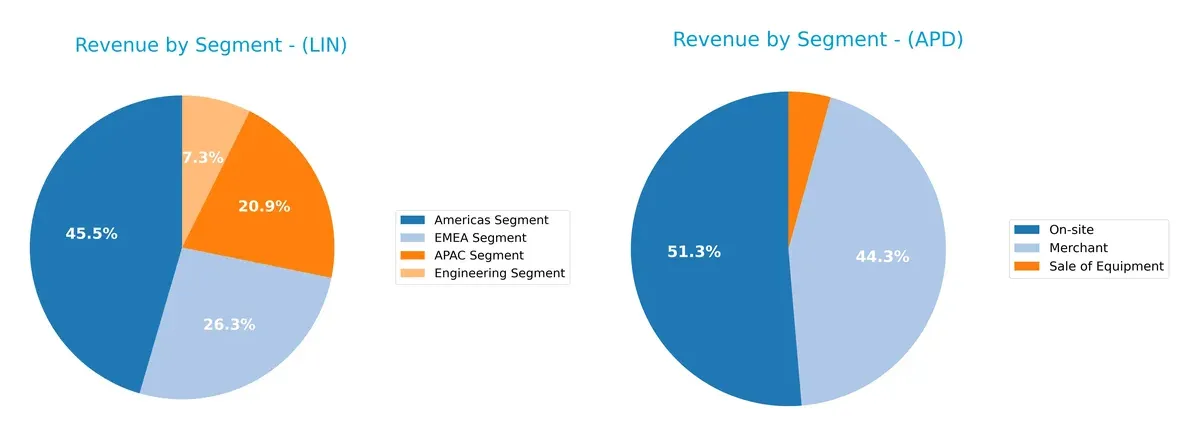
Linde’s 2024 revenue heavily anchors in the Americas Segment at $14.4B, followed by EMEA at $8.4B, APAC $6.6B, and Engineering $2.3B, showing a geographically diversified footprint. Air Products pivots more on industrial gas delivery modes, with $6.2B On-site and $5.3B Merchant revenues, plus a smaller $878M Equipment sales slice. Linde’s broad regional spread reduces concentration risk, while Air Products’ focus on service types underscores infrastructure dominance but heightens dependency on industrial gas demand.
Strengths and Weaknesses Comparison
This table compares the Strengths and Weaknesses of Linde plc and Air Products and Chemicals, Inc.:
Linde plc Strengths
- Favorable net margin of 19.89%
- Strong ROE at 17.23%
- Favorable interest coverage at 42.6
- Diverse revenue streams across Americas, EMEA, APAC, and Engineering segments
- Significant global presence including US, Germany, China, UK, Brazil
Air Products Strengths
- Favorable WACC at 6.86%
- Favorable P/E ratio due to negative earnings
- Favorable quick ratio at 1.2
- Dividend yield at 2.61%
- Diversified product segments including Merchant, On-site, and Equipment sales
- Broad geographic reach with strong Americas and Asia presence
Linde plc Weaknesses
- Unfavorable P/E of 30.53 and P/B of 5.26
- Low current ratio at 0.89 and quick ratio at 0.76
- Neutral ROIC at 9.19% vs. WACC 7.19%
- Unfavorable asset turnover of 0.41
- High valuation multiples may pressure future returns
Air Products Weaknesses
- Negative net margin, ROE, and ROIC indicate profitability issues
- Unfavorable debt to equity at 1.23 and negative interest coverage
- Unfavorable fixed asset turnover at 0.46
- Higher debt to assets at 44.83%
- Unfavorable PB at 4.04 reflecting valuation concerns
Linde demonstrates solid profitability and global diversification but faces liquidity and valuation challenges. Air Products struggles with profitability and leverage despite strengths in liquidity and dividend yield. These contrasts suggest differing strategic priorities and risk exposures.
The Moat Duel: Analyzing Competitive Defensibility
A structural moat is the only protection long-term profits have against relentless competitive pressure and market erosion:
Linde plc: Engineering Scale and Intangible Asset Moat
Linde’s competitive edge lies in its engineering expertise and global scale. This moat delivers strong margin stability and a favorable ROIC trend. Its expansion into hydrogen and advanced gas technologies in 2026 could deepen this advantage.
Air Products and Chemicals, Inc.: Niche Equipment and Service Moat
Air Products relies on specialized equipment and service solutions, contrasting Linde’s scale. However, profitability erosion and declining ROIC highlight a weakening moat. Its strategic hydrogen collaborations may offer a turnaround opportunity but face execution risk.
Verdict: Scale and Engineering Depth vs. Specialized Services Fragility
Linde holds the deeper moat with rising ROIC and robust margin control. Air Products’ shrinking profitability signals a fragile defense. I see Linde as better positioned to sustain and grow its market share in 2026 and beyond.
Which stock offers better returns?
The past year shows contrasting dynamics: Linde plc’s stock declined overall with recent acceleration, while Air Products and Chemicals, Inc. posted a strong upward trajectory with sustained gains.
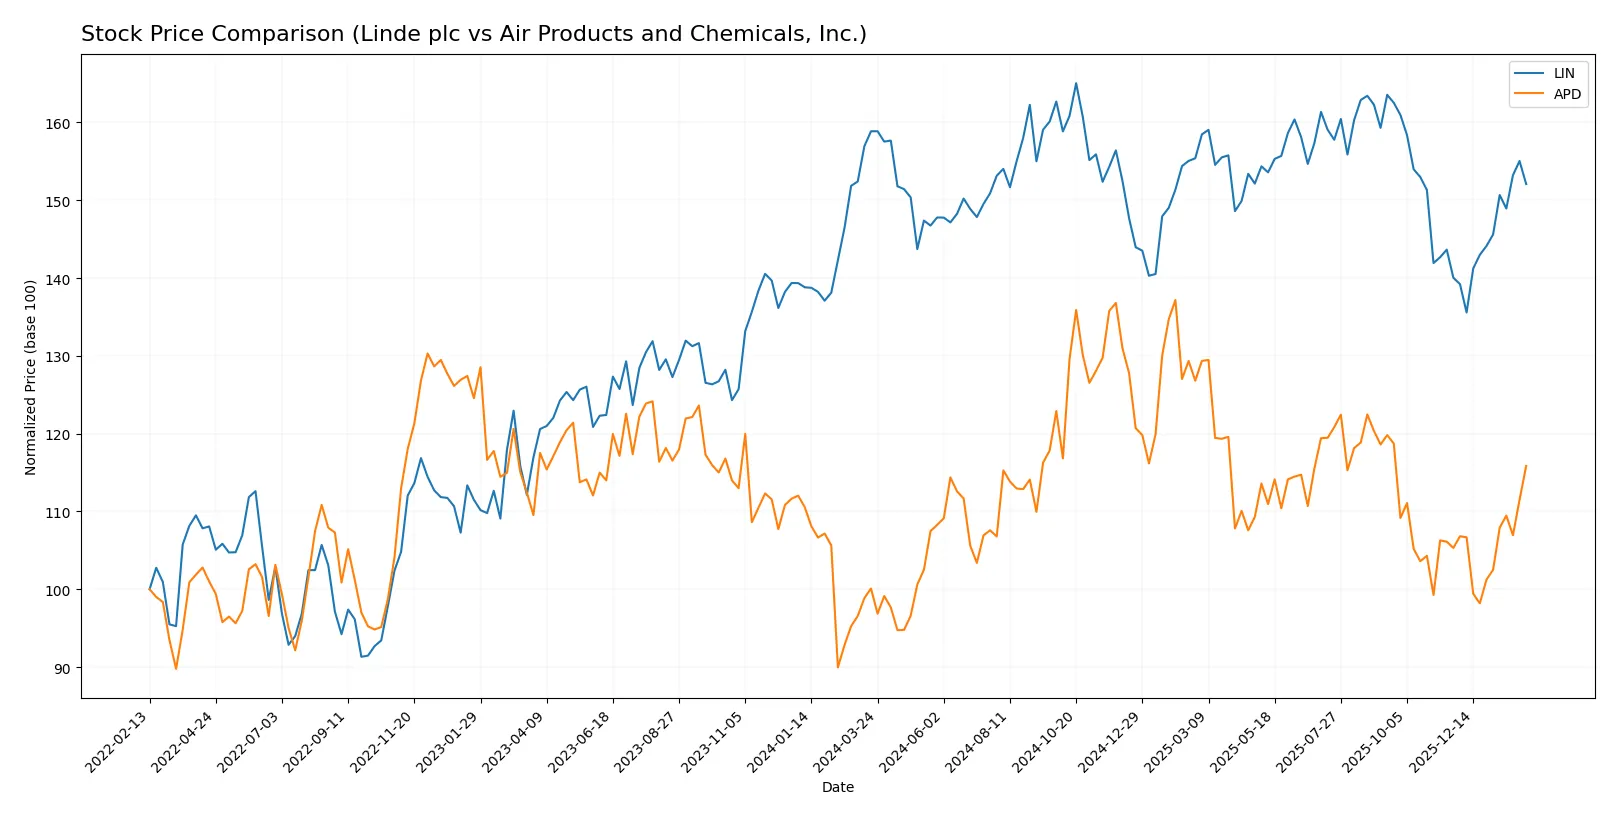
Trend Comparison
Linde plc’s share price fell 4.27% over the past 12 months, signaling a bearish trend with accelerating decline. It hit a high of 486.45 and a low of 399.57, reflecting notable volatility.
Air Products and Chemicals, Inc. gained 15.73% in the same period, confirming a bullish trend with accelerating momentum. Its price ranged between 231.53 and 335.26, showing higher volatility than Linde.
Comparing both, Air Products outperformed Linde significantly, delivering the highest market returns and a clear positive trend over the last year.
Target Prices
Analysts present a bullish consensus for Linde plc and Air Products and Chemicals, Inc., suggesting notable upside potential.
| Company | Target Low | Target High | Consensus |
|---|---|---|---|
| Linde plc | 490 | 550 | 516 |
| Air Products and Chemicals, Inc. | 255 | 335 | 290.22 |
Linde’s target consensus of 516 exceeds its current 448 price by 15%. Air Products’ consensus of 290.22 slightly surpasses its 283 stock price, indicating moderate upside.

Don’t Let Luck Decide Your Entry Point
Optimize your entry points with our advanced ProRealTime indicators. You’ll get efficient buy signals with precise price targets for maximum performance. Start outperforming now!
How do institutions grade them?
This section compares the most recent institutional grades for Linde plc and Air Products and Chemicals, Inc.:
Linde plc Grades
Below is a summary of recent grades assigned to Linde plc by major financial institutions.
| Grading Company | Action | New Grade | Date |
|---|---|---|---|
| JP Morgan | Downgrade | Neutral | 2026-02-06 |
| UBS | Maintain | Buy | 2026-02-06 |
| Citigroup | Maintain | Buy | 2026-02-06 |
| RBC Capital | Maintain | Outperform | 2025-12-12 |
| B of A Securities | Maintain | Buy | 2025-11-03 |
| Seaport Global | Upgrade | Buy | 2025-11-03 |
Air Products and Chemicals, Inc. Grades
Below is a summary of recent grades assigned to Air Products and Chemicals, Inc. by major financial institutions.
| Grading Company | Action | New Grade | Date |
|---|---|---|---|
| Citigroup | Maintain | Neutral | 2026-02-02 |
| UBS | Maintain | Neutral | 2026-02-02 |
| JP Morgan | Maintain | Neutral | 2026-02-02 |
| Jefferies | Maintain | Buy | 2026-02-02 |
| Wells Fargo | Maintain | Equal Weight | 2026-02-02 |
| B of A Securities | Upgrade | Neutral | 2026-01-08 |
| Mizuho | Maintain | Outperform | 2025-12-18 |
Which company has the best grades?
Linde consistently earns Buy and Outperform ratings, with some recent downgrades to Neutral. Air Products mostly receives Neutral or Equal Weight grades, with fewer Buy ratings. Investors may see Linde as having stronger institutional support.
Risks specific to each company
The following categories identify the critical pressure points and systemic threats facing both firms in the 2026 market environment:
1. Market & Competition
Linde plc
- Dominates with a 209B market cap, benefiting from global industrial gas demand and broad geographic reach.
Air Products and Chemicals, Inc.
- Smaller at 63B market cap, facing intense competition and slower growth prospects in specialty gases.
2. Capital Structure & Debt
Linde plc
- Maintains moderate leverage (D/E 0.59) with strong interest coverage (42.6), indicating solid debt management.
Air Products and Chemicals, Inc.
- High leverage (D/E 1.23) and negative interest coverage signal financial strain and elevated default risk.
3. Stock Volatility
Linde plc
- Beta at 0.85 shows below-market volatility, supporting stable investor confidence.
Air Products and Chemicals, Inc.
- Slightly higher beta of 0.89 indicates somewhat elevated stock price swings and investor uncertainty.
4. Regulatory & Legal
Linde plc
- Exposed to stringent environmental and safety regulations globally but with established compliance frameworks.
Air Products and Chemicals, Inc.
- Faces similar regulatory pressures, compounded by recent litigation risks in hydrogen compression technology.
5. Supply Chain & Operations
Linde plc
- Extensive global operations may face disruptions but benefits from robust engineering capabilities and supply diversification.
Air Products and Chemicals, Inc.
- Smaller scale and recent operational setbacks expose APD to higher supply chain risks.
6. ESG & Climate Transition
Linde plc
- Leading investments in green hydrogen and sustainability offer competitive advantages in climate transition.
Air Products and Chemicals, Inc.
- Strategic partnerships on hydrogen tech show promise but financial weakness limits ESG capital allocation.
7. Geopolitical Exposure
Linde plc
- Broad global footprint includes exposure to emerging market volatility but diversified risk profile.
Air Products and Chemicals, Inc.
- Concentrated North American operations reduce geopolitical risk but limit growth opportunities overseas.
Which company shows a better risk-adjusted profile?
Linde’s most impactful risk is its high valuation multiples and liquidity concerns, tempered by strong profitability and balance sheet health. Air Products struggles with financial distress risks, driven by negative profitability and heavy debt. Linde’s Altman Z-score (3.84, safe zone) contrasts sharply with Air Products’ (2.55, grey zone). Thus, Linde presents a better risk-adjusted profile supported by superior financial stability and operational scale.
Final Verdict: Which stock to choose?
Linde plc’s superpower lies in its steadily improving profitability and disciplined capital allocation. It demonstrates growing returns on invested capital, signaling emerging competitive strength. A point of vigilance is its below-par liquidity ratios, which could constrain flexibility in turbulent markets. Linde suits investors focused on resilient, long-term growth.
Air Products and Chemicals commands a strategic moat through its entrenched industry position and recurring revenue streams, offering a buffer amid volatility. It presents a safer liquidity profile compared to Linde, but its recent value destruction and declining profitability raise concerns. This stock fits portfolios seeking steady income with moderate growth ambitions.
If you prioritize consistent value creation and improving profitability, Linde outshines with its upward ROIC trend and solid income growth. However, if you seek defensive stability with a reliable dividend, Air Products offers better liquidity and income potential despite profitability challenges. Both demand close monitoring, aligned to distinct investor profiles.
Disclaimer: Investment carries a risk of loss of initial capital. The past performance is not a reliable indicator of future results. Be sure to understand risks before making an investment decision.
Go Further
I encourage you to read the complete analyses of Linde plc and Air Products and Chemicals, Inc. to enhance your investment decisions: