Home > Comparison > Basic Materials > ECL vs APD
The strategic rivalry between Ecolab Inc. and Air Products and Chemicals, Inc. shapes the specialty chemicals landscape. Ecolab operates as a diversified provider of water, hygiene, and infection prevention solutions, serving multiple industrial and institutional sectors. Air Products focuses on atmospheric and process gases, alongside specialized equipment for energy and manufacturing industries. This analysis contrasts their operational models to identify which offers superior risk-adjusted returns for a balanced portfolio.
Table of contents
Companies Overview
Ecolab and Air Products anchor the specialty chemicals sector with distinct market roles and strategic ambitions.
Ecolab Inc.: Leader in Water and Hygiene Solutions
Ecolab dominates the water, hygiene, and infection prevention market worldwide. It generates revenue primarily through tailored cleaning and sanitizing solutions across industrial, institutional, and healthcare segments. In 2026, the company focuses on expanding integrated water management and contamination control services to enhance operational efficiency for clients globally.
Air Products and Chemicals, Inc.: Pioneer in Industrial Gases
Air Products specializes in atmospheric and specialty gases with equipment and services supporting diverse industries like refining, electronics, and energy. Its core revenue stems from producing and delivering gases such as hydrogen and nitrogen. The company’s 2026 strategy centers on advancing hydrogen technologies through partnerships, notably with Baker Hughes, to lead the clean energy transition.
Strategic Collision: Similarities & Divergences
Both firms excel in specialty chemicals but diverge sharply in approach: Ecolab offers service-driven solutions emphasizing hygiene and water management, while Air Products pursues technology and gas production leadership. Their main competitive arena lies in industrial clients seeking sustainable operational improvements. This contrast yields distinct investment profiles—Ecolab as a service innovator and Air Products as a technology-driven gas supplier.
Income Statement Comparison
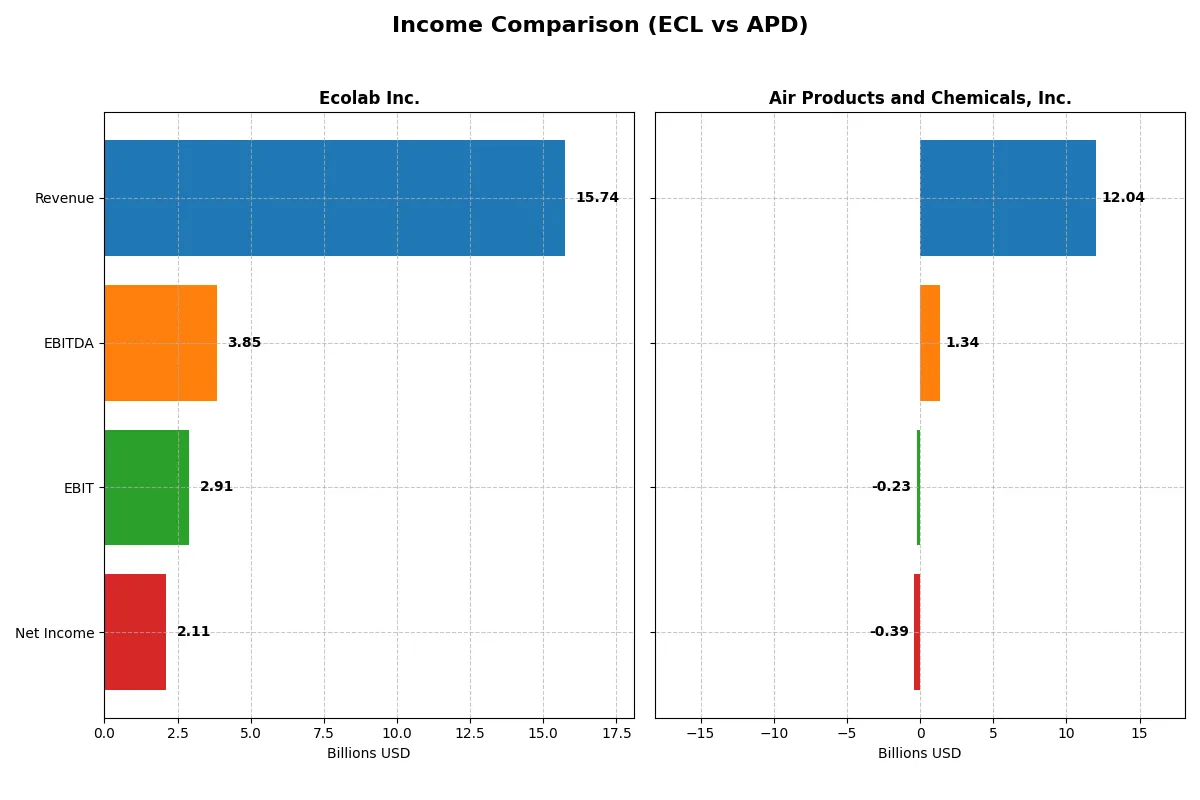
This data dissects the core profitability and scalability of both corporate engines to reveal who dominates the bottom line:
| Metric | Ecolab Inc. (ECL) | Air Products and Chemicals, Inc. (APD) |
|---|---|---|
| Revenue | 15.7B | 12.1B |
| Cost of Revenue | 8.9B | 8.2B |
| Operating Expenses | 4.2B | -0.5B |
| Gross Profit | 6.8B | 3.9B |
| EBITDA | 3.8B | 6.5B |
| EBIT | 2.9B | 5.0B |
| Interest Expense | 338M | 219M |
| Net Income | 2.1B | 3.8B |
| EPS | 7.43 | 17.21 |
| Fiscal Year | 2024 | 2024 |
Income Statement Analysis: The Bottom-Line Duel
This income statement comparison reveals which company operates its business more efficiently and delivers stronger profitability in recent years.
Ecolab Inc. Analysis
Ecolab’s revenue grows steadily, reaching $15.7B in 2024, with net income surging to $2.11B. Its gross margin remains robust at 43.5%, while net margin improves to 13.4%, reflecting efficient cost control and operating leverage. The 2024 results show strong momentum, marked by a 38% EBIT increase and a nearly 54% EPS jump, signaling excellent profitability expansion.
Air Products and Chemicals, Inc. Analysis
Air Products posts $12B revenue in fiscal 2025, slightly down from prior years, with net income falling into a $394M loss. Gross margin holds at 31.4%, but EBIT turns negative at -1.9%, dragging net margin to -3.3%. The latest year reveals deteriorating profitability and operational challenges, reversing gains from previous years when net income peaked above $3.8B.
Margin Strength vs. Earnings Volatility
Ecolab delivers superior margin expansion and consistent net income growth, demonstrating strong earnings quality and operational discipline. In contrast, Air Products struggles with negative EBIT and net losses, undermining its recent revenue scale. For investors prioritizing resilient profitability and margin health, Ecolab presents a more attractive fundamental profile.
Financial Ratios Comparison
These vital ratios act as a diagnostic tool to expose the underlying fiscal health, valuation premiums, and capital efficiency of the companies compared below:
| Ratios | Ecolab Inc. (ECL) | Air Products and Chemicals, Inc. (APD) |
|---|---|---|
| ROE | 24.12% | 22.47% |
| ROIC | 11.80% | 9.92% |
| P/E | 31.54 | 17.31 |
| P/B | 7.61 | 3.89 |
| Current Ratio | 1.26 | 1.52 |
| Quick Ratio | 0.95 | 1.34 |
| D/E | 0.95 | 0.88 |
| Debt-to-Assets | 37.00% | 38.00% |
| Interest Coverage | 7.72 | 20.41 |
| Asset Turnover | 0.70 | 0.31 |
| Fixed Asset Turnover | 3.52 | 0.50 |
| Payout ratio | 31.45% | 40.88% |
| Dividend yield | 1.00% | 2.36% |
| Fiscal Year | 2024 | 2024 |
Efficiency & Valuation Duel: The Vital Signs
Financial ratios act as a company’s DNA, unveiling hidden risks and operational strengths that guide investment decisions with precision.
Ecolab Inc.
Ecolab delivers robust profitability with a 24.12% ROE and a solid 13.42% net margin, signaling operational excellence. The stock trades at a stretched P/E of 31.54 and a high P/B of 7.61, indicating premium valuation. Shareholders see modest returns with a 1.0% dividend yield, reflecting a cautious capital allocation approach.
Air Products and Chemicals, Inc.
Air Products struggles with negative profitability metrics, including a -2.63% ROE and a -3.28% net margin, which mark operational challenges. Despite this, the P/E ratio is unusually favorable at -154.02 due to losses, but the P/B of 4.04 is stretched. It offers a 2.61% dividend yield, suggesting some shareholder return amid reinvestment hurdles.
Premium Valuation vs. Operational Safety
Ecolab balances strong operational efficiency and moderate dividend returns despite a high valuation multiple. Air Products’ metrics reveal financial strain and reliance on dividends amid weak profitability. Investors prioritizing stability may prefer Ecolab, while those seeking yield amid uncertainty might consider Air Products’ profile.
Which one offers the Superior Shareholder Reward?
I observe that Ecolab (ECL) offers a modest 1.0% dividend yield with a sustainable payout ratio near 31%, supported by positive free cash flow of 6.4/share and consistent buybacks. Air Products (APD) pays a higher 2.4% dividend yield but struggles with negative free cash flow (-14/share) and heavy capex, limiting buyback capacity. APD’s payout ratio hovers around 41%, risking sustainability amid volatile profits. ECL’s balanced distribution and strong cash flow suggest superior long-term shareholder reward compared to APD’s aggressive but less sustainable model in 2026.
Comparative Score Analysis: The Strategic Profile
The radar chart reveals the fundamental DNA and trade-offs of both firms, highlighting their core strengths and vulnerabilities across key financial metrics:
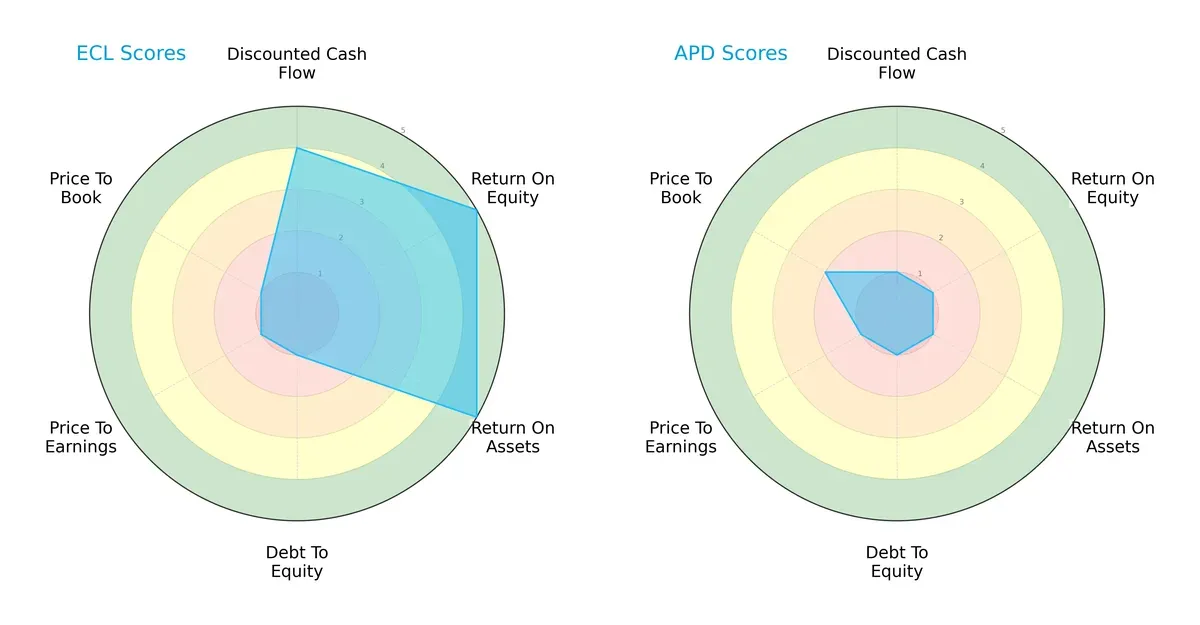
Ecolab Inc. (ECL) shows a strong performance in profitability and asset utilization, scoring very favorably on ROE and ROA. However, it struggles with financial leverage and valuation metrics, both rated very unfavorable. Air Products and Chemicals, Inc. (APD) presents a uniformly weak profile with very unfavorable scores in return measures and valuation, only slightly better in price-to-book. ECL offers a more balanced strategic profile, leveraging operational efficiency despite leverage risks, while APD relies on no specific edge.
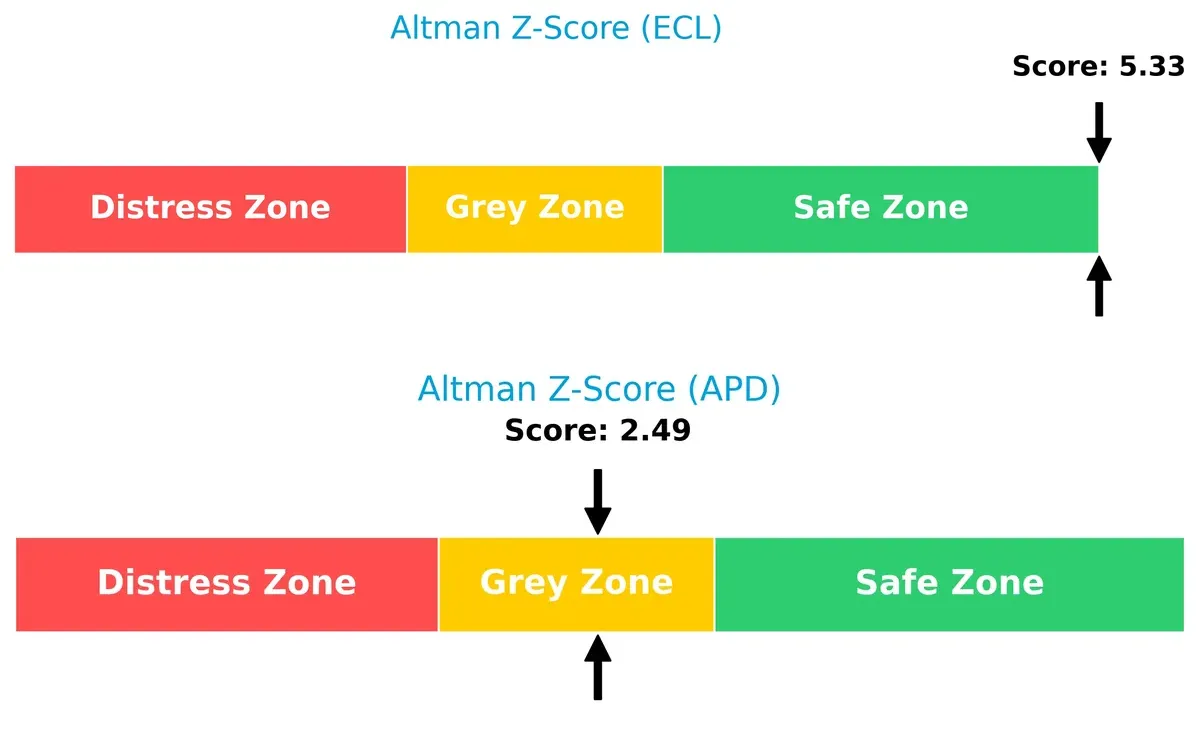
Bankruptcy Risk: Solvency Showdown
ECL’s Altman Z-Score of 5.33 firmly places it in the safe zone, signaling strong long-term solvency versus APD’s 2.49 in the grey zone, indicating moderate bankruptcy risk under current market stress:
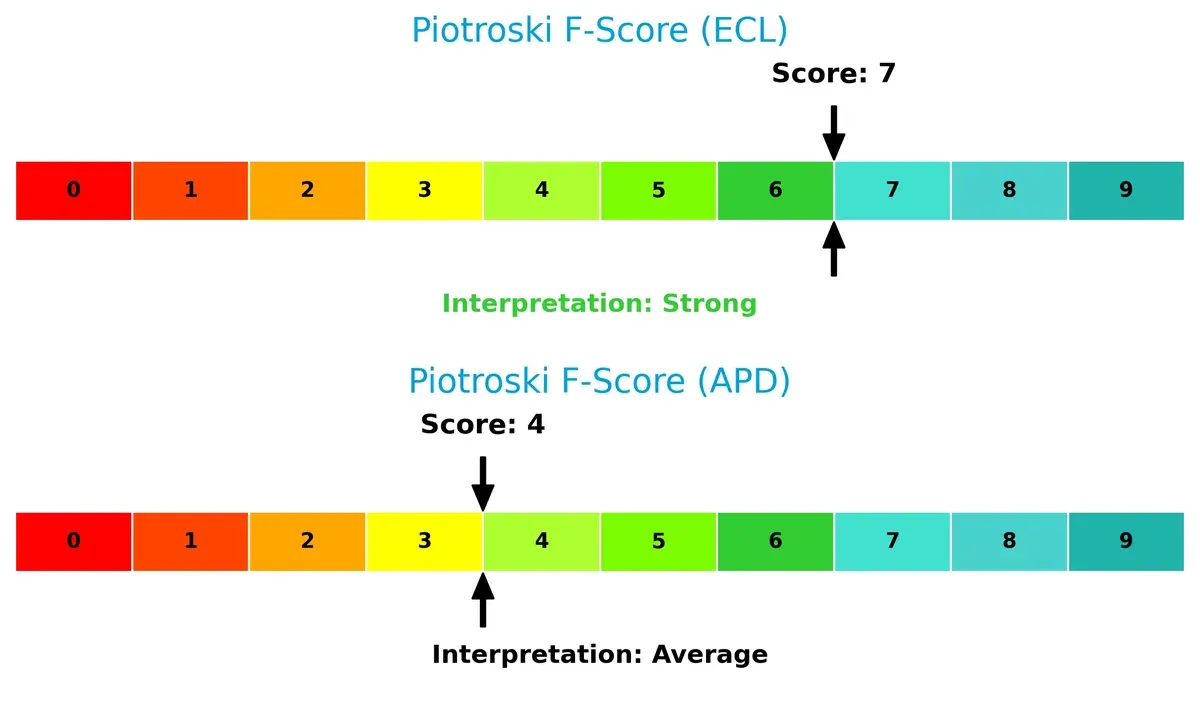
Financial Health: Quality of Operations
ECL’s Piotroski F-Score of 7 indicates strong financial health and robust internal metrics. APD’s score of 4 flags average health, highlighting potential red flags in operational quality and financial stability:
How are the two companies positioned?
This section dissects Ecolab and Air Products’ operational DNA by comparing revenue distribution and internal strengths and weaknesses. The goal is to confront their economic moats to identify which model offers the most resilient competitive advantage today.
Revenue Segmentation: The Strategic Mix
This visual comparison dissects how Ecolab Inc. and Air Products and Chemicals diversify their income streams and where their primary sector bets lie:
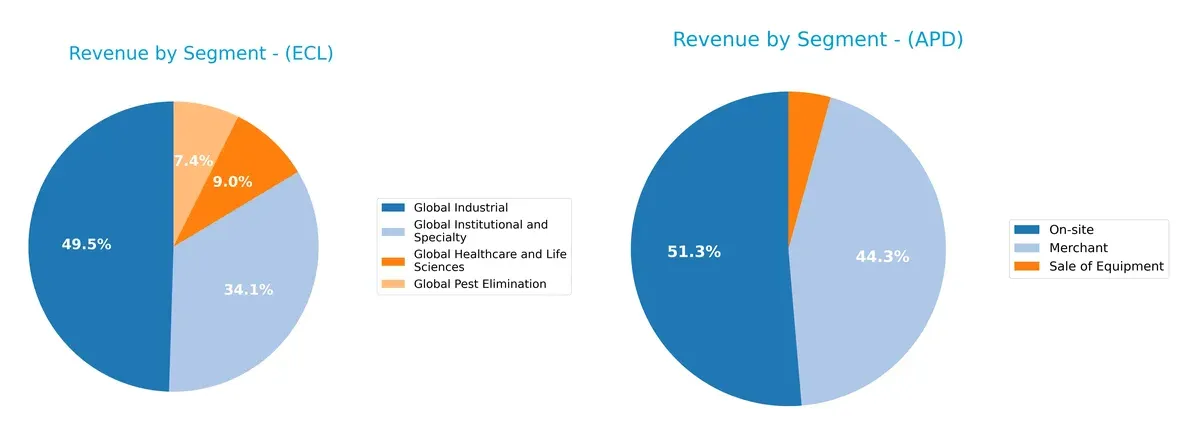
Ecolab anchors its revenue in Global Industrial at $7.9B, supplemented by Global Institutional and Specialty at $5.4B, showing a balanced portfolio across sectors. Air Products relies heavily on On-site revenue, $6.2B, and Merchant sales, $5.3B, reflecting concentration in industrial gas infrastructure. Ecolab’s diversification reduces concentration risk, while Air Products’ focused segments drive ecosystem lock-in but expose it to sector cyclicality.
Strengths and Weaknesses Comparison
This table compares the strengths and weaknesses of Ecolab Inc. and Air Products and Chemicals, Inc.:
Ecolab Inc. Strengths
- Diverse revenue across industrial, institutional, healthcare, and pest elimination segments
- Favorable profitability metrics: net margin 13.42%, ROE 24.12%, ROIC 11.8%
- Solid interest coverage ratio at 8.6
- Strong fixed asset turnover at 3.52
- Global presence with significant revenue from the US, Europe, and Asia Pacific
Air Products and Chemicals, Inc. Strengths
- Diverse revenue streams including merchant, on-site, and equipment sales
- Favorable WACC at 6.82% and positive PE despite losses
- Quick ratio of 1.2 indicates decent liquidity
- Dividend yield at 2.61% supports shareholder returns
- Broad geographic reach across Americas, Asia, and Europe
Ecolab Inc. Weaknesses
- Elevated valuation multiples: PE 31.54 and PB 7.61 suggest high market expectations
- Dividend yield low at 1.0%
- Neutral liquidity and leverage ratios, current ratio 1.26, DE 0.95
Air Products and Chemicals, Inc. Weaknesses
- Negative profitability with net margin -3.28%, ROE -2.63%, ROIC -1.82%
- High debt to equity of 1.23 and negative interest coverage (-1.06)
- Low asset turnover at 0.29 and fixed asset turnover at 0.46
- PB ratio at 4.04 reflects valuation concerns
Ecolab’s strengths lie in consistent profitability and operational efficiency, supporting a resilient business model. Air Products faces profitability and leverage challenges despite diverse operations and decent liquidity, indicating potential financial stress. Both companies maintain broad geographic and product diversification, critical for long-term strategy.
The Moat Duel: Analyzing Competitive Defensibility
A structural moat remains the only reliable barrier protecting long-term profits from relentless competition erosion. Let’s dissect the moats of two specialty chemical giants:
Ecolab Inc.: Durable Intangible Assets and Operational Excellence
Ecolab’s moat stems from strong intangible assets and switching costs, reflected in a robust 3.8% ROIC premium over WACC. Its margin stability and 25% ROIC growth signal durable value creation. Expansion in healthcare and water treatment deepens this moat into 2026.
Air Products and Chemicals, Inc.: Capital-Intensive Scale with Weakening Returns
Air Products relies on scale and specialized gas infrastructure, yet its moat weakens as ROIC plunged 124%, now well below WACC. Unlike Ecolab, it struggles with margin erosion and negative net income growth. Strategic hydrogen ventures could disrupt but risk remains high.
Moat Strength: Intangible Assets vs. Scale Efficiency
Ecolab’s intangible-driven moat outpaces Air Products’ capital-heavy scale, delivering wider and more durable competitive advantages. I see Ecolab as better positioned to defend and grow its market share through innovation and operational leverage.
Which stock offers better returns?
Over the past 12 months, both Ecolab Inc. and Air Products and Chemicals, Inc. showed strong price gains with accelerating trends, reflecting robust bullish momentum and significant trading activity shifts.
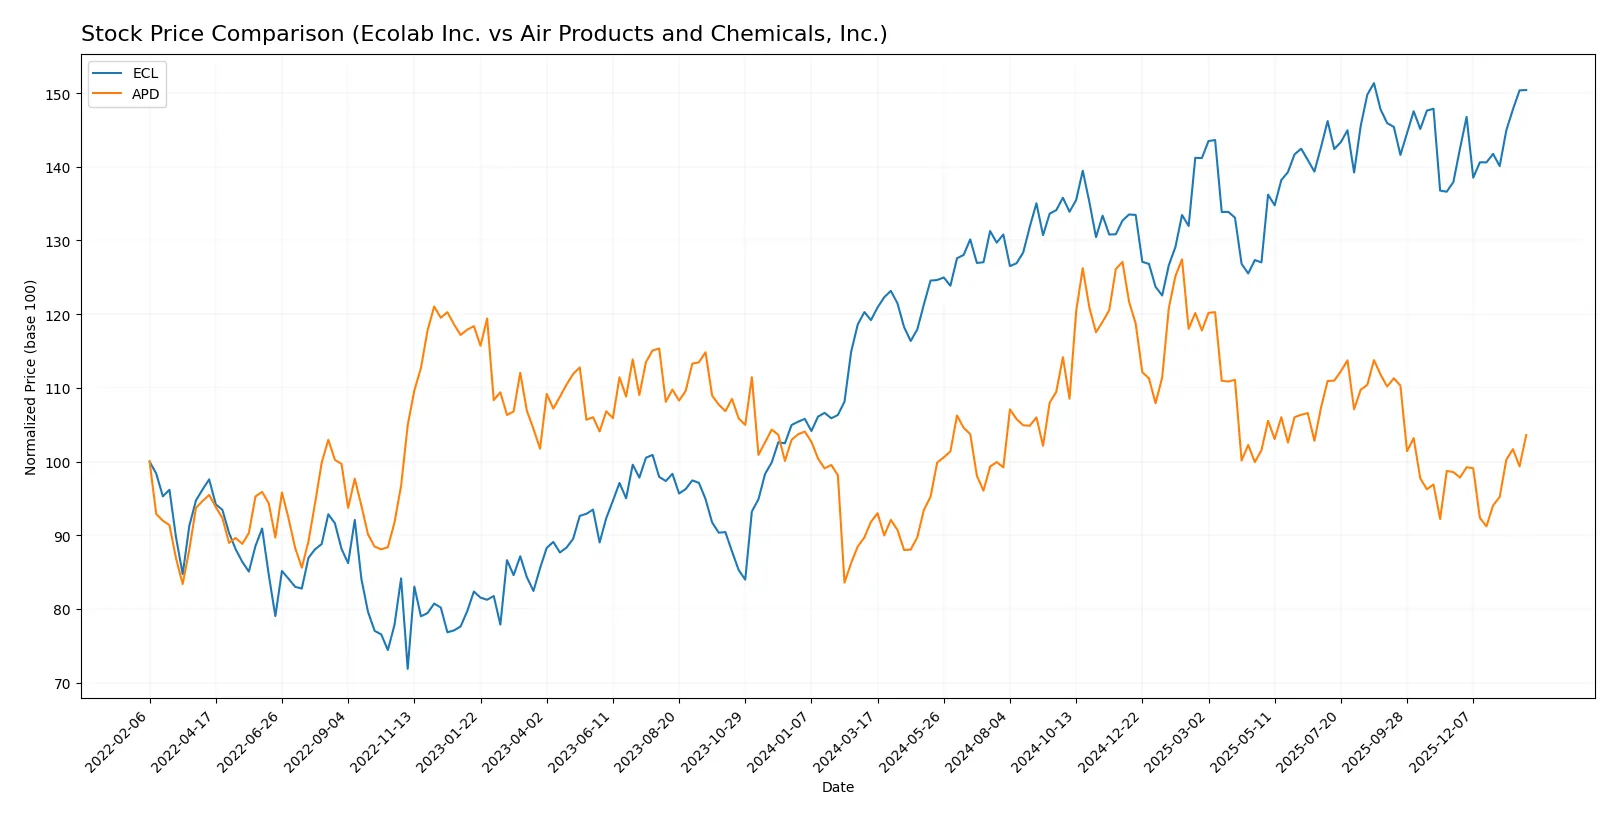
Trend Comparison
Ecolab Inc. recorded a 26.19% price increase over the past year with accelerating bullish momentum and a high of 283.73, supported by strong buyer dominance and rising volume.
Air Products and Chemicals, Inc. gained 12.79% over the same period, also accelerating but with higher volatility and a peak price of 335.26; recent trends show a slight deceleration and seller dominance.
Ecolab’s stronger price appreciation and increasing buyer activity indicate it delivered higher market performance relative to Air Products over the past year.
Target Prices
Analysts show a confident target price range for these specialty chemical leaders.
| Company | Target Low | Target High | Consensus |
|---|---|---|---|
| Ecolab Inc. | 295 | 315 | 303.43 |
| Air Products and Chemicals, Inc. | 250 | 335 | 280 |
Ecolab’s consensus target exceeds its current price by about 7.5%, signaling moderate upside. Air Products shows a wider range, with targets suggesting potential gains near 3%.

Don’t Let Luck Decide Your Entry Point
Optimize your entry points with our advanced ProRealTime indicators. You’ll get efficient buy signals with precise price targets for maximum performance. Start outperforming now!
How do institutions grade them?
The following tables summarize recent institutional grades for Ecolab Inc. and Air Products and Chemicals, Inc.:
Ecolab Inc. Grades
This table shows recent grades and rating actions from major financial institutions for Ecolab Inc.
| Grading Company | Action | New Grade | Date |
|---|---|---|---|
| Citigroup | Maintain | Buy | 2026-01-21 |
| Wells Fargo | Maintain | Equal Weight | 2026-01-14 |
| UBS | Maintain | Neutral | 2026-01-07 |
| Citigroup | Maintain | Buy | 2025-12-18 |
| Evercore ISI Group | Upgrade | Outperform | 2025-11-03 |
| UBS | Maintain | Neutral | 2025-10-31 |
| Barclays | Maintain | Overweight | 2025-10-29 |
| Stifel | Maintain | Buy | 2025-10-29 |
| Citigroup | Maintain | Buy | 2025-10-29 |
| JP Morgan | Maintain | Neutral | 2025-10-29 |
Air Products and Chemicals, Inc. Grades
This table presents recent institutional grades and rating changes for Air Products and Chemicals, Inc.
| Grading Company | Action | New Grade | Date |
|---|---|---|---|
| Citigroup | Maintain | Neutral | 2026-01-21 |
| B of A Securities | Upgrade | Neutral | 2026-01-08 |
| Wells Fargo | Downgrade | Equal Weight | 2025-12-19 |
| Mizuho | Maintain | Outperform | 2025-12-18 |
| Citigroup | Downgrade | Neutral | 2025-12-15 |
| UBS | Downgrade | Neutral | 2025-12-12 |
| Argus Research | Maintain | Buy | 2025-12-11 |
| Evercore ISI Group | Maintain | Outperform | 2025-11-11 |
| JP Morgan | Maintain | Neutral | 2025-11-07 |
| Wells Fargo | Maintain | Overweight | 2025-11-07 |
Which company has the best grades?
Ecolab Inc. consistently receives Buy and Outperform ratings from multiple firms, indicating stronger institutional confidence. Air Products and Chemicals shows mixed Neutral and Outperform grades with recent downgrades. Investors might view Ecolab’s steadier upgrades as a sign of more bullish analyst sentiment.
Risks specific to each company
The following categories identify the critical pressure points and systemic threats facing both firms in the 2026 market environment:
1. Market & Competition
Ecolab Inc.
- Operates in diversified specialty chemicals with strong global industrial and healthcare segments. Faces intense competition in water and hygiene solutions.
Air Products and Chemicals, Inc.
- Focuses on atmospheric and specialty gases with innovation in hydrogen compression. Faces competition in industrial gases and energy transition markets.
2. Capital Structure & Debt
Ecolab Inc.
- Debt-to-equity ratio near 0.95 signals moderate leverage; interest coverage at 8.6x is strong and manageable.
Air Products and Chemicals, Inc.
- Higher debt-to-equity at 1.23 with negative interest coverage (-1.06) raises concerns about financial strain.
3. Stock Volatility
Ecolab Inc.
- Beta of 0.999 suggests market-neutral volatility, reflecting stable price fluctuations.
Air Products and Chemicals, Inc.
- Lower beta of 0.88 indicates less volatility, but recent high price range and volume spikes suggest episodic swings.
4. Regulatory & Legal
Ecolab Inc.
- Exposure to stringent environmental and healthcare regulations globally; compliance costs are significant but well-managed.
Air Products and Chemicals, Inc.
- Operates in heavily regulated industrial gases sector; hydrogen projects face evolving safety and environmental standards.
5. Supply Chain & Operations
Ecolab Inc.
- Complex global supply chains for chemicals and sanitization products; operational agility critical amid raw material volatility.
Air Products and Chemicals, Inc.
- Supply chain relies on critical gases and equipment manufacturing; disruption risks from specialized component scarcity.
6. ESG & Climate Transition
Ecolab Inc.
- Strong focus on water and energy efficiency solutions, supporting ESG credentials and customer demand for sustainability.
Air Products and Chemicals, Inc.
- Leading in hydrogen and clean energy gases; ESG positioning hinges on successful commercialization of green technologies.
7. Geopolitical Exposure
Ecolab Inc.
- Global footprint exposes it to trade tensions and emerging market risks, but diversified presence mitigates concentrated impact.
Air Products and Chemicals, Inc.
- Significant exposure to global energy markets and geopolitical risks related to hydrogen infrastructure investments.
Which company shows a better risk-adjusted profile?
Ecolab’s moderate leverage, stable market position, and strong operational metrics create a more resilient risk profile. Air Products faces heightened risks from weak profitability, financial strain, and volatile innovation investments. Ecolab’s Altman Z-Score in the safe zone (5.3) versus Air Products’ grey zone (2.5) underscores stronger financial health. The most impactful risk for Ecolab lies in competitive pressure and supply chain complexity. For Air Products, financial distress and operational volatility dominate. Recent rebound in Air Products’ stock price (+6.4%) signals market optimism but masks underlying financial fragility. Overall, Ecolab offers a superior risk-adjusted investment proposition in 2026.
Final Verdict: Which stock to choose?
Ecolab Inc. stands out with its superpower of delivering durable value creation through a growing moat and efficient capital use. Its challenge lies in a relatively high valuation and leverage, which calls for caution. It suits investors with an aggressive growth appetite seeking sustainable profitability.
Air Products and Chemicals, Inc. offers a strategic moat rooted in industrial gas market positioning and a safer liquidity profile relative to Ecolab. However, it currently suffers from declining returns and profitability pressures. This aligns better with risk-tolerant investors focused on turnaround potential or GARP strategies.
If you prioritize durable economic moats and consistent value creation, Ecolab outshines with superior returns on invested capital and income growth. However, if your focus is on exposure to industrial gas markets with a more conservative balance sheet, Air Products might offer better stability despite its current operational headwinds. Each scenario requires careful risk management.
Disclaimer: Investment carries a risk of loss of initial capital. The past performance is not a reliable indicator of future results. Be sure to understand risks before making an investment decision.
Go Further
I encourage you to read the complete analyses of Ecolab Inc. and Air Products and Chemicals, Inc. to enhance your investment decisions: