In the fast-evolving medical diagnostics and research industry, Agilent Technologies, Inc. and Waters Corporation stand out as key innovators driving analytical solutions. Both companies specialize in advanced instrumentation and software that support life sciences and applied chemical markets, often competing for similar clientele. This analysis will explore their market positions, innovation strategies, and growth potential to help you decide which stock might best enhance your investment portfolio.
Table of contents
Companies Overview
I will begin the comparison between Agilent Technologies, Inc. and Waters Corporation by providing an overview of these two companies and their main differences.
Agilent Technologies Overview
Agilent Technologies, Inc. offers application-focused solutions to life sciences, diagnostics, and applied chemical markets worldwide. It provides a wide range of instruments and software including chromatography systems, mass spectrometry, cell analysis tools, and laboratory automation. Agilent also supports customers through services and consumables, positioning itself as a comprehensive provider in medical diagnostics and research. The company is headquartered in Santa Clara, California.
Waters Corporation Overview
Waters Corporation is a specialty measurement company supplying analytical workflow solutions globally. It designs and services high-performance liquid chromatography and mass spectrometry systems alongside thermal analysis and rheometry instruments. Waters targets pharmaceutical, biochemical, environmental, and academic customers for research and quality assurance applications. Founded in 1958, the company is based in Milford, Massachusetts.
Key similarities and differences
Both companies operate in the healthcare sector focusing on medical diagnostics and research instruments, with an emphasis on chromatography and mass spectrometry technologies. Agilent offers a broader portfolio including cell analysis and laboratory automation, while Waters emphasizes analytical workflows and thermal analysis. Agilent has a larger workforce and market capitalization, reflecting its broader product range and services, whereas Waters concentrates on specialized measurement systems and software integration.
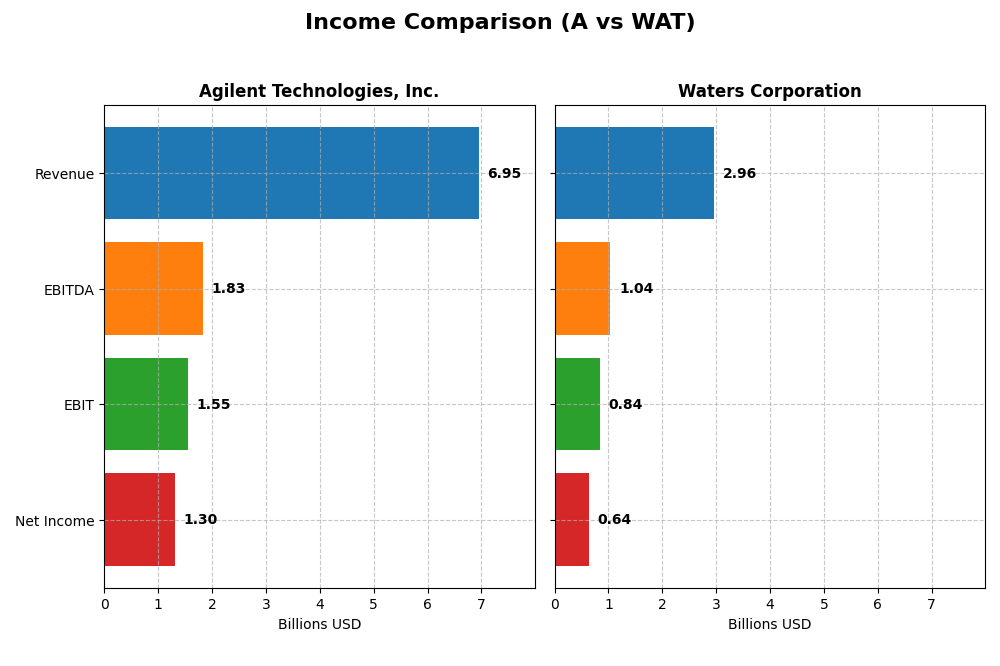
Income Statement Comparison
This table presents the key income statement metrics for Agilent Technologies, Inc. and Waters Corporation for their most recent fiscal years, providing a snapshot of their financial performance.
| Metric | Agilent Technologies, Inc. | Waters Corporation |
|---|---|---|
| Market Cap | 42.1B | 23.6B |
| Revenue | 6.95B | 2.96B |
| EBITDA | 1.84B | 1.04B |
| EBIT | 1.55B | 845M |
| Net Income | 1.30B | 638M |
| EPS | 4.59 | 10.75 |
| Fiscal Year | 2025 | 2024 |
Income Statement Interpretations
Agilent Technologies, Inc.
Agilent Technologies showed steady revenue growth from 2021 to 2025, reaching $6.95B in 2025, with net income also increasing to $1.3B. Margins remained generally stable, with a gross margin of 52.43% and net margin of 18.75%. In 2025, revenue growth slowed slightly to 6.73%, while EBIT and net margin declined, indicating some margin pressure despite EPS growth.
Waters Corporation
Waters Corporation’s revenue grew moderately over 2020–2024, reaching nearly $3B in 2024, with net income rising to $638M. Margins were strong and stable, with a gross margin of 59.43% and net margin of 21.56%. However, in 2024 revenue and gross profit growth nearly stalled, with slight declines in net margin and EPS, suggesting recent challenges in maintaining profitability momentum.
Which one has the stronger fundamentals?
Both companies display favorable income statement fundamentals, with consistent revenue and net income growth over their respective periods. Agilent shows broader scale and solid margin stability, though recent EBIT and net margin contraction reveal some risks. Waters has higher margins but more margin volatility recently and slower top-line growth. Overall, both maintain favorable fundamentals but face distinct margin and growth dynamics.
Financial Ratios Comparison
The table below compares key financial ratios for Agilent Technologies, Inc. (A) and Waters Corporation (WAT) based on their most recent fiscal year data.
| Ratios | Agilent Technologies, Inc. (2025) | Waters Corporation (2024) |
|---|---|---|
| ROE | 19.3% | 34.9% |
| ROIC | 12.6% | 18.4% |
| P/E | 31.8 | 34.5 |
| P/B | 6.14 | 12.0 |
| Current Ratio | 1.96 | 2.11 |
| Quick Ratio | 1.52 | 1.51 |
| D/E (Debt-to-Equity) | 0.50 | 0.93 |
| Debt-to-Assets | 26.4% | 37.4% |
| Interest Coverage | 13.2 | 9.21 |
| Asset Turnover | 0.55 | 0.65 |
| Fixed Asset Turnover | 3.43 | 4.08 |
| Payout Ratio | 21.6% | 0% |
| Dividend Yield | 0.68% | 0% |
Interpretation of the Ratios
Agilent Technologies, Inc.
Agilent’s financial ratios appear strong with favorable net margin (18.75%), ROE (19.33%), and ROIC (12.57%), indicating solid profitability and efficient capital use. The company also maintains a healthy current ratio (1.96) and low debt levels. However, valuation metrics like PE (31.79) and PB (6.14) are unfavorable, suggesting a potentially high stock price. Agilent pays dividends with a low yield of 0.68%, indicating conservative shareholder returns amid solid cash flow coverage.
Waters Corporation
Waters shows robust profitability ratios, including a higher net margin (21.56%) and an impressive ROE (34.88%), alongside a strong ROIC (18.43%). Liquidity ratios are favorable, though debt metrics such as debt-to-equity (0.93) and debt-to-assets (37.38%) are neutral, reflecting moderate leverage. Its valuation multiples, PE (34.51) and PB (12.04), are unfavorable, signaling premium pricing. Waters does not pay dividends, likely prioritizing reinvestment and growth, with free cash flow currently negative.
Which one has the best ratios?
Comparing both, Agilent presents a more balanced ratio profile with more favorable profitability and leverage measures, alongside dividend payments. Waters excels in return metrics but carries higher leverage and lacks dividend returns. Both face high valuation concerns, though Agilent’s overall ratio evaluations are more favorable, while Waters is slightly favorable.
Strategic Positioning
This section compares the strategic positioning of Agilent Technologies, Inc. and Waters Corporation, including market position, key segments, and exposure to technological disruption:
Agilent Technologies, Inc.
- Larger market cap of 42B with higher beta implies stronger competitive pressure in diagnostics and research.
- Diverse segments: Life Sciences, Diagnostics, and CrossLab with broad product and service offerings.
- Exposure to evolving technologies in genomics, cell analysis, and laboratory automation.
Waters Corporation
- Smaller market cap of 24B with moderate beta, focused on specialty measurement in analytical workflow solutions.
- Concentrated on chromatography, mass spectrometry, thermal analysis, rheometry, and related software solutions.
- Focused on chromatography and mass spectrometry technology, including software interfacing with various instruments.
Agilent Technologies vs Waters Corporation Positioning
Agilent’s diversified approach covers multiple high-tech segments, providing broader market exposure but possibly higher complexity. Waters concentrates on analytical instruments and related services, offering focused specialization but narrower segment coverage.
Which has the best competitive advantage?
Both companies create value with ROIC above WACC, but each shows declining profitability. Agilent and Waters have a slightly favorable moat, indicating stable but challenged competitive advantages based on current return trends.
Stock Comparison
The stock price dynamics of Agilent Technologies, Inc. and Waters Corporation over the past 12 months reveal distinct bullish trends with differing momentum and volatility profiles.
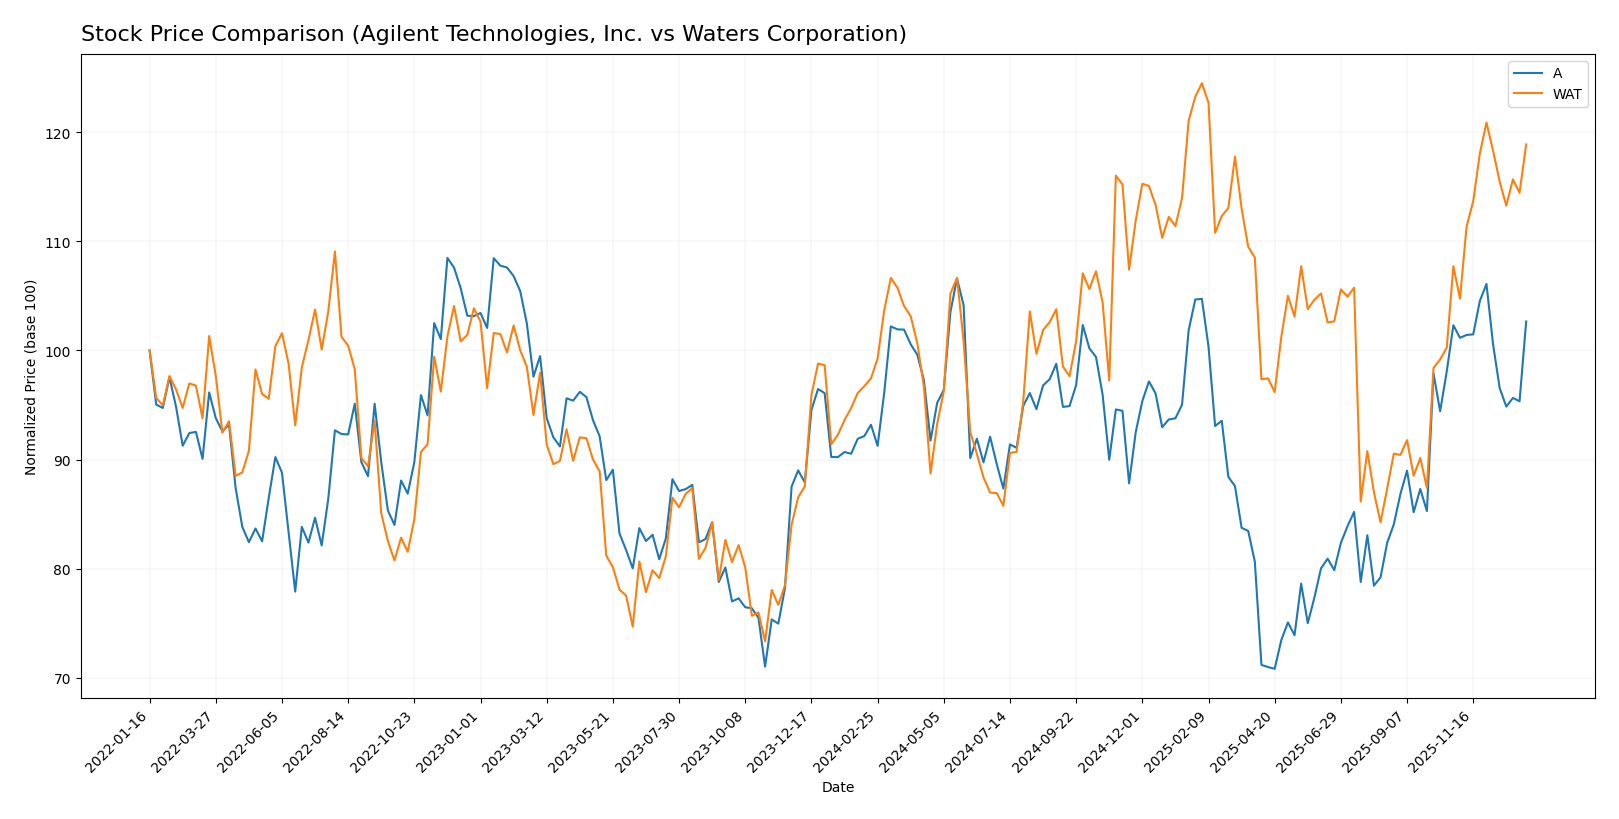
Trend Analysis
Agilent Technologies, Inc. demonstrated a bullish trend with a 10.15% price increase over the past year, showing deceleration despite reaching a high of 154.23 and a low of 102.48. Recent movement shows a near-neutral 0.33% change with slight downward slope.
Waters Corporation exhibited a stronger bullish trend with a 22.0% gain over the past year, accompanied by acceleration and higher volatility, hitting a high of 415.48 and a low of 281.2. Recent price change accelerated by 10.36%, supported by a positive slope.
Comparing these trends, Waters Corporation delivered the highest market performance with a 22.0% increase, outperforming Agilent Technologies’ 10.15% gain over the same 12-month period.
Target Prices
Here is the current target price consensus from verified analysts for selected companies:
| Company | Target High | Target Low | Consensus |
|---|---|---|---|
| Agilent Technologies, Inc. | 180 | 130 | 165 |
| Waters Corporation | 480 | 315 | 406.86 |
Analysts expect Agilent Technologies’ stock to appreciate from its current price of $148.52 toward the consensus target of $165, reflecting moderate upside potential. Waters Corporation’s consensus target of $406.86 is slightly above its current price of $396.75, indicating cautious optimism.
Analyst Opinions Comparison
This section compares analysts’ ratings and financial scores for Agilent Technologies, Inc. (A) and Waters Corporation (WAT):
Rating Comparison
A Rating
- Rating: B+ with a very favorable overall evaluation.
- Discounted Cash Flow Score: 4, indicating favorable valuation.
- Return on Equity Score: 5, reflecting very favorable profitability from equity.
- Return on Assets Score: 5, showing very effective asset utilization.
- Debt To Equity Score: 2, representing moderate financial risk.
- Overall Score: 3, indicating a moderate overall rating.
WAT Rating
- Rating: B+ with a very favorable overall evaluation.
- Discounted Cash Flow Score: 4, indicating favorable valuation.
- Return on Equity Score: 5, reflecting very favorable profitability from equity.
- Return on Assets Score: 5, showing very effective asset utilization.
- Debt To Equity Score: 1, showing very unfavorable financial risk level.
- Overall Score: 3, indicating a moderate overall rating.
Which one is the best rated?
Both companies share identical ratings and strong scores in DCF, ROE, and ROA, but differ in debt management where A has a moderate risk score versus WAT’s very unfavorable score. Overall, their ratings are equally balanced at a moderate level.
Scores Comparison
The scores comparison between Agilent Technologies and Waters Corporation is as follows:
Agilent Technologies Scores
- Altman Z-Score: 5.21, indicating a safe zone for bankruptcy risk.
- Piotroski Score: 6, reflecting average financial strength.
Waters Corporation Scores
- Altman Z-Score: 9.73, indicating a safe zone for bankruptcy risk.
- Piotroski Score: 6, reflecting average financial strength.
Which company has the best scores?
Waters Corporation has a higher Altman Z-Score than Agilent Technologies, both in the safe zone, while their Piotroski Scores are equal at 6, indicating similar average financial strength.
Grades Comparison
Here is a detailed comparison of the latest grades assigned to Agilent Technologies, Inc. and Waters Corporation:
Agilent Technologies, Inc. Grades
The following table summarizes the recent grades from reputable financial institutions for Agilent Technologies, Inc.:
| Grading Company | Action | New Grade | Date |
|---|---|---|---|
| Evercore ISI Group | Upgrade | Outperform | 2026-01-05 |
| Barclays | Upgrade | Overweight | 2025-12-15 |
| JP Morgan | Maintain | Overweight | 2025-11-25 |
| Wells Fargo | Maintain | Overweight | 2025-11-25 |
| B of A Securities | Maintain | Neutral | 2025-11-25 |
| UBS | Maintain | Buy | 2025-11-25 |
| Barclays | Maintain | Equal Weight | 2025-11-25 |
| Citigroup | Maintain | Buy | 2025-11-25 |
| Baird | Maintain | Outperform | 2025-11-25 |
| TD Cowen | Maintain | Buy | 2025-10-14 |
Agilent Technologies has generally received positive grades, with recent upgrades and a consensus rating of “Buy,” indicating a favorable outlook from analysts.
Waters Corporation Grades
The following table summarizes the recent grades from reputable financial institutions for Waters Corporation:
| Grading Company | Action | New Grade | Date |
|---|---|---|---|
| Wells Fargo | Maintain | Equal Weight | 2025-12-15 |
| Wolfe Research | Upgrade | Outperform | 2025-12-10 |
| Wells Fargo | Maintain | Equal Weight | 2025-11-05 |
| TD Cowen | Maintain | Hold | 2025-11-05 |
| JP Morgan | Maintain | Neutral | 2025-10-09 |
| Wells Fargo | Maintain | Equal Weight | 2025-08-05 |
| Deutsche Bank | Maintain | Hold | 2025-08-05 |
| Jefferies | Maintain | Buy | 2025-08-04 |
| Baird | Maintain | Outperform | 2025-07-16 |
| Wells Fargo | Downgrade | Equal Weight | 2025-07-15 |
Waters Corporation shows a mixed set of grades, mostly steady with some downgrades, and holds a consensus rating of “Hold,” reflecting a more cautious analyst stance.
Which company has the best grades?
Agilent Technologies, Inc. generally has stronger and more upgraded analyst ratings compared to Waters Corporation, which mostly maintains neutral to hold positions. This difference may impact investor sentiment by favoring Agilent as having a more optimistic outlook.
Strengths and Weaknesses
Below is a comparative overview of the strengths and weaknesses of Agilent Technologies, Inc. (A) and Waters Corporation (WAT) based on their most recent financial and operational data.
| Criterion | Agilent Technologies, Inc. (A) | Waters Corporation (WAT) |
|---|---|---|
| Diversification | Strong diversification with multiple segments: Agilent CrossLab $2.9B, Applied Markets $1.3B, Life Sciences and Applied Markets $2.7B (2025) | Moderate diversification focused on instrument systems and consumables with Chemistry Consumables $565M, Waters Instrument Systems $1.03B, and Waters Service $1.01B (2024) |
| Profitability | Favorable profitability indicators: Net margin 18.75%, ROE 19.33%, ROIC 12.57% (2025) | Higher profitability margins: Net margin 21.56%, ROE 34.88%, ROIC 18.43% (2024) |
| Innovation | Strong R&D focus, but recent ROIC trend is declining, signaling caution | Also experiencing declining ROIC trends despite strong value creation and innovation |
| Global presence | Established global footprint with broad market reach | Similarly global but more concentrated in specific instrument markets |
| Market Share | Leading position in life sciences and diagnostics markets | Strong in analytical instruments and consumables, with solid market penetration |
Key takeaways: Both companies create value with favorable profitability and solid market positions. Agilent offers broader diversification, while Waters delivers higher profitability but shows a sharper decline in ROIC trend. Investors should weigh diversification against profitability trends and monitor ongoing ROIC performance closely.
Risk Analysis
The table below summarizes key risks for Agilent Technologies, Inc. (A) and Waters Corporation (WAT) based on their most recent financial and operational data.
| Metric | Agilent Technologies, Inc. (A) | Waters Corporation (WAT) |
|---|---|---|
| Market Risk | Beta 1.29 indicates moderate volatility relative to the market | Beta 1.16, slightly less volatile than Agilent |
| Debt level | Debt-to-Equity 0.5 (favorable), Debt-to-Assets 26.35% (favorable) | Debt-to-Equity 0.93 (neutral), Debt-to-Assets 37.38% (neutral) |
| Regulatory Risk | Moderate, healthcare sector compliance requirements | Moderate, similar healthcare regulatory environment |
| Operational Risk | Large workforce (17,900) with complex global operations | Smaller workforce (7,600), potentially less operational complexity |
| Environmental Risk | Industry exposure to chemical and lab waste management | Similar exposure, with emphasis on environmental testing products |
| Geopolitical Risk | US-based with global sales, moderate exposure to trade tensions | US-based with global presence, moderate geopolitical exposure |
Agilent’s moderate market volatility and lower leverage suggest slightly better risk management compared to Waters, which carries higher debt levels. Both face regulatory and environmental risks typical of healthcare and diagnostics sectors. Operational scale differences may impact agility and risk exposure.
Which Stock to Choose?
Agilent Technologies, Inc. (A) shows a generally favorable income evolution with 6.73% revenue growth in 2025 and strong profitability metrics such as an 18.75% net margin and 19.33% ROE. The company maintains moderate debt levels with a net debt to EBITDA of 0.85 and a solid rating of B+ (Very Favorable).
Waters Corporation (WAT) demonstrates robust long-term income growth of 25.07% overall, with a slightly favorable global income statement despite minor recent declines. It has a higher net margin at 21.56% and ROE of 34.88%, but carries more debt with a net debt to EBITDA of 1.33 and also holds a B+ rating (Very Favorable).
For investors, the choice might depend on risk tolerance and investment goals: those focused on stable profitability and moderate leverage may find Agilent’s profile more suitable, while investors seeking higher growth potential coupled with higher leverage might view Waters as more favorable given its stronger ROE and recent price acceleration.
Disclaimer: Investment carries a risk of loss of initial capital. The past performance is not a reliable indicator of future results. Be sure to understand risks before making an investment decision.
Go Further
I encourage you to read the complete analyses of Agilent Technologies, Inc. and Waters Corporation to enhance your investment decisions: