Home > Comparison > Healthcare > TMO vs A
The strategic rivalry between Thermo Fisher Scientific Inc. and Agilent Technologies, Inc. shapes the Healthcare sector’s diagnostics and research landscape. Thermo Fisher operates as a diversified life sciences solutions powerhouse with a broad biopharma and laboratory services footprint. Agilent, by contrast, focuses on precision analytical instruments and specialized diagnostics with a leaner operational model. This analysis will clarify which company’s trajectory offers the best risk-adjusted potential for a balanced, growth-oriented portfolio.
Table of contents
Companies Overview
Thermo Fisher Scientific and Agilent Technologies dominate the life sciences and diagnostics sectors with distinct market approaches.
Thermo Fisher Scientific Inc.: Life Sciences Powerhouse
Thermo Fisher Scientific excels as a global leader in life sciences solutions. It generates revenue through reagents, instruments, and biopharma services focused on drug discovery, diagnostics, and clinical research. In 2026, its strategy centers on expanding its integrated platform across biosciences, specialty diagnostics, and laboratory services to maintain its broad competitive moat.
Agilent Technologies, Inc.: Analytical Innovator
Agilent Technologies stands out as a specialist in analytical instruments and diagnostics. It drives revenue from chromatography, mass spectrometry, genomics, and laboratory automation solutions. Its 2026 focus emphasizes deepening application-specific offerings and enhancing service capabilities to sustain growth in life sciences and applied chemical markets.
Strategic Collision: Similarities & Divergences
Both companies target healthcare and diagnostics but differ in scope: Thermo Fisher pursues an integrated, end-to-end solution ecosystem, while Agilent prioritizes precision instruments and application focus. The primary battleground lies in analytical and diagnostic tools where innovation and service quality dictate market share. Their contrasting scale and diversification create distinct risk-return profiles for investors.
Income Statement Comparison
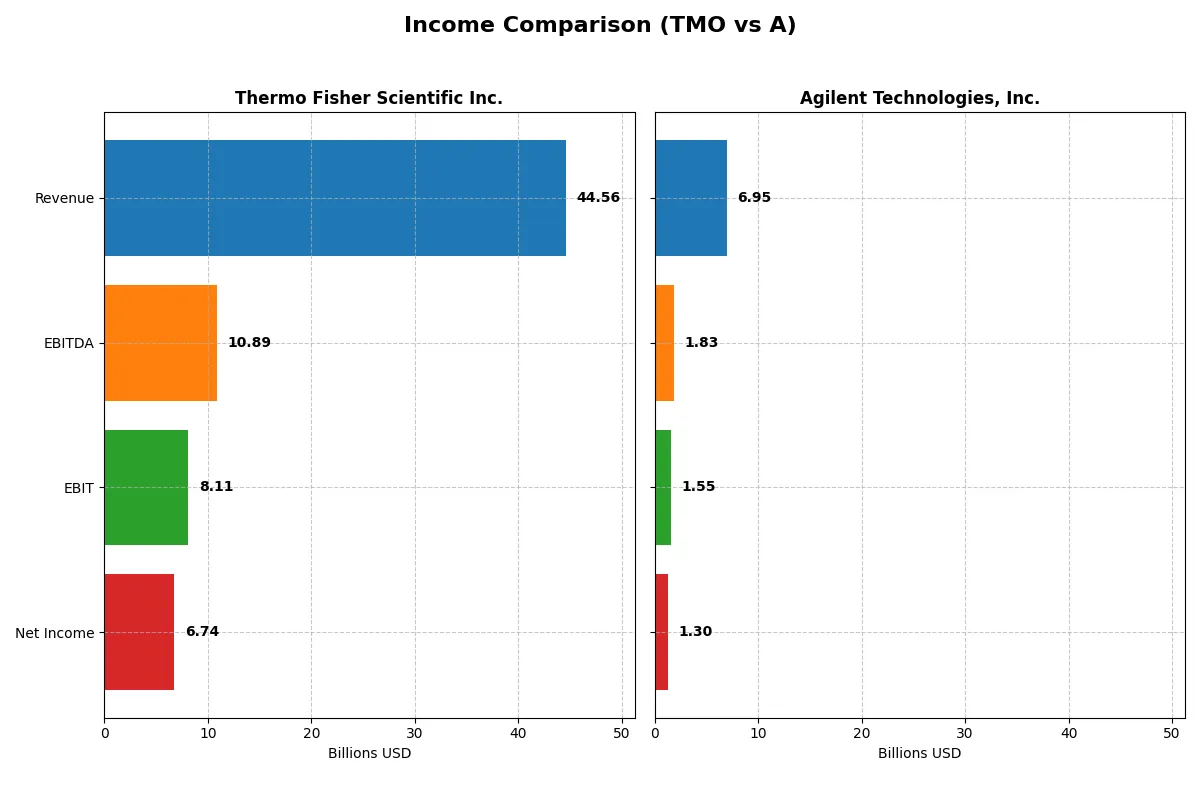
The following data dissects the core profitability and scalability of both corporate engines to reveal who dominates the bottom line:
| Metric | Thermo Fisher Scientific Inc. (TMO) | Agilent Technologies, Inc. (A) |
|---|---|---|
| Revenue | 44.6B | 6.95B |
| Cost of Revenue | 27.8B | 3.31B |
| Operating Expenses | 8.67B | 2.16B |
| Gross Profit | 16.8B | 3.64B |
| EBITDA | 10.9B | 1.84B |
| EBIT | 8.11B | 1.55B |
| Interest Expense | 1.42B | 112M |
| Net Income | 6.74B | 1.30B |
| EPS | 17.77 | 4.59 |
| Fiscal Year | 2025 | 2025 |
Income Statement Analysis: The Bottom-Line Duel
The income statement comparison reveals which company runs a more efficient and profitable operation under current market conditions.
Thermo Fisher Scientific Inc. Analysis
Thermo Fisher’s revenue grew modestly to $44.6B in 2025, but net income declined to $6.74B, reflecting margin pressure. Its gross margin contracts to 37.7%, while net margin holds at 15.1%, showing resilience despite a 6.7% EBIT dip. Efficiency waned slightly, yet EPS grew 7.3%, signaling controlled capital allocation.
Agilent Technologies, Inc. Analysis
Agilent’s revenue increased 6.7% to $6.95B in 2025, with net income rising to $1.3B. It sustains a strong gross margin of 52.4% and a higher net margin of 18.8%. Despite a 4.3% EBIT decline, Agilent maintains operational efficiency and posts a 3.2% EPS growth, indicating steady profit momentum.
Margin Strength vs. Growth Resilience
Agilent commands superior margins and consistent profit growth, while Thermo Fisher boasts larger scale but faces margin contraction and net income decline. Agilent’s profile appeals to investors prioritizing profitability and efficiency. Thermo Fisher suits those valuing revenue scale with cautious margin pressures.
Financial Ratios Comparison
These vital ratios act as a diagnostic tool to expose the underlying fiscal health, valuation premiums, and capital efficiency of each company:
| Ratios | Thermo Fisher Scientific Inc. (TMO) | Agilent Technologies, Inc. (A) |
|---|---|---|
| ROE | 12.6% | 19.3% |
| ROIC | 7.6% | 12.6% |
| P/E | 32.3 | 31.8 |
| P/B | 4.08 | 6.14 |
| Current Ratio | 1.89 | 1.96 |
| Quick Ratio | 1.53 | 1.52 |
| D/E | 0.74 | 0.50 |
| Debt-to-Assets | 35.7% | 26.4% |
| Interest Coverage | 5.71 | 13.2 |
| Asset Turnover | 0.40 | 0.55 |
| Fixed Asset Turnover | 4.22 | 3.43 |
| Payout ratio | 9.4% | 21.6% |
| Dividend yield | 0.29% | 0.68% |
| Fiscal Year | 2025 | 2025 |
Efficiency & Valuation Duel: The Vital Signs
Financial ratios act as the company’s DNA, uncovering hidden risks and operational strengths essential for informed investment decisions.
Thermo Fisher Scientific Inc.
Thermo Fisher shows a neutral ROE of 12.6% and a net margin of 15.1%, indicating moderate profitability. Its P/E of 32.3 and P/B of 4.1 suggest a stretched valuation relative to earnings and book value. The company returns value through a modest 0.29% dividend yield, signaling limited cash distribution and likely reinvestment in growth or R&D.
Agilent Technologies, Inc.
Agilent delivers superior profitability with a 19.3% ROE and 18.8% net margin, reflecting operational efficiency. Its P/E of 31.8 and P/B of 6.1 appear high but align with strong returns. The 0.68% dividend yield offers shareholders modest income, while a solid balance sheet and reinvestment in R&D support growth prospects.
Valuation Stretch vs. Profit Power
Agilent excels in profitability and balance sheet strength, offering a more favorable ratio profile despite a slightly elevated valuation. Thermo Fisher’s valuation is similarly stretched but offset by moderate returns and a conservative dividend. Investors seeking robust returns may prefer Agilent’s profile, while those prioritizing stability might lean toward Thermo Fisher.
Which one offers the Superior Shareholder Reward?
I compare Thermo Fisher Scientific (TMO) and Agilent Technologies (A) by their dividend yield, payout ratio, and share buyback intensity. TMO yields 0.29% with a low payout ratio near 9%, supported by strong free cash flow coverage (3.6x). Its buybacks are steady but moderate. Agilent pays a higher yield of 0.68% and a payout ratio above 21%, yet with lower dividend coverage (2.3x), signaling a more aggressive distribution approach. Both reinvest heavily in operations; Agilent’s margins and ROIC exceed TMO’s, suggesting stronger growth potential. However, TMO’s conservative payout and robust cash flow underpin sustainability. I judge TMO’s balanced buyback and dividend policy delivers a more reliable total return for 2026 investors, despite Agilent’s tempting yield.
Comparative Score Analysis: The Strategic Profile
The radar chart reveals the fundamental DNA and trade-offs of Thermo Fisher Scientific Inc. and Agilent Technologies, Inc.:
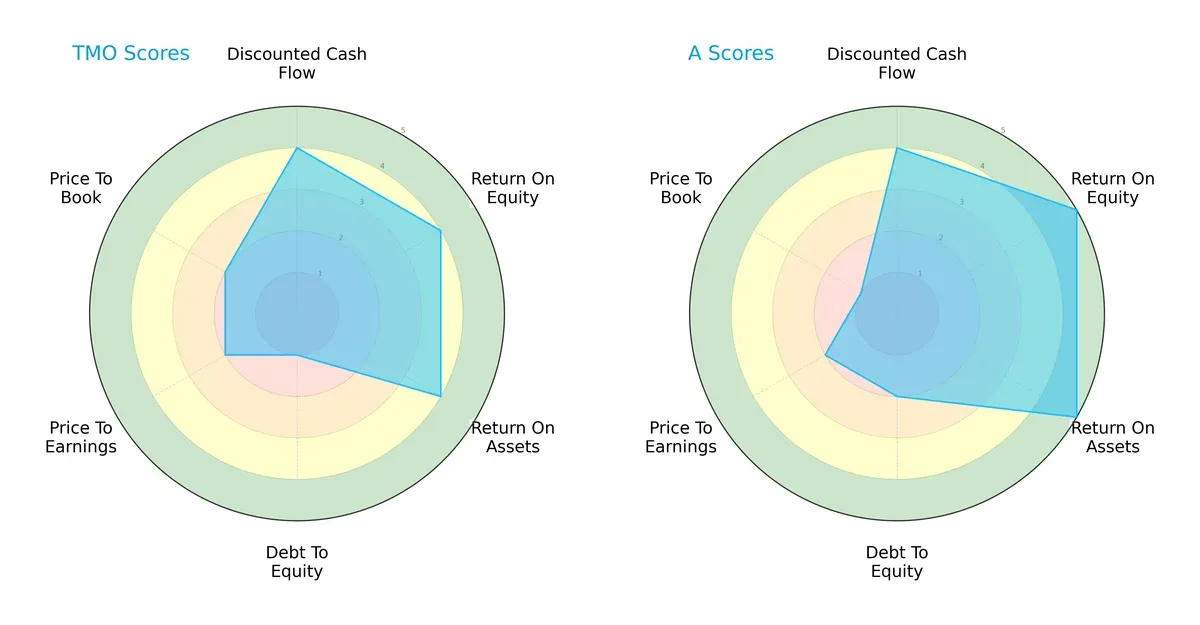
Agilent leads in profitability metrics, scoring 5 in ROE and ROA, demonstrating superior asset and equity efficiency. Thermo Fisher matches Agilent in discounted cash flow strength with a 4 but lags in debt management, scoring only 1 in Debt/Equity—an important red flag. Valuation scores are moderate for both, though Agilent’s low Price-to-Book score (1) suggests market skepticism. Overall, Agilent displays a more balanced financial profile, while Thermo Fisher relies on its cash flow generation but carries heavier leverage risk.
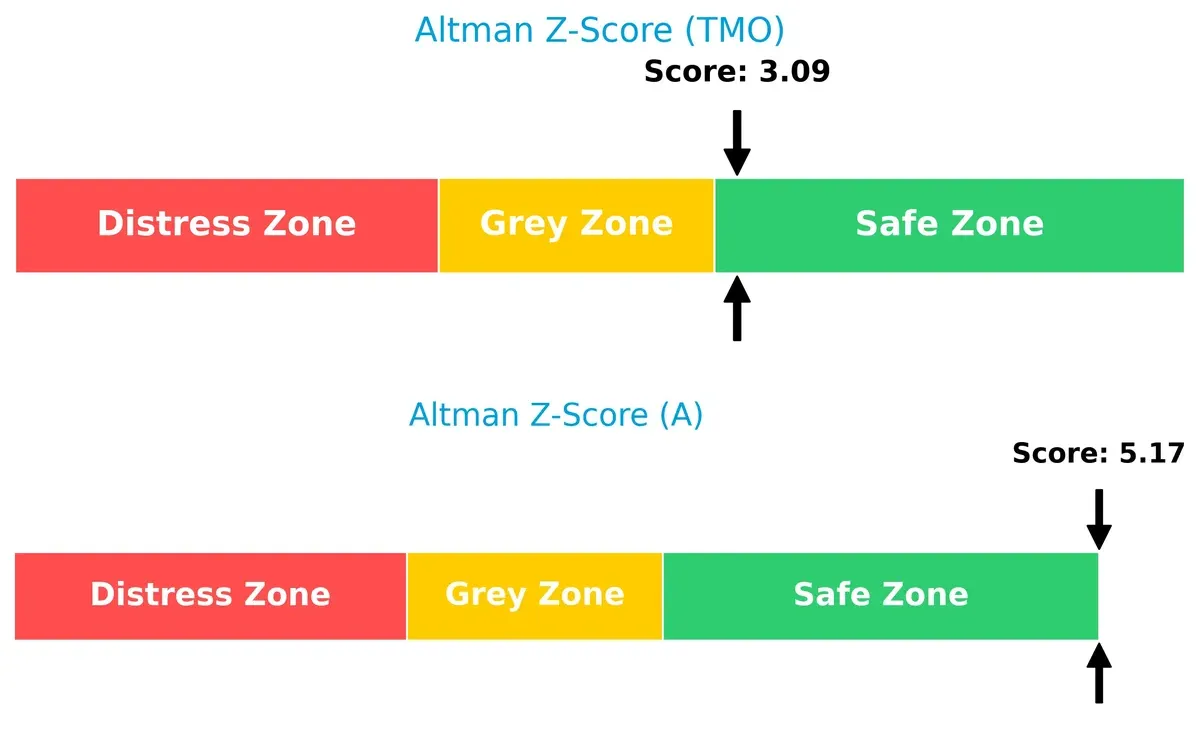
Bankruptcy Risk: Solvency Showdown
Thermo Fisher’s Altman Z-Score of 3.09 versus Agilent’s stronger 5.17 signals both firms are safely positioned, but Agilent holds a more robust buffer against financial distress in this cycle:
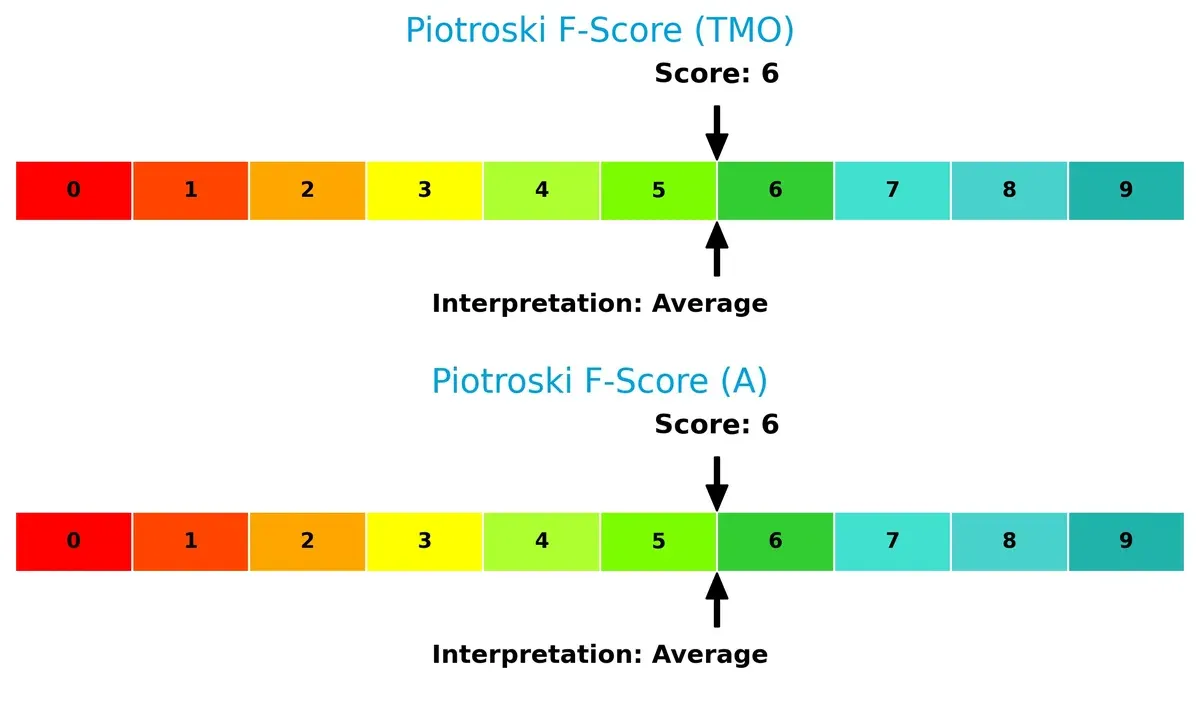
Financial Health: Quality of Operations
Both firms register Piotroski F-Scores of 6, indicating average financial health without clear red flags. They maintain operational stability but lack the peak internal strength investors seek for a margin of safety:
How are the two companies positioned?
This section dissects the operational DNA of Thermo Fisher Scientific and Agilent Technologies by comparing their revenue distribution and internal dynamics. The goal is to confront their economic moats to determine which business model delivers a more resilient and sustainable competitive advantage.
Revenue Segmentation: The Strategic Mix
This visual comparison dissects how Thermo Fisher Scientific Inc. and Agilent Technologies, Inc. diversify their income streams and where their primary sector bets lie:
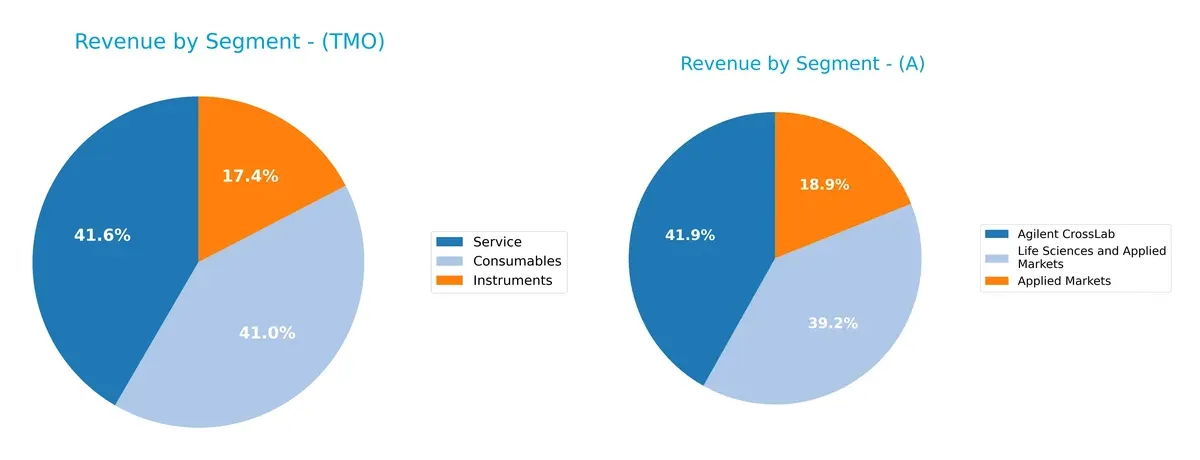
Thermo Fisher anchors revenue in three balanced segments: Consumables at $17.6B, Service at $17.8B, and Instruments at $7.4B in 2024. This mix shows strong ecosystem lock-in through consumables and recurring service revenue. Agilent leans heavily on Life Sciences and Applied Markets, generating $3.2B, dwarfing its Diagnostics and Genomics ($1.65B) and CrossLab ($1.64B) segments. Agilent’s concentration suggests higher risk but also a focused strategic bet on life sciences growth.
Strengths and Weaknesses Comparison
This table compares the Strengths and Weaknesses of Thermo Fisher Scientific Inc. and Agilent Technologies, Inc.:
Thermo Fisher Scientific Inc. Strengths
- Balanced revenue from consumables, instruments, and services
- Favorable net margin of 15.12%
- Strong liquidity with current ratio 1.89 and quick ratio 1.53
- Global presence with significant US, Europe, and Asia Pacific sales
- Favorable WACC at 7.38% supports capital efficiency
Agilent Technologies, Inc. Strengths
- Higher profitability with net margin 18.75% and ROE 19.33%
- Favorable ROIC of 12.57% exceeds WACC, indicating value creation
- Strong liquidity and low leverage with debt-to-assets 26.35%
- Well-diversified revenue across Americas, Asia Pacific, and Europe
- Favorable interest coverage ratio of 13.81 suggests robust debt servicing
Thermo Fisher Scientific Inc. Weaknesses
- Unfavorable price multiples with PE 32.34 and PB 4.08 indicating premium valuation
- Asset turnover at 0.4 reflects lower operational efficiency
- Dividend yield low at 0.29% may deter income-focused investors
Agilent Technologies, Inc. Weaknesses
- Valuation also stretched with PE 31.79 and PB 6.14
- Dividend yield moderate but still unfavorable at 0.68%
- ROE and ROIC advantages offset by higher WACC at 9.35%
Thermo Fisher’s strengths lie in its diversified revenue streams and solid liquidity, but premium valuation and asset utilization remain concerns. Agilent shows superior profitability and capital returns but faces challenges from elevated valuation and cost of capital. Both companies display sound global footprints, though distinct financial profiles suggest different strategic trade-offs.
The Moat Duel: Analyzing Competitive Defensibility
A structural moat is the only reliable shield protecting long-term profits from competition’s relentless erosion:
Thermo Fisher Scientific Inc.: Intangible Assets and Scale Advantage
Thermo Fisher leverages its vast portfolio and global scale to sustain high ROIC despite recent declines. Its broad product ecosystem stabilizes margins. Expansion in biopharma services may deepen this moat in 2026 but margin pressure poses risks.
Agilent Technologies, Inc.: Cost Advantage and Innovation Focus
Agilent’s moat stems from cost-efficient production and targeted innovation in analytical instruments. It commands superior margins and ROIC well above WACC, outperforming Thermo Fisher. Opportunities in diagnostics and software could extend its competitive edge into new markets.
Intangible Assets vs. Cost Leadership: The Moat Showdown
Agilent holds a wider and deeper moat as evidenced by strong ROIC spread over WACC and better margin profiles. Thermo Fisher’s scale and intangible assets protect it but weakening returns expose vulnerabilities. Agilent is better positioned to defend market share amid evolving industry demands.
Which stock offers better returns?
The past year shows diverging price trajectories for Thermo Fisher Scientific Inc. and Agilent Technologies, Inc., marked by bearish trends and shifting trading dynamics.
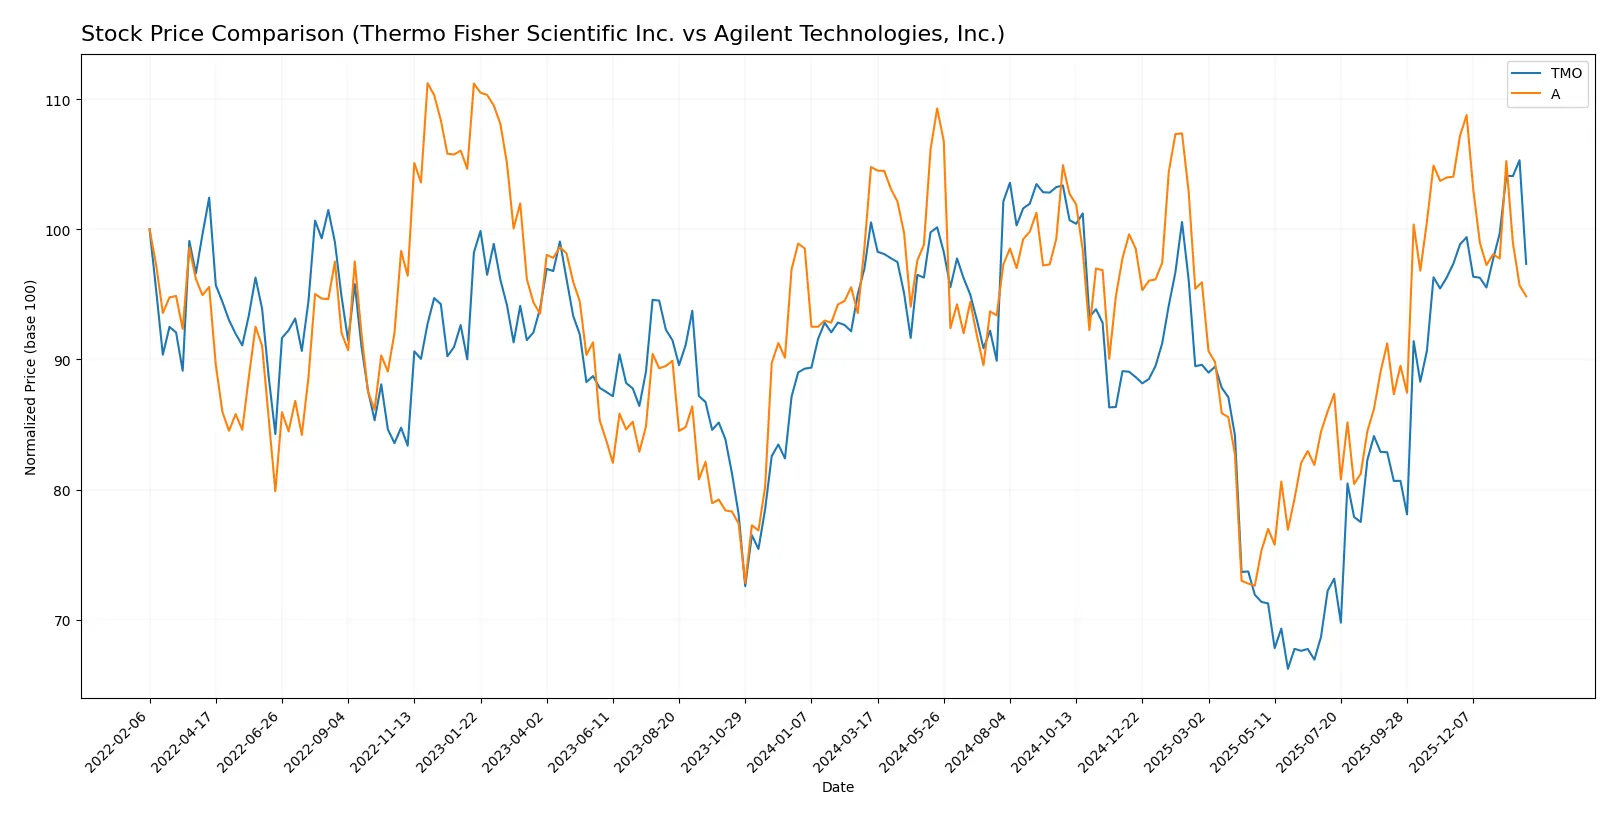
Trend Comparison
Thermo Fisher Scientific Inc. saw a 3.18% price decline over 12 months, signaling a bearish trend with accelerating downward momentum. Its price ranged between 393.66 and 625.98, showing notable volatility.
Agilent Technologies, Inc. experienced a sharper 9.48% drop over the same period, also bearish but with decelerating losses. Its price fluctuated from 102.48 to 154.23, reflecting lower volatility than Thermo Fisher.
Thermo Fisher Scientific outperformed Agilent Technologies in market returns, delivering a smaller price decline and showing signs of trend acceleration versus Agilent’s deceleration.
Target Prices
The consensus among analysts sets optimistic targets for both Thermo Fisher Scientific Inc. and Agilent Technologies, Inc.
| Company | Target Low | Target High | Consensus |
|---|---|---|---|
| Thermo Fisher Scientific Inc. | 561 | 750 | 643.69 |
| Agilent Technologies, Inc. | 130 | 180 | 166.36 |
Analysts expect Thermo Fisher’s stock to appreciate roughly 11% from its current 579 price, reflecting strong sector confidence. Agilent’s target implies a 24% upside, signaling robust growth prospects relative to its 134 price.

Don’t Let Luck Decide Your Entry Point
Optimize your entry points with our advanced ProRealTime indicators. You’ll get efficient buy signals with precise price targets for maximum performance. Start outperforming now!
How do institutions grade them?
The following tables summarize recent institutional grades for Thermo Fisher Scientific Inc. and Agilent Technologies, Inc.:
Thermo Fisher Scientific Inc. Grades
The latest grades from key financial institutions for Thermo Fisher Scientific Inc. are:
| Grading Company | Action | New Grade | Date |
|---|---|---|---|
| Barclays | Maintain | Overweight | 2026-01-30 |
| Citigroup | Maintain | Buy | 2026-01-30 |
| TD Cowen | Maintain | Buy | 2026-01-30 |
| Stifel | Maintain | Buy | 2026-01-09 |
| TD Cowen | Maintain | Buy | 2026-01-07 |
| Wells Fargo | Maintain | Overweight | 2025-12-15 |
| Citigroup | Upgrade | Buy | 2025-12-11 |
| Keybanc | Upgrade | Overweight | 2025-12-08 |
| Morgan Stanley | Maintain | Overweight | 2025-12-02 |
| HSBC | Upgrade | Buy | 2025-12-01 |
Agilent Technologies, Inc. Grades
Recent institutional grades for Agilent Technologies, Inc. are summarized here:
| Grading Company | Action | New Grade | Date |
|---|---|---|---|
| Evercore ISI Group | Upgrade | Outperform | 2026-01-05 |
| Barclays | Upgrade | Overweight | 2025-12-15 |
| Barclays | Maintain | Equal Weight | 2025-11-25 |
| Citigroup | Maintain | Buy | 2025-11-25 |
| UBS | Maintain | Buy | 2025-11-25 |
| B of A Securities | Maintain | Neutral | 2025-11-25 |
| JP Morgan | Maintain | Overweight | 2025-11-25 |
| Wells Fargo | Maintain | Overweight | 2025-11-25 |
| Baird | Maintain | Outperform | 2025-11-25 |
| TD Cowen | Maintain | Buy | 2025-10-14 |
Which company has the best grades?
Thermo Fisher Scientific consistently receives “Buy” and “Overweight” ratings, showing strong institutional confidence. Agilent also holds solid “Buy,” “Overweight,” and “Outperform” ratings but with slightly more variability. Investors may view Thermo Fisher’s uniform grades as a signal of stable analyst conviction.
Risks specific to each company
The following categories identify critical pressure points and systemic threats facing Thermo Fisher Scientific Inc. and Agilent Technologies, Inc. in the 2026 market environment:
1. Market & Competition
Thermo Fisher Scientific Inc.
- Operates in a highly competitive medical diagnostics sector with broad product range, facing pressure from innovation and pricing.
Agilent Technologies, Inc.
- Competes with specialized analytical instruments and diagnostics providers, reliant on technological differentiation to maintain market share.
2. Capital Structure & Debt
Thermo Fisher Scientific Inc.
- Debt-to-equity ratio at 0.74 shows moderate leverage; interest coverage of 5.71 is favorable but signals debt management risk.
Agilent Technologies, Inc.
- Lower debt-to-equity at 0.5 and strong interest coverage of 13.81 reduce financial risk, reflecting a more conservative capital structure.
3. Stock Volatility
Thermo Fisher Scientific Inc.
- Beta of 0.91 implies below-market volatility, offering relative stability amid sector fluctuations.
Agilent Technologies, Inc.
- Beta of 1.29 indicates higher sensitivity to market swings, posing increased risk in volatile environments.
4. Regulatory & Legal
Thermo Fisher Scientific Inc.
- Subject to stringent healthcare and biotech regulations globally, with compliance complexity increasing operational risk.
Agilent Technologies, Inc.
- Faces regulatory scrutiny in chemical and diagnostic markets; evolving compliance demands could impact costs and operations.
5. Supply Chain & Operations
Thermo Fisher Scientific Inc.
- Complex global supply chain exposes firm to disruption risks, but broad geographic footprint aids resilience.
Agilent Technologies, Inc.
- More focused supply chain in analytical instruments risks concentration but benefits from streamlined operations.
6. ESG & Climate Transition
Thermo Fisher Scientific Inc.
- Increasing pressure to meet ESG goals; large operational footprint challenges rapid climate transition adaptation.
Agilent Technologies, Inc.
- ESG commitments are growing; smaller scale may facilitate faster adaptation to sustainability requirements.
7. Geopolitical Exposure
Thermo Fisher Scientific Inc.
- Global operations expose it to geopolitical tensions and trade uncertainties, especially in Asia-Pacific markets.
Agilent Technologies, Inc.
- Also exposed to geopolitical risks but with somewhat lower global scale, limiting impact scope.
Which company shows a better risk-adjusted profile?
Agilent Technologies, Inc. faces lower financial leverage and exhibits higher profitability ratios, though with greater stock volatility. Thermo Fisher has a more diversified product base and lower beta, but higher debt levels and operational complexity. The most impactful risk for Thermo Fisher is its moderate debt burden amid a complex global supply chain. For Agilent, elevated stock volatility combined with regulatory demands stands out. Overall, Agilent shows a better risk-adjusted profile supported by stronger capital structure metrics and financial performance trends in 2025.
Final Verdict: Which stock to choose?
Thermo Fisher Scientific’s superpower lies in its unmatched operational scale and consistent cash flow generation, making it a reliable cash machine. However, its declining ROIC trend signals a point of vigilance for value creation over time. It fits well within aggressive growth portfolios seeking exposure to industrial science leadership.
Agilent Technologies commands a strategic moat through its high returns on capital and stronger balance sheet, delivering value creation despite a slight dip in profitability. Its safety profile surpasses Thermo Fisher’s, appealing to risk-conscious investors. This stock suits GARP (Growth at a Reasonable Price) portfolios aiming for quality growth with financial discipline.
If you prioritize robust value creation and financial safety, Agilent outshines due to its efficient capital use and lower leverage. However, if your focus is on scale and cash flow dominance despite some profitability erosion, Thermo Fisher offers compelling exposure. Both require careful monitoring of their profitability trends amid a challenging macro environment.
Disclaimer: Investment carries a risk of loss of initial capital. The past performance is not a reliable indicator of future results. Be sure to understand risks before making an investment decision.
Go Further
I encourage you to read the complete analyses of Thermo Fisher Scientific Inc. and Agilent Technologies, Inc. to enhance your investment decisions: