Home > Comparison > Healthcare > A vs RVTY
The strategic rivalry between Agilent Technologies, Inc. and Revvity, Inc. shapes the future of the healthcare diagnostics and research sector. Agilent operates as a broad-based, technology-driven solutions provider with a heavy emphasis on laboratory instrumentation and software. Revvity focuses on integrated diagnostics and applied services, blending research tools with clinical applications. This analysis aims to identify which company presents a superior risk-adjusted growth trajectory for a diversified portfolio in this competitive landscape.

Table of contents
Companies Overview
Agilent Technologies and Revvity stand as pivotal players in the medical diagnostics and research industry.
Agilent Technologies, Inc.: Precision Solutions for Life Sciences and Diagnostics
Agilent dominates the life sciences and applied chemical markets with advanced instrumentation and software. Its revenue stems from liquid chromatography, mass spectrometry, and genomics tools. In 2026, Agilent focuses on expanding its CrossLab services, enhancing customer support and operational efficiency across global laboratories.
Revvity, Inc.: Innovating Diagnostics and Analytical Solutions
Revvity specializes in diagnostics and discovery solutions for life sciences and applied services. Its core revenue comes from instruments, reagents, and software facilitating genetic disorder detection and environmental analysis. In 2026, Revvity drives growth by advancing genomic workflows and expanding its presence in oncology and immunodiagnostics markets.
Strategic Collision: Similarities & Divergences
Both companies advance complex diagnostic technologies but diverge in business scope—Agilent emphasizes a comprehensive instrument-service integration, while Revvity prioritizes genomics and environmental analytics. Their primary battleground is the evolving life sciences research market. Investors will find Agilent offers a broader service ecosystem, whereas Revvity presents a focused, innovation-driven growth profile.
Income Statement Comparison
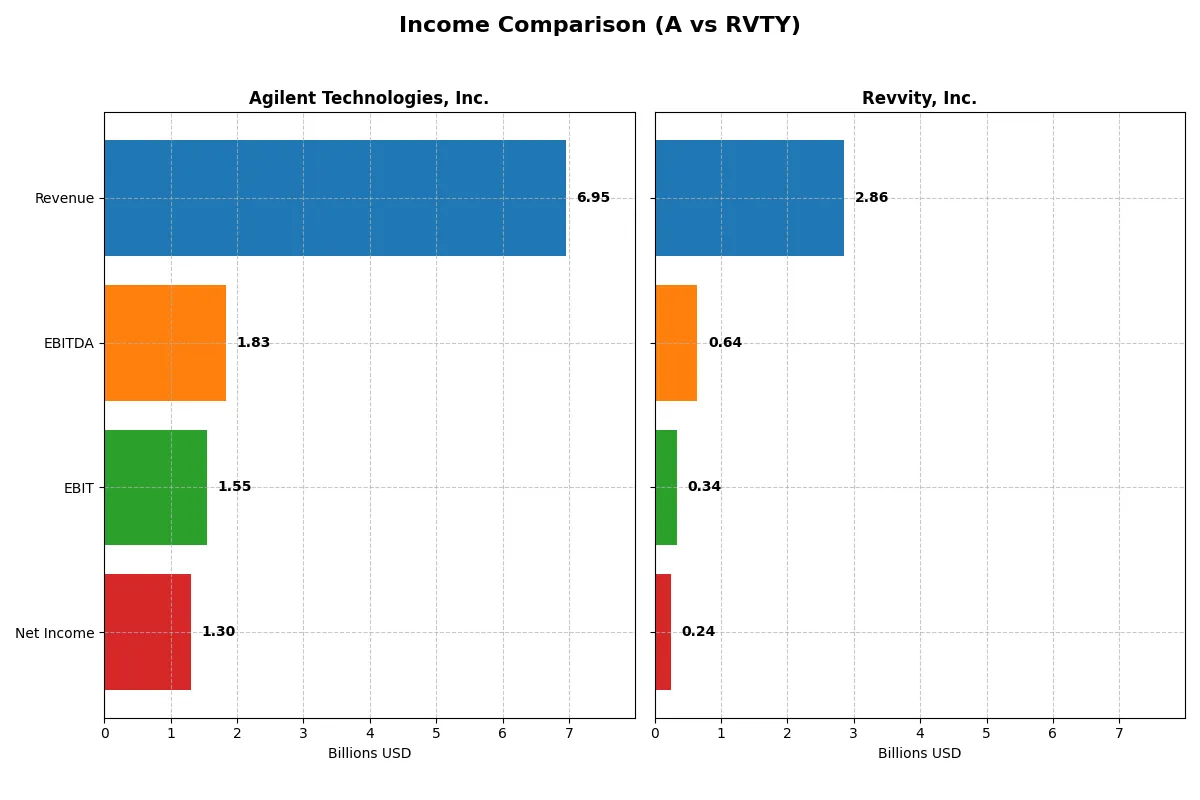
This data dissects the core profitability and scalability of both corporate engines to reveal who dominates the bottom line:
| Metric | Agilent Technologies, Inc. (A) | Revvity, Inc. (RVTY) |
|---|---|---|
| Revenue | 6.95B | 2.86B |
| Cost of Revenue | 3.31B | 1.34B |
| Operating Expenses | 2.16B | 1.16B |
| Gross Profit | 3.64B | 1.52B |
| EBITDA | 1.83B | 644M |
| EBIT | 1.55B | 341M |
| Interest Expense | 112M | 92M |
| Net Income | 1.30B | 242M |
| EPS | 4.59 | 2.08 |
| Fiscal Year | 2025 | 2025 |
Income Statement Analysis: The Bottom-Line Duel
This income statement comparison reveals which company converts revenue into profit most efficiently in the current market environment.
Agilent Technologies, Inc. Analysis
Agilent’s revenue rose steadily from 6.32B in 2021 to 6.95B in 2025, supporting a net income climb to 1.3B. Gross margins hold strong around 52%, while net margins remain healthy near 19%. Despite a slight EBIT dip in 2025, the company maintains momentum with improving EPS growth and overall favorable margin profiles.
Revvity, Inc. Analysis
Revvity’s revenue declined from 3.83B in 2021 to 2.86B in 2025, with net income dropping sharply to 242M. Gross margin around 53% stays solid, but net margin fell to 8.5%, signaling weak profitability. The latest year shows operational pressure with a 17% EBIT fall and negative EPS growth, reflecting challenges in sustaining growth and efficiency.
Margin Strength vs. Revenue Resilience
Agilent dominates with higher revenue scale and consistent profitability, showing resilience through modest margin contractions. Revvity struggles with declining revenues and profitability despite stable gross margins. For investors, Agilent’s profile offers greater fundamental stability and growth potential, while Revvity reflects higher risk and operational headwinds.
Financial Ratios Comparison
These vital ratios act as a diagnostic tool to expose the underlying fiscal health, valuation premiums, and capital efficiency of the companies compared below:
| Ratios | Agilent Technologies, Inc. (A) | Revvity, Inc. (RVTY) |
|---|---|---|
| ROE | 19.3% | 3.3% |
| ROIC | 12.6% | 2.8% |
| P/E | 31.8 | 45.3 |
| P/B | 6.14 | 1.51 |
| Current Ratio | 1.96 | 1.68 |
| Quick Ratio | 1.52 | 1.40 |
| D/E | 0.50 | 0.46 |
| Debt-to-Assets | 26.4% | 27.7% |
| Interest Coverage | 13.2 | 3.9 |
| Asset Turnover | 0.55 | 0.23 |
| Fixed Asset Turnover | 3.43 | 4.43 |
| Payout Ratio | 21.6% | 13.6% |
| Dividend Yield | 0.68% | 0.30% |
| Fiscal Year | 2025 | 2025 |
Efficiency & Valuation Duel: The Vital Signs
Financial ratios act as the company’s DNA, revealing hidden risks and operational excellence that influence investment decisions clearly and succinctly.
Agilent Technologies, Inc.
Agilent displays strong profitability with a 19.33% ROE and robust margins, signaling operational efficiency. However, its valuation appears stretched, with a P/E of 31.79 and P/B of 6.14, both unfavorable. The company returns value modestly via a 0.68% dividend yield, prioritizing stable growth and R&D reinvestment.
Revvity, Inc.
Revvity posts weaker profitability, with a 3.33% ROE and neutral net margin, reflecting operational challenges. Its valuation is high with a P/E of 45.32, indicating an expensive stock. Dividend yield is low at 0.3%, and the firm focuses on growth investments over shareholder payouts, highlighting reinvestment in innovation.
Premium Valuation vs. Operational Resilience
Agilent offers a better balance of risk and reward through favorable profitability and solid capital structure despite a stretched valuation. Revvity’s high valuation and weaker returns elevate risk. Investors seeking operational strength may prefer Agilent, while those targeting growth exposure might consider Revvity’s profile.
Which one offers the Superior Shareholder Reward?
I see Agilent Technologies, Inc. (A) offers a more balanced and sustainable shareholder reward model compared to Revvity, Inc. (RVTY). Agilent yields around 0.7% with a consistent payout ratio near 21%, backed by robust free cash flow coverage (2.26x dividend plus capex). Its steady buyback activity complements dividends, enhancing total shareholder return. Conversely, Revvity pays a lower yield (~0.3%) with a smaller payout ratio (~13%), relying more on reinvestment amid weaker profitability and thinner free cash flow coverage. Its buyback program is less pronounced and riskier given debt leverage and volatile margins. Historically, I’ve observed that Agilent’s disciplined distribution and strong cash flow resilience align better with long-term value creation. Thus, in 2026, I favor Agilent for superior total return potential.
Comparative Score Analysis: The Strategic Profile
The radar chart reveals the fundamental DNA and trade-offs of Agilent Technologies and Revvity, highlighting their contrasting financial strengths and valuation profiles:
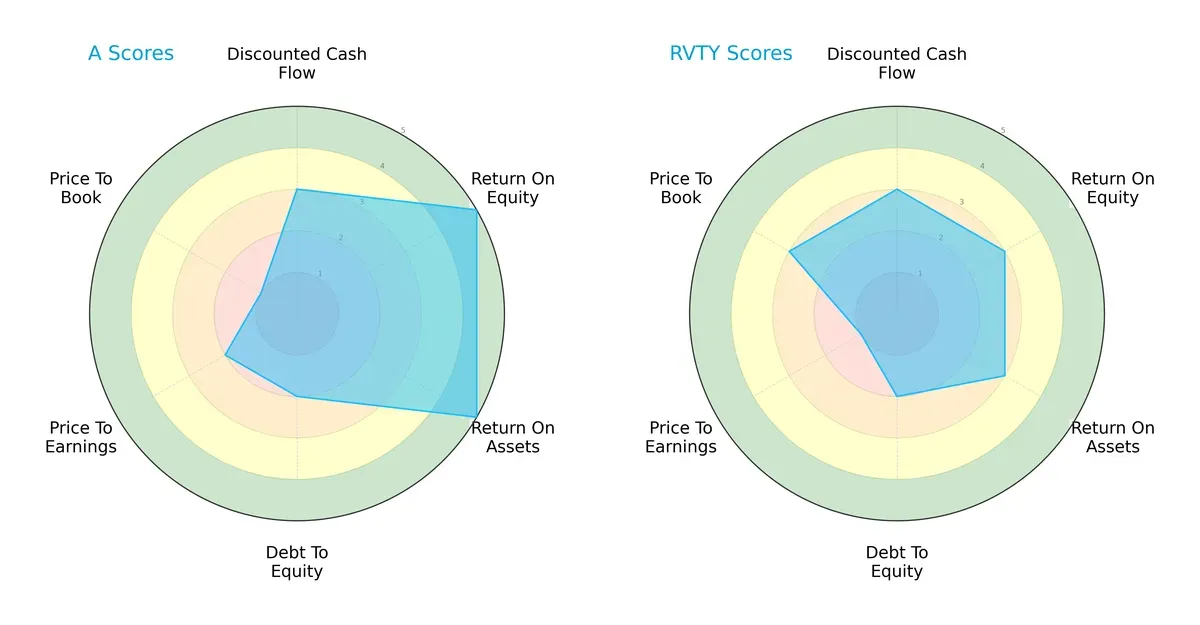
Agilent leads with superior profitability metrics, scoring 5 in ROE and ROA, reflecting efficient capital and asset use. Revvity posts moderate scores of 3 in both categories, indicating less operational efficiency. Both share moderate DCF scores (3) and weak debt management (2), signaling elevated leverage concerns. Valuation scores diverge sharply: Agilent’s P/E (2) and P/B (1) suggest expensive pricing, while Revvity’s cheaper P/E (1) and fair P/B (3) imply relative undervaluation. Agilent offers a focused strength in profitability, but Revvity presents a more balanced risk-return valuation setup.
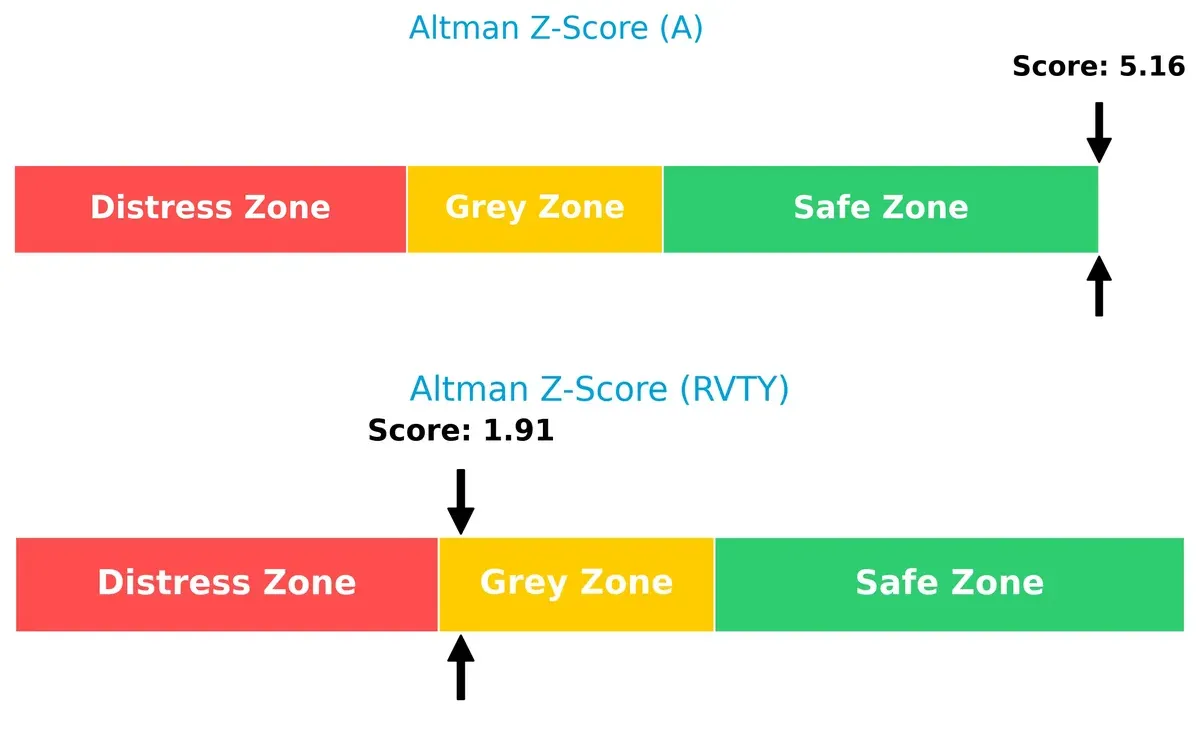
Bankruptcy Risk: Solvency Showdown
Agilent’s Altman Z-Score of 5.16 places it firmly in the safe zone, while Revvity’s 1.91 signals caution in the grey zone, implying higher bankruptcy risk under stress:
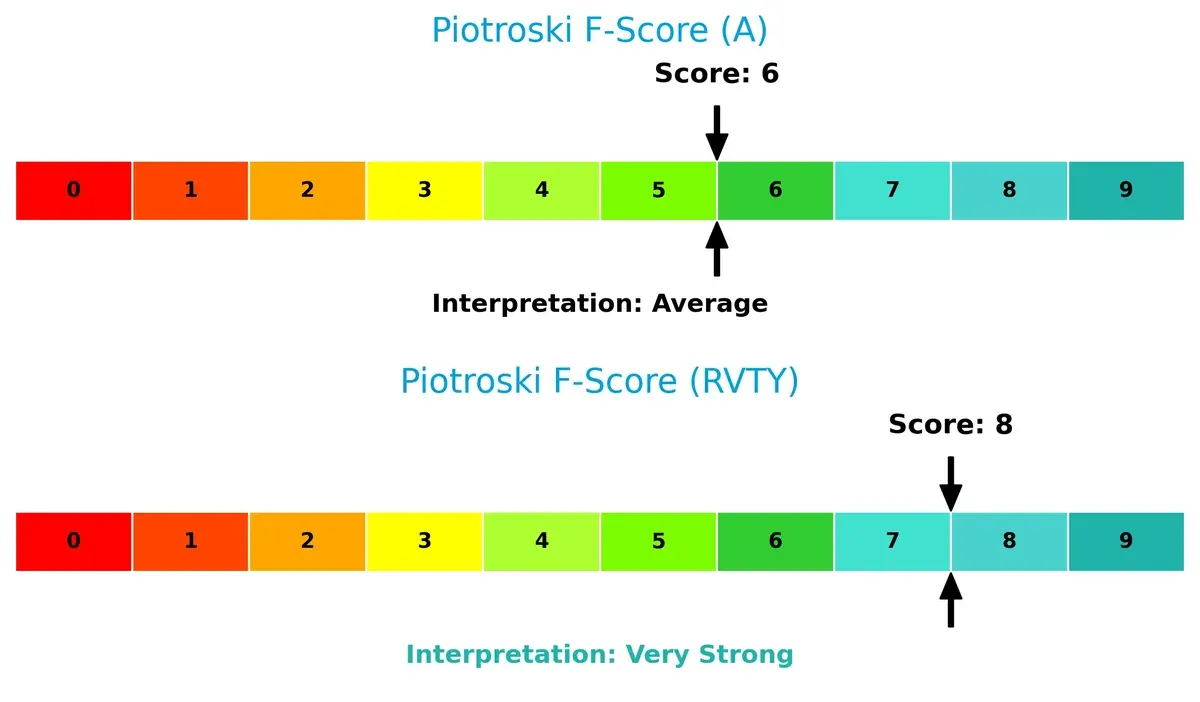
Financial Health: Quality of Operations
Revvity’s Piotroski F-Score of 8 indicates very strong financial health, outperforming Agilent’s average score of 6, which suggests potential internal red flags:
How are the two companies positioned?
This section dissects the operational DNA of Agilent and Revvity by comparing revenue distribution and internal dynamics. Its goal is to confront their economic moats to reveal which model offers the most resilient competitive advantage today.
Revenue Segmentation: The Strategic Mix
This comparison dissects how Agilent Technologies and Revvity diversify income streams and reveals their primary sector bets:
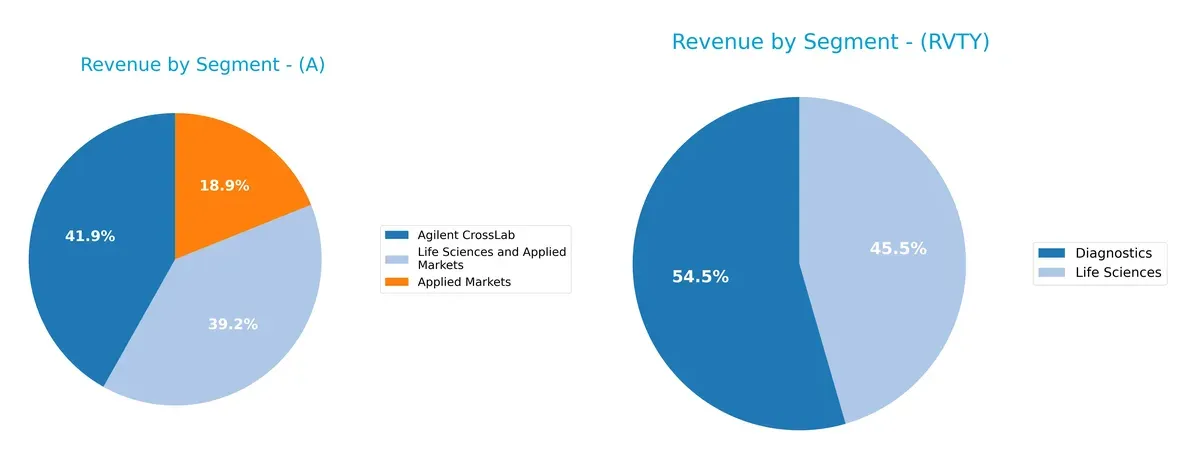
Agilent’s 2025 revenue shows a three-pronged mix: $2.9B in CrossLab, $2.7B in Life Sciences and Applied Markets, and $1.3B in Applied Markets. Revvity leans heavily on two segments, Diagnostics ($1.5B) and Life Sciences ($1.25B). Agilent’s broader base reduces concentration risk, while Revvity’s focus suggests strategic depth but higher exposure to sector-specific cycles. Agilent pivots on ecosystem lock-in; Revvity anchors on diagnostics strength.
Strengths and Weaknesses Comparison
This table compares the Strengths and Weaknesses of Agilent Technologies, Inc. and Revvity, Inc.:
Agilent Technologies Strengths
- Diverse revenue streams including CrossLab and Life Sciences
- Strong profitability with 18.75% net margin, 19.33% ROE
- Favorable liquidity and leverage ratios
- Solid global presence across Americas, Asia Pacific, Europe
Revvity Strengths
- Focused product segments in Diagnostics and Life Sciences
- Favorable WACC at 7.43% indicating efficient capital cost
- Adequate liquidity ratios
- Geographic diversification with significant international sales
Agilent Technologies Weaknesses
- High P/E and P/B ratios suggest overvaluation risk
- Dividend yield is low at 0.68%
- Moderate asset turnover indicates potential inefficiency
Revvity Weaknesses
- Low profitability with 3.33% ROE and 2.82% ROIC
- Higher P/E ratio at 45.32 signals valuation concerns
- Lower asset turnover at 0.23 reflects operational weakness
- Interest coverage ratio at 3.7 is only moderate
Agilent demonstrates comprehensive strengths in profitability and global diversification, but faces valuation concerns. Revvity shows more limited profitability and operational efficiency, though it benefits from a lower cost of capital and geographic reach. Both companies present distinct strategic challenges in balancing growth and financial discipline.
The Moat Duel: Analyzing Competitive Defensibility
A structural moat shields long-term profits from relentless competitive erosion. Without it, market share and margins quickly erode:
Agilent Technologies, Inc.: Intangible Assets and Broad Product Ecosystem
Agilent’s moat stems from its extensive product portfolio and specialized application solutions. It sustains margins above 18%, reflecting strong ROIC over WACC. In 2026, expanding diagnostics software deepens this intangible asset moat.
Revvity, Inc.: Specialized Instrumentation with Narrower Market Focus
Revvity relies on niche analytical instruments and diagnostics but lacks Agilent’s breadth. Its negative ROIC trend signals value destruction. Future growth hinges on successful innovation in genomics workflows to stabilize margins.
Verdict: Intangible Assets vs. Niche Instrumentation – Moat Breadth Wins
Agilent’s wider ecosystem and steady value creation deliver a deeper moat than Revvity’s shrinking returns. Agilent is better equipped to defend and expand market share in evolving diagnostics and life sciences.
Which stock offers better returns?
The past year shows distinct price movements for both stocks, with Agilent Technologies experiencing a marked decline and Revvity displaying a milder downturn coupled with recent recovery signs.
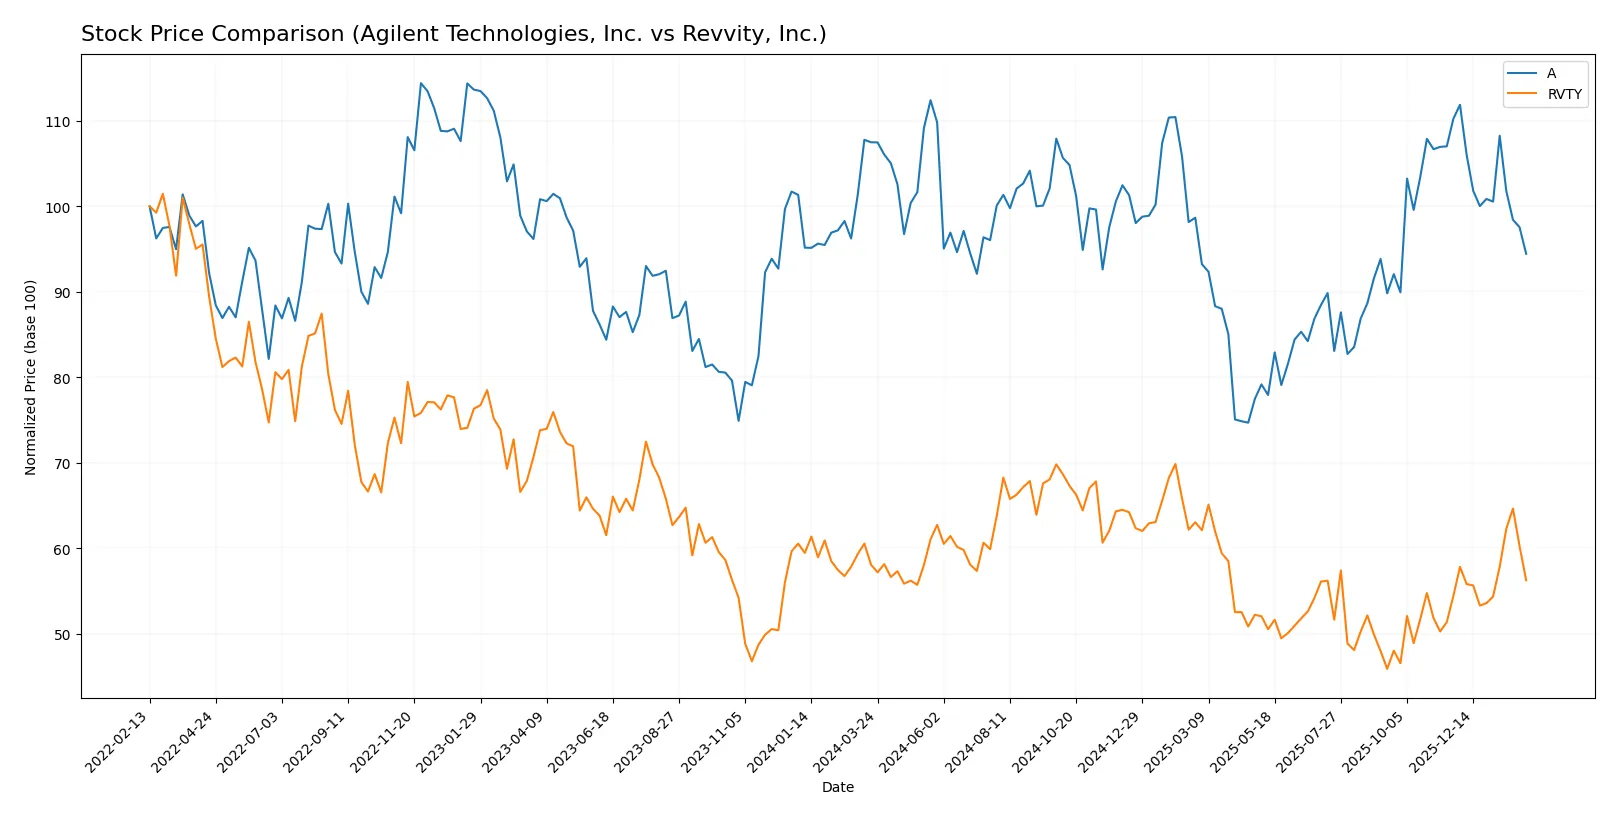
Trend Comparison
Agilent Technologies’ stock fell 12.14% over the past year, confirming a bearish trend with decelerating losses and a high volatility standard deviation of 12.76. The price ranged between 154.23 and 102.48.
Revvity’s stock declined 3.16% overall, also bearish but with accelerating momentum. Recent months reveal a 3.38% price increase and a lower volatility of 11.37, indicating a possible trend reversal.
Comparing both, Agilent Technologies suffered a steeper decline while Revvity posted a smaller loss with recent gains. Revvity thus delivered the higher market performance over the analyzed period.
Target Prices
Analysts show a positive outlook with clear upside potential for both Agilent Technologies and Revvity, Inc.
| Company | Target Low | Target High | Consensus |
|---|---|---|---|
| Agilent Technologies, Inc. | 130 | 180 | 166.36 |
| Revvity, Inc. | 105 | 129 | 115.14 |
The consensus target prices for Agilent and Revvity exceed current prices by 28% and 13%, respectively, signaling analyst confidence in growth potential.

Don’t Let Luck Decide Your Entry Point
Optimize your entry points with our advanced ProRealTime indicators. You’ll get efficient buy signals with precise price targets for maximum performance. Start outperforming now!
How do institutions grade them?
The following tables summarize the recent grades assigned by reputable financial institutions for both companies:
Agilent Technologies, Inc. Grades
This table shows the latest official grades from recognized financial analysts for Agilent Technologies:
| Grading Company | Action | New Grade | Date |
|---|---|---|---|
| Evercore ISI Group | Upgrade | Outperform | 2026-01-05 |
| Barclays | Upgrade | Overweight | 2025-12-15 |
| Wells Fargo | Maintain | Overweight | 2025-11-25 |
| UBS | Maintain | Buy | 2025-11-25 |
| JP Morgan | Maintain | Overweight | 2025-11-25 |
| Baird | Maintain | Outperform | 2025-11-25 |
| Citigroup | Maintain | Buy | 2025-11-25 |
| Barclays | Maintain | Equal Weight | 2025-11-25 |
| B of A Securities | Maintain | Neutral | 2025-11-25 |
| TD Cowen | Maintain | Buy | 2025-10-14 |
Revvity, Inc. Grades
This table shows the latest official grades from recognized financial analysts for Revvity:
| Grading Company | Action | New Grade | Date |
|---|---|---|---|
| Evercore ISI Group | Maintain | Outperform | 2026-02-03 |
| Jefferies | Maintain | Hold | 2026-02-03 |
| Wells Fargo | Maintain | Equal Weight | 2026-02-03 |
| TD Cowen | Maintain | Buy | 2026-02-03 |
| Barclays | Maintain | Overweight | 2026-02-03 |
| JP Morgan | Maintain | Neutral | 2026-02-03 |
| Wells Fargo | Maintain | Equal Weight | 2025-12-15 |
| Barclays | Maintain | Overweight | 2025-12-15 |
| Barclays | Maintain | Overweight | 2025-10-28 |
| Baird | Maintain | Outperform | 2025-10-28 |
Which company has the best grades?
Agilent Technologies consistently receives more positive and upgraded ratings, including multiple “Buy,” “Overweight,” and “Outperform” grades. Revvity’s ratings are stable but include neutral and hold positions. Investors may view Agilent’s stronger grade profile as a sign of greater analyst confidence.
Risks specific to each company
The following categories identify the critical pressure points and systemic threats facing both firms in the 2026 market environment:
1. Market & Competition
Agilent Technologies, Inc.
- Strong market position with favorable margins but faces high P/E and P/B valuation risks.
Revvity, Inc.
- Smaller market cap and weaker profitability, pressured by high P/E and lower asset efficiency.
2. Capital Structure & Debt
Agilent Technologies, Inc.
- Solid debt management with low debt-to-equity and strong interest coverage ratios.
Revvity, Inc.
- Comparable debt levels but weaker interest coverage, signaling tighter financial flexibility.
3. Stock Volatility
Agilent Technologies, Inc.
- Beta of 1.30 indicates above-market volatility; price range shows moderate swings.
Revvity, Inc.
- Lower beta at 1.09 suggests less volatility, but still sensitive to market shifts.
4. Regulatory & Legal
Agilent Technologies, Inc.
- Operates in heavily regulated healthcare diagnostics, with compliance risk managed historically well.
Revvity, Inc.
- Similar regulatory environment but potentially more exposed due to smaller scale and evolving product lines.
5. Supply Chain & Operations
Agilent Technologies, Inc.
- Extensive global supply chain with operational scale advantage; moderate asset turnover signals room for efficiency.
Revvity, Inc.
- Smaller scale and low asset turnover point to operational challenges and supply chain vulnerability.
6. ESG & Climate Transition
Agilent Technologies, Inc.
- Increasing focus on sustainable sourcing and energy-efficient products aligns with sector trends.
Revvity, Inc.
- ESG initiatives less mature; risk of lagging peers on climate transition and stakeholder expectations.
7. Geopolitical Exposure
Agilent Technologies, Inc.
- Global footprint with US base; geopolitical tensions could impact international sales and supply.
Revvity, Inc.
- Similar exposure but less diversified, increasing sensitivity to regional disruptions.
Which company shows a better risk-adjusted profile?
Agilent’s dominant market position and strong capital structure provide a more favorable risk-adjusted profile than Revvity’s. Revvity’s weaker profitability and operational efficiency elevate its risk, despite a slightly lower stock volatility. Agilent’s Altman Z-score in the safe zone contrasts with Revvity’s grey zone, signaling better financial stability. The most impactful risk for Agilent lies in its elevated valuation metrics, which may limit upside during market corrections. Revvity’s biggest concern is its low return on invested capital, which hampers sustainable growth. Recent data show Agilent’s consistent interest coverage of 13.8x versus Revvity’s weaker 3.7x, underscoring financial robustness differences.
Final Verdict: Which stock to choose?
Agilent Technologies, Inc. wields unmatched operational efficiency and consistently creates value above its cost of capital. Its slight decline in profitability signals a point of vigilance but doesn’t overshadow its robust financial health. This stock fits well in portfolios seeking steady, slightly conservative growth with a quality edge.
Revvity, Inc. offers a strategic moat rooted in its niche biotech positioning and intangible assets, presenting growth potential through innovation. However, its value destruction and volatile cash flows suggest higher risk. It suits investors with a tolerance for instability looking to capitalize on a potential turnaround or speculative growth.
If you prioritize durable value creation and operational strength, Agilent outshines as the compelling choice due to its superior returns on capital and financial stability. However, if you seek speculative growth with a higher risk appetite, Revvity offers a path to capture innovation-driven upside despite its current challenges.
Disclaimer: Investment carries a risk of loss of initial capital. The past performance is not a reliable indicator of future results. Be sure to understand risks before making an investment decision.
Go Further
I encourage you to read the complete analyses of Agilent Technologies, Inc. and Revvity, Inc. to enhance your investment decisions: