Investors seeking opportunities in the healthcare diagnostics sector often consider Agilent Technologies, Inc. (A) and Quest Diagnostics Incorporated (DGX), two industry leaders with distinct yet overlapping market focuses. Agilent excels in advanced laboratory instruments and genomic solutions, while Quest specializes in diagnostic testing and patient services. This comparison explores their innovation strategies and market positions to help you identify the most compelling investment option for your portfolio.
Table of contents
Companies Overview
I will begin the comparison between Agilent Technologies, Inc. and Quest Diagnostics Incorporated by providing an overview of these two companies and their main differences.
Agilent Technologies Overview
Agilent Technologies, Inc. focuses on providing application-driven solutions to life sciences, diagnostics, and applied chemical markets globally. The company operates in three segments, offering advanced instruments, consumables, software, and services that support chemical analysis, genomics, and laboratory automation. Headquartered in Santa Clara, California, Agilent holds a strong position in medical diagnostics and research industries.
Quest Diagnostics Overview
Quest Diagnostics Incorporated delivers diagnostic testing, information, and services mainly within the United States and internationally. It offers routine and advanced clinical testing, anatomic pathology, and IT solutions under several brands, serving patients, clinicians, hospitals, and health plans. Founded in 1967 and based in Secaucus, New Jersey, Quest is a major player in diagnostic information services with a broad network of laboratories and patient service centers.
Key similarities and differences
Both companies operate within the medical diagnostics and research industry, providing critical testing and analysis services. Agilent leans more toward supplying laboratory instruments and consumables with an emphasis on life sciences and applied markets, while Quest specializes in delivering diagnostic testing services and related information technology. Their business models differ in focus, with Agilent targeting product innovation and Quest focusing on service delivery and clinical testing networks.
Income Statement Comparison
The table below presents a side-by-side comparison of key income statement metrics for Agilent Technologies, Inc. and Quest Diagnostics Incorporated for their most recent fiscal years.
| Metric | Agilent Technologies, Inc. | Quest Diagnostics Incorporated |
|---|---|---|
| Market Cap | 42.1B | 19.5B |
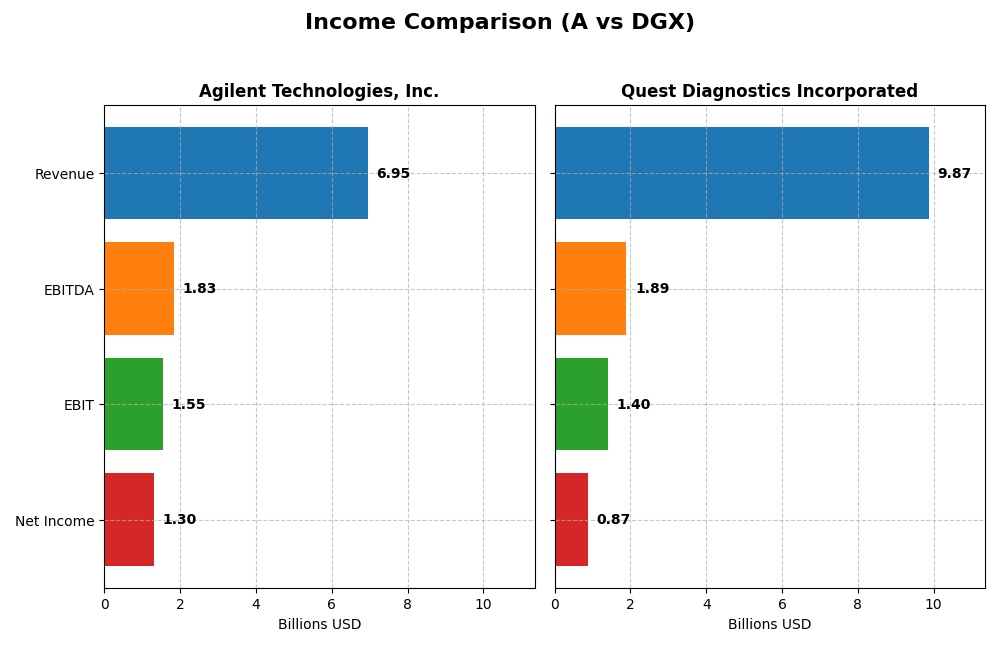
| Revenue | 6.95B | 9.87B |
| EBITDA | 1.84B | 1.89B |
| EBIT | 1.55B | 1.40B |
| Net Income | 1.30B | 0.87B |
| EPS | 4.59 | 7.80 |
| Fiscal Year | 2025 | 2024 |
Income Statement Interpretations
Agilent Technologies, Inc.
Agilent’s revenue grew steadily from 2021 to 2025, reaching $6.95B in 2025, with net income increasing to $1.30B. Gross and net margins showed slight fluctuations but remained strong, with a 52.43% gross margin and 18.75% net margin in 2025. The latest year saw moderate revenue growth of 6.73%, while EBIT declined 4.33%, indicating some margin pressure.
Quest Diagnostics Incorporated
Quest Diagnostics experienced mostly stable revenue around $9.87B in 2024, with net income dropping to $866M. Gross margin was lower than Agilent’s at 32.86%, and net margin stood at 8.82%. The latest year showed a 6.7% revenue increase and an 8.35% EBIT growth, but net margin contracted 4.41%, reflecting mixed profitability trends.
Which one has the stronger fundamentals?
Agilent demonstrates stronger fundamentals with higher margins and consistent net income growth over five years, despite a slight recent EBIT decline. Quest Diagnostics shows favorable revenue and EBIT growth in the latest year but has faced net income and margin declines overall. Both companies have favorable income statement evaluations, though Agilent’s metrics suggest a more robust profitability profile.
Financial Ratios Comparison
The table below presents the most recent available financial ratios for Agilent Technologies, Inc. and Quest Diagnostics Incorporated, reflecting their fiscal year 2025 and 2024 data respectively.
| Ratios | Agilent Technologies, Inc. (2025) | Quest Diagnostics Incorporated (2024) |
|---|---|---|
| ROE | 19.3% | 12.9% |
| ROIC | 12.6% | 7.0% |
| P/E | 31.8 | 19.2 |
| P/B | 6.1 | 2.5 |
| Current Ratio | 1.96 | 1.10 |
| Quick Ratio | 1.52 | 1.02 |
| D/E (Debt to Equity) | 0.50 | 1.05 |
| Debt-to-Assets | 26.4% | 43.9% |
| Interest Coverage | 13.2 | 6.0 |
| Asset Turnover | 0.55 | 0.61 |
| Fixed Asset Turnover | 3.43 | 3.57 |
| Payout Ratio | 21.6% | 38.0% |
| Dividend Yield | 0.68% | 1.98% |
Interpretation of the Ratios
Agilent Technologies, Inc.
Agilent shows mostly favorable ratios, with strong net margin (18.75%) and return on equity (19.33%), indicating efficient profitability and capital use. Its current and quick ratios reflect good liquidity, while debt metrics are solid. However, valuation multiples like P/E (31.79) and P/B (6.14) are high, posing potential overvaluation concerns. Dividend yield is low at 0.68%, reflecting modest shareholder returns.
Quest Diagnostics Incorporated
Quest Diagnostics presents a mixed profile with neutral profitability ratios: net margin at 8.82% and ROE at 12.85%. Liquidity ratios are moderate, though debt levels are higher (D/E of 1.05) than Agilent’s, which may increase financial risk. Its dividend yield of 1.98% is higher, suggesting better income for shareholders, supported by reasonable interest coverage and asset turnover ratios.
Which one has the best ratios?
Agilent Technologies holds a more favorable overall ratio profile, with stronger profitability, solid liquidity, and lower leverage, despite concerns on valuation multiples and dividend yield. Quest Diagnostics’ ratios are more neutral, with somewhat higher financial risk due to leverage, though its dividend yield is comparatively more attractive. The choice depends on investor priorities between growth and income stability.
Strategic Positioning
This section compares the strategic positioning of Agilent Technologies, Inc. (A) and Quest Diagnostics Incorporated (DGX), including market position, key segments, and exposure to technological disruption:
Agilent Technologies, Inc. (A)
- Market Cap $42B; faces competitive pressure in medical diagnostics and research markets.
- Diverse segments: Life Sciences, Applied Markets, Diagnostics, CrossLab services driving revenue.
- Exposure through advanced life sciences technologies and laboratory automation solutions.
Quest Diagnostics Incorporated (DGX)
- Market Cap $19B; operates in clinical diagnostics with moderate competitive pressure.
- Concentrated in diagnostic information services, clinical and advanced testing segments.
- Focused on diagnostic testing innovation but less diversified in technology applications.
Agilent Technologies, Inc. vs Quest Diagnostics Incorporated Positioning
Agilent shows a diversified business model across multiple diagnostic and applied markets segments, offering broader exposure to technology-driven growth. Quest Diagnostics is more concentrated in diagnostic testing services, which may limit diversification but focuses on core testing capabilities.
Which has the best competitive advantage?
Agilent holds a slightly favorable moat with positive value creation despite declining profitability, indicating more efficient capital use. Quest Diagnostics has a slightly unfavorable moat with value shedding and a sharper decline in profitability, reflecting weaker competitive advantage.
Stock Comparison
The stock price movements over the past year reveal distinct bullish trends for both Agilent Technologies, Inc. and Quest Diagnostics Incorporated, with notable deceleration in momentum and varying recent trading dynamics.
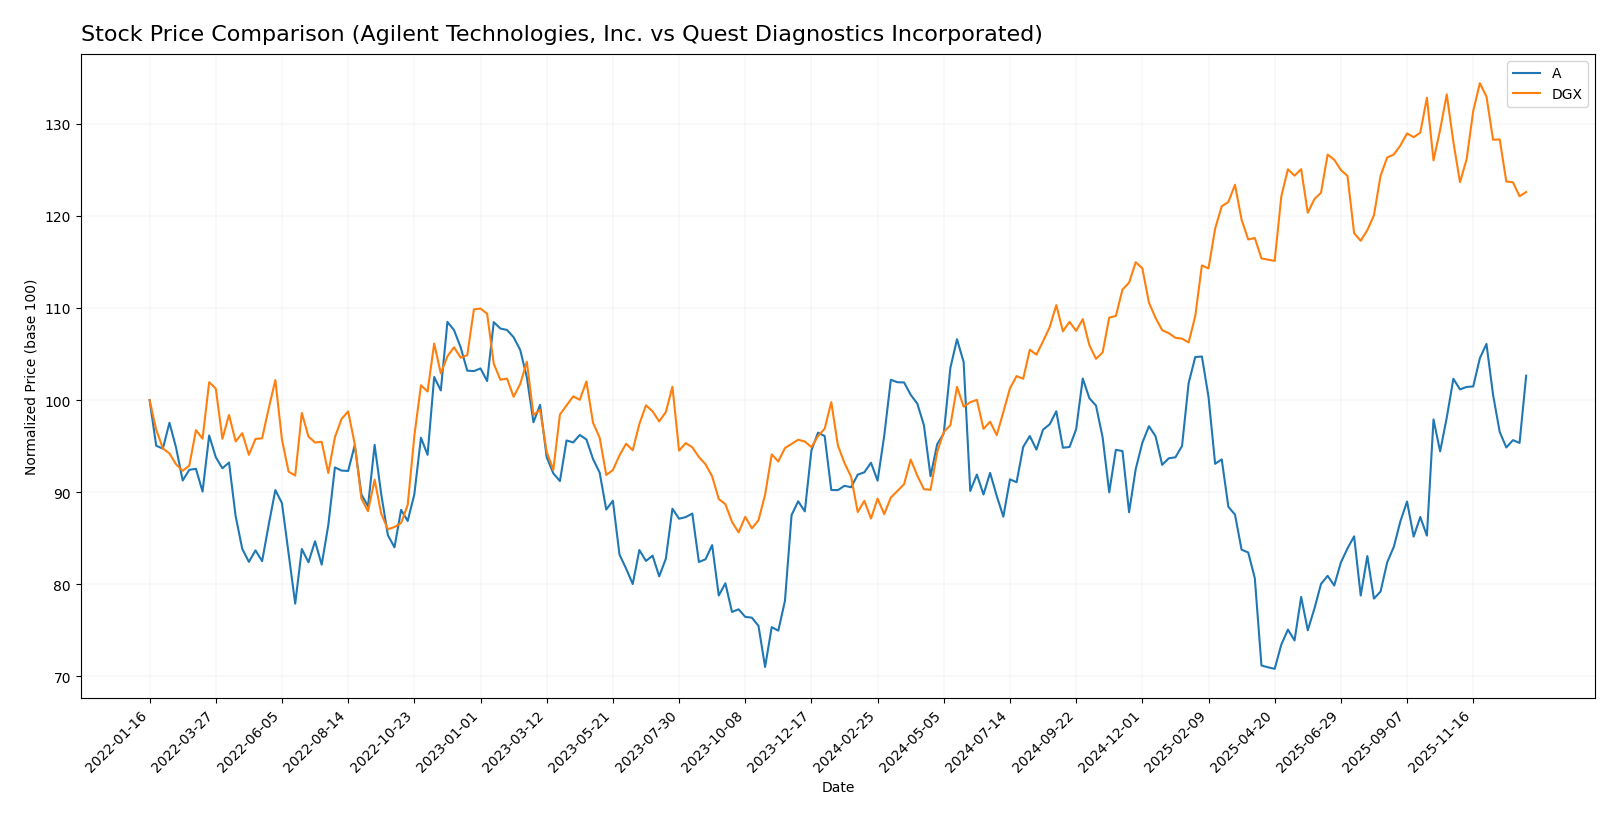
Trend Analysis
Agilent Technologies, Inc. recorded a 10.15% price increase over the past 12 months, indicating a bullish trend with decelerating momentum. The stock ranged between $102.48 and $154.23, showing moderate volatility (std dev 12.84).
Quest Diagnostics Incorporated showed a stronger 40.68% price rise over the same period, also bullish but with deceleration. The price fluctuated from $124.00 to $191.25, exhibiting higher volatility (std dev 18.03).
Comparatively, Quest Diagnostics delivered the highest market performance over the last year, outperforming Agilent Technologies in total price appreciation despite recent short-term declines.
Target Prices
Analysts show a positive outlook with clear target price ranges for both companies.
| Company | Target High | Target Low | Consensus |
|---|---|---|---|
| Agilent Technologies, Inc. | 180 | 130 | 165 |
| Quest Diagnostics Incorporated | 215 | 190 | 201.6 |
The consensus targets for Agilent and Quest Diagnostics exceed their current stock prices at $148.52 and $174.44 respectively, indicating expected upside potential according to analyst forecasts.
Analyst Opinions Comparison
This section compares analysts’ ratings and grades for Agilent Technologies, Inc. (A) and Quest Diagnostics Incorporated (DGX):
Rating Comparison
A Rating
- Rating: B+, indicating a very favorable overall assessment.
- Discounted Cash Flow Score: 4, signaling a favorable valuation outlook.
- ROE Score: 5, reflecting very favorable profit generation from equity.
- ROA Score: 5, indicating very efficient asset utilization.
- Debt To Equity Score: 2, showing moderate financial risk.
- Overall Score: 3, a moderate overall financial standing.
DGX Rating
- Rating: B, also very favorable but one notch below A’s rating.
- Discounted Cash Flow Score: 4, similarly favorable valuation indication.
- ROE Score: 4, favorable but less strong than A’s score.
- ROA Score: 4, favorable asset usage but below A’s top score.
- Debt To Equity Score: 1, indicating a very unfavorable debt position.
- Overall Score: 3, also a moderate overall score matching A’s rating.
Which one is the best rated?
Based on the data, Agilent Technologies holds a slight edge with a higher rating (B+ vs. B) and stronger scores in return on equity and assets. However, Quest Diagnostics shows a poorer debt-to-equity score, suggesting higher financial risk. Overall, A is better rated strictly by these metrics.
Scores Comparison
The scores comparison for Agilent Technologies, Inc. and Quest Diagnostics Incorporated is detailed below:
Agilent Technologies, Inc. Scores
- Altman Z-Score: 5.21, indicating a safe zone with low bankruptcy risk.
- Piotroski Score: 6, assessed as average financial strength.
Quest Diagnostics Incorporated Scores
- Altman Z-Score: 3.20, also in safe zone, moderate bankruptcy safety.
- Piotroski Score: 7, indicating strong financial strength.
Which company has the best scores?
Agilent shows a higher Altman Z-Score, suggesting greater bankruptcy safety, while Quest Diagnostics has a stronger Piotroski Score, indicating better financial health. Each excels in different score metrics based on provided data.
Grades Comparison
The following tables summarize recent reliable grades assigned to Agilent Technologies, Inc. and Quest Diagnostics Incorporated by established grading companies:
Agilent Technologies, Inc. Grades
This table shows recent grades and actions from leading financial institutions for Agilent Technologies, Inc.:
| Grading Company | Action | New Grade | Date |
|---|---|---|---|
| Evercore ISI Group | Upgrade | Outperform | 2026-01-05 |
| Barclays | Upgrade | Overweight | 2025-12-15 |
| JP Morgan | Maintain | Overweight | 2025-11-25 |
| Wells Fargo | Maintain | Overweight | 2025-11-25 |
| B of A Securities | Maintain | Neutral | 2025-11-25 |
| UBS | Maintain | Buy | 2025-11-25 |
| Barclays | Maintain | Equal Weight | 2025-11-25 |
| Citigroup | Maintain | Buy | 2025-11-25 |
| Baird | Maintain | Outperform | 2025-11-25 |
| TD Cowen | Maintain | Buy | 2025-10-14 |
Agilent Technologies has predominantly received buy and outperform grades, with recent upgrades indicating positive momentum.
Quest Diagnostics Incorporated Grades
This table displays recent grades and actions from recognized grading companies for Quest Diagnostics Incorporated:
| Grading Company | Action | New Grade | Date |
|---|---|---|---|
| Piper Sandler | Maintain | Neutral | 2025-10-27 |
| Truist Securities | Maintain | Hold | 2025-10-22 |
| Barclays | Maintain | Equal Weight | 2025-10-22 |
| Leerink Partners | Maintain | Outperform | 2025-10-21 |
| Jefferies | Maintain | Buy | 2025-10-21 |
| Mizuho | Maintain | Outperform | 2025-10-17 |
| UBS | Maintain | Neutral | 2025-10-17 |
| Evercore ISI Group | Maintain | In Line | 2025-10-08 |
| Barclays | Maintain | Equal Weight | 2025-10-02 |
| Baird | Downgrade | Neutral | 2025-08-25 |
Quest Diagnostics shows a more mixed rating profile, balancing buy and outperform grades with several hold and neutral ratings.
Which company has the best grades?
Agilent Technologies holds stronger and more consistent buy and outperform grades compared to Quest Diagnostics’ mixed ratings and more neutral consensus. This disparity may influence investor confidence and portfolio positioning depending on risk tolerance and investment goals.
Strengths and Weaknesses
Below is a comparative overview of key strengths and weaknesses for Agilent Technologies, Inc. (A) and Quest Diagnostics Incorporated (DGX) based on the most recent data.
| Criterion | Agilent Technologies, Inc. (A) | Quest Diagnostics Incorporated (DGX) |
|---|---|---|
| Diversification | Strong product segmentation with Life Sciences, Applied Markets, and Agilent CrossLab generating $7.5B+ combined revenue in 2025; diversified across multiple high-tech sectors. | Primarily focused on Diagnostic Information Services with $9.6B revenue in 2024; less diversified, concentrated in clinical lab testing. |
| Profitability | Favorable net margin of 18.75%, ROIC of 12.57%, and ROE of 19.33%; creating value but with a slightly declining profitability trend. | Moderate profitability with net margin 8.82%, ROIC 6.96%, and ROE 12.85%; currently shedding value with a steep decline in ROIC. |
| Innovation | High innovation potential supported by favorable fixed asset turnover (3.43) and strong R&D focus in Life Sciences. | Innovation less emphasized; stable fixed asset turnover (3.57) but slower growth in new product areas. |
| Global presence | Broad global footprint across multiple markets and sectors. | Large presence in US clinical diagnostics but limited global diversification. |
| Market Share | Leading positions in scientific instruments and life sciences markets. | Dominant in US diagnostic testing but challenged by competition and declining profitability. |
Key takeaways: Agilent Technologies shows stronger diversification, profitability, and innovation capabilities, though profitability is slightly declining. Quest Diagnostics remains a major player in diagnostics but faces challenges with declining returns and less diversification, increasing investment risk.
Risk Analysis
Below is a comparative table of key risks for Agilent Technologies, Inc. (A) and Quest Diagnostics Incorporated (DGX) based on the most recent data available in 2026:
| Metric | Agilent Technologies, Inc. (A) | Quest Diagnostics Incorporated (DGX) |
|---|---|---|
| Market Risk | Beta 1.29 indicates moderate volatility; exposure to cyclical healthcare diagnostics market. | Beta 0.64 shows lower volatility; stable demand but sensitive to healthcare policy changes. |
| Debt Level | Debt-to-Equity 0.5, favorable leverage with solid interest coverage (13.8x). | Debt-to-Equity 1.05, unfavorable, higher leverage risks though interest coverage remains adequate (6.2x). |
| Regulatory Risk | Moderate, subject to evolving diagnostic and chemical industry regulations. | Moderate to high, impacted by healthcare regulations and reimbursement policies. |
| Operational Risk | Diversified product lines reduce operational risks; reliance on advanced tech innovation. | Operational complexity due to large network of labs and service centers; risk in logistics and quality control. |
| Environmental Risk | Moderate, related to chemical and laboratory waste management. | Moderate, includes medical waste and compliance with environmental healthcare standards. |
| Geopolitical Risk | Low to moderate, primarily US operations with some international exposure. | Low to moderate, mainly US focused but some international presence could be affected by trade policies. |
Synthesis: Agilent faces moderate market and regulatory risks but benefits from a strong balance sheet and operational diversity. Quest Diagnostics carries higher debt risk and operational complexity, with regulatory changes posing significant impact. Market volatility favors Agilent, while Quest’s healthcare service model offers some defensive qualities. Investors should monitor regulatory developments and debt management closely.
Which Stock to Choose?
Agilent Technologies, Inc. (A) shows a favorable income evolution with solid profitability and efficient debt management. Its financial ratios are mostly favorable, though valuation metrics like P/E and P/B appear unfavorable. The company maintains a very favorable rating and a slightly favorable moat despite a recent decline in ROIC.
Quest Diagnostics Incorporated (DGX) demonstrates moderate income growth with neutral to favorable profitability and higher debt levels. Its financial ratios are slightly favorable overall, supported by a very favorable rating but a slightly unfavorable moat due to declining profitability and value destruction signals.
For investors focused on quality and value creation, Agilent’s stronger profitability and financial stability might appear more attractive, while those with a tolerance for higher leverage and seeking growth potential could find Quest Diagnostics’ profile more fitting. The choice could depend significantly on individual risk tolerance and investment strategy.
Disclaimer: Investment carries a risk of loss of initial capital. The past performance is not a reliable indicator of future results. Be sure to understand risks before making an investment decision.
Go Further
I encourage you to read the complete analyses of Agilent Technologies, Inc. and Quest Diagnostics Incorporated to enhance your investment decisions: