Home > Comparison > Healthcare > A vs MTD
The strategic rivalry between Agilent Technologies and Mettler-Toledo International shapes the Healthcare sector’s diagnostics and research landscape. Agilent operates as a diversified solutions provider with a broad product portfolio, while Mettler-Toledo focuses on precision instruments and industrial weighing technology. This head-to-head pits a comprehensive service model against specialized instrumentation. This analysis will identify which trajectory offers the superior risk-adjusted return for a diversified portfolio in 2026.
Table of contents
Companies Overview
Agilent Technologies and Mettler-Toledo are key players in the medical diagnostics and research equipment sector.
Agilent Technologies, Inc.: Precision Solutions for Life Sciences
Agilent Technologies dominates the life sciences and applied chemical markets with advanced chromatography and spectroscopy systems. It generates revenue through diverse instruments, software, and consumables tailored for diagnostics and genomics. In 2026, its strategic focus centers on expanding integrated laboratory automation and enhancing data analytics capabilities to cement its competitive edge.
Mettler-Toledo International Inc.: Global Leader in Precision Instruments
Mettler-Toledo specializes in precision measurement instruments across laboratories, industry, and retail sectors. Its revenue relies heavily on sales of balances, pipetting solutions, industrial weighing, and inspection systems supported by proprietary software platforms. The company’s 2026 strategy emphasizes broadening industrial solutions and optimizing digital connectivity to support complex customer workflows worldwide.
Strategic Collision: Similarities & Divergences
Both firms embrace high-tech instrumentation with a focus on accuracy and data integration. Agilent prioritizes closed, application-specific ecosystems, while Mettler-Toledo adopts an open approach spanning multiple industries. Their battleground lies in laboratory automation and data management software. Investors face contrasting profiles: Agilent offers diversified life sciences exposure, whereas Mettler-Toledo provides industrial precision and retail scale expertise.
Income Statement Comparison
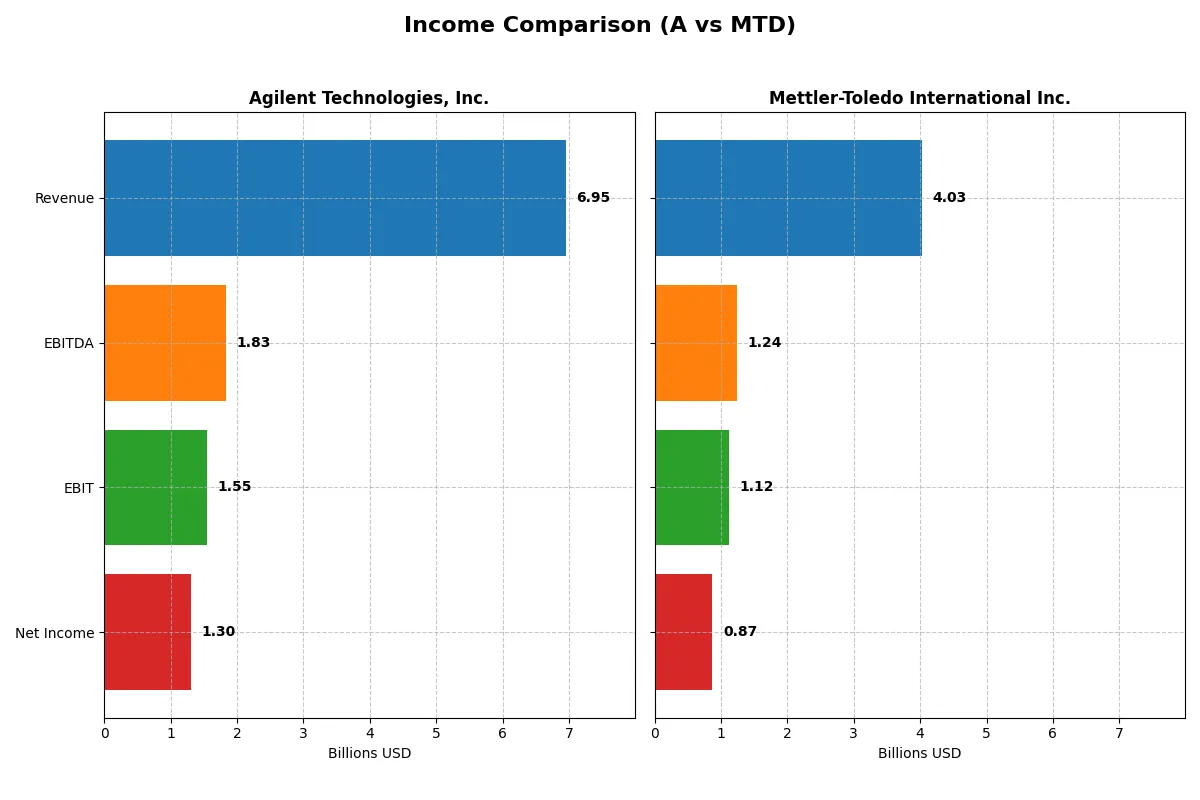
This table dissects the core profitability and scalability of both corporate engines to reveal who dominates the bottom line:
| Metric | Agilent Technologies, Inc. (A) | Mettler-Toledo International Inc. (MTD) |
|---|---|---|
| Revenue | 6.95B | 4.03B |
| Cost of Revenue | 3.31B | 1.71B |
| Operating Expenses | 2.16B | 1.20B |
| Gross Profit | 3.64B | 2.32B |
| EBITDA | 1.84B | 1.24B |
| EBIT | 1.55B | 1.12B |
| Interest Expense | 112M | 68.5M |
| Net Income | 1.30B | 869M |
| EPS | 4.59 | 42.17 |
| Fiscal Year | 2025 | 2025 |
Income Statement Analysis: The Bottom-Line Duel
This income statement comparison reveals which company runs a more efficient and profitable corporate engine through recent financial performance.
Agilent Technologies, Inc. Analysis
Agilent’s revenue grew steadily from $6.3B in 2021 to $6.9B in 2025, with net income climbing from $1.21B to $1.30B. Its gross margin remains strong near 52%, while net margin holds at 18.75%, reflecting solid cost control. Despite a slight EBIT decline in 2025, earnings per share improved, signaling sustained operational momentum.
Mettler-Toledo International Inc. Analysis
Mettler-Toledo posted revenue growth from $3.7B in 2021 to $4.0B in 2025, with net income rising from $769M to $869M. The company boasts superior gross and net margins at 57.5% and 21.6%, respectively, demonstrating better profitability. EBIT edged up modestly, though operating expenses grew faster than revenue, slightly pressuring margins in the latest year.
Margin Strength vs. Growth Discipline
Agilent delivers steady revenue and net income growth with stable margins, reflecting disciplined cost management. Mettler-Toledo leads in margin efficiency but faces margin pressure from rising operating costs. Agilent’s profile suits investors favoring consistent profitability, while Mettler-Toledo appeals to those eyeing higher margin potential amid cautious expense growth.
Financial Ratios Comparison
These vital ratios act as a diagnostic tool to expose the underlying fiscal health, valuation premiums, and capital efficiency of the companies compared below:
| Ratios | Agilent Technologies, Inc. (A) | Mettler-Toledo International Inc. (MTD) |
|---|---|---|
| ROE | 19.3% | -36.8% |
| ROIC | 12.6% | 36.0% |
| P/E | 31.8 | 33.1 |
| P/B | 6.1 | -1215.7 |
| Current Ratio | 2.0 | 1.1 |
| Quick Ratio | 1.5 | 0.8 |
| D/E (Debt-to-Equity) | 0.50 | -91.1 |
| Debt-to-Assets | 26.4% | 58.0% |
| Interest Coverage | 13.2 | 16.3 |
| Asset Turnover | 0.55 | 1.08 |
| Fixed Asset Turnover | 3.43 | 4.76 |
| Payout Ratio | 21.6% | 0% |
| Dividend Yield | 0.68% | 0% |
| Fiscal Year | 2025 | 2025 |
Efficiency & Valuation Duel: The Vital Signs
Ratios act as a company’s DNA, revealing hidden risks and operational excellence that raw numbers alone cannot expose.
Agilent Technologies, Inc.
Agilent posts a solid 19.3% ROE and an 18.75% net margin, signaling strong profitability. Its P/E of 31.8 and P/B of 6.14 suggest the stock trades at a premium. Shareholders receive a modest 0.68% yield, reflecting limited dividends but significant reinvestment in R&D, fueling future growth potential.
Mettler-Toledo International Inc.
Mettler-Toledo boasts a robust 21.6% net margin and an impressive 35.95% ROIC, indicating operational efficiency. However, its P/E of 33.1 and a negative P/B ratio raise valuation concerns. The company pays no dividends, choosing to reinvest earnings aggressively into growth initiatives, though its negative ROE signals caution.
Premium Valuation vs. Operational Safety
Agilent offers a more balanced risk-reward profile with favorable profitability and stable dividend income despite a stretched valuation. Mettler-Toledo excels operationally but carries valuation quirks and a negative ROE, increasing risk. Investors seeking steady returns may lean toward Agilent, while growth-focused profiles might consider Mettler-Toledo’s potential.
Which one offers the Superior Shareholder Reward?
I see Agilent Technologies (A) delivers consistent dividends with a 0.68% yield and a modest 21.6% payout ratio, supported by strong free cash flow coverage above 2x. Its buyback program appears steady but less aggressive. Mettler-Toledo (MTD) pays no dividends, reinvesting heavily in growth and acquisitions, reflected by its robust free cash flow and capital expenditure. MTD’s buybacks are limited, prioritizing reinvestment over distributions. Historically, dividend payers like Agilent offer more predictable income, while MTD’s growth focus may drive capital appreciation. For 2026, I favor Agilent’s balanced distribution model for sustainable total return, given its disciplined payout and cash flow strength.
Comparative Score Analysis: The Strategic Profile
The radar chart reveals the fundamental DNA and trade-offs of Agilent Technologies and Mettler-Toledo International, highlighting their strategic financial positioning:
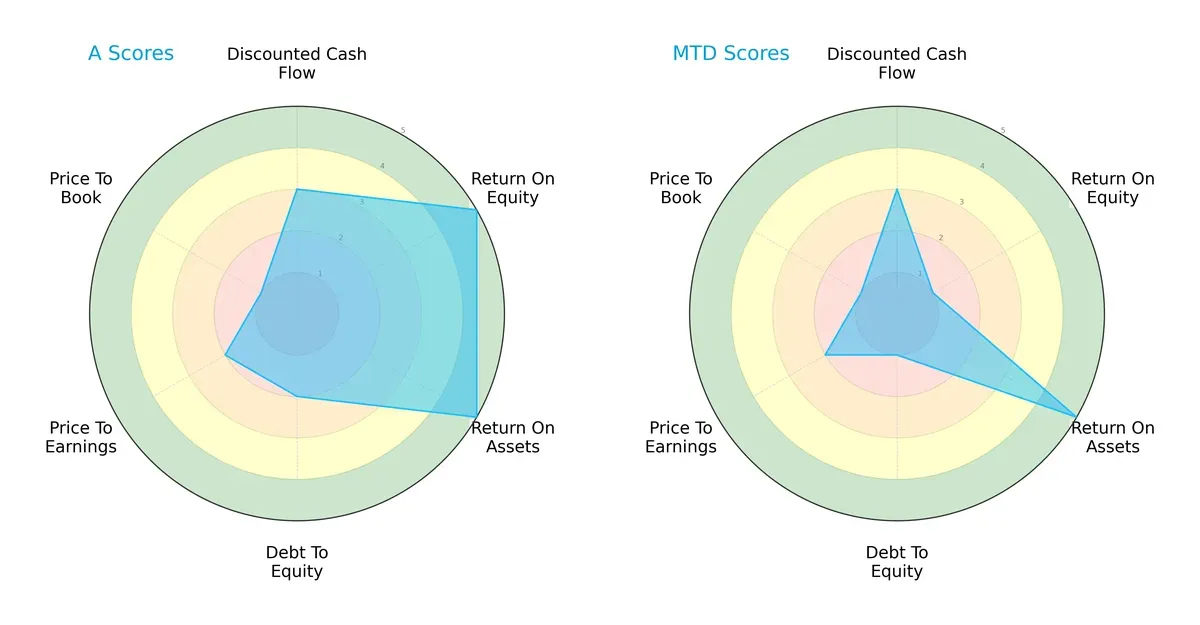
Agilent Technologies displays a more balanced profile, excelling in ROE (5) and ROA (5) with moderate DCF (3), but it faces challenges with debt (2) and valuation (PE 2, PB 1). Mettler-Toledo relies heavily on asset efficiency (ROA 5) but suffers from weak equity returns (ROE 1) and higher financial risk (debt 1). Agilent’s diversified strengths suggest greater resilience, while Mettler-Toledo leans on a specific operational edge.
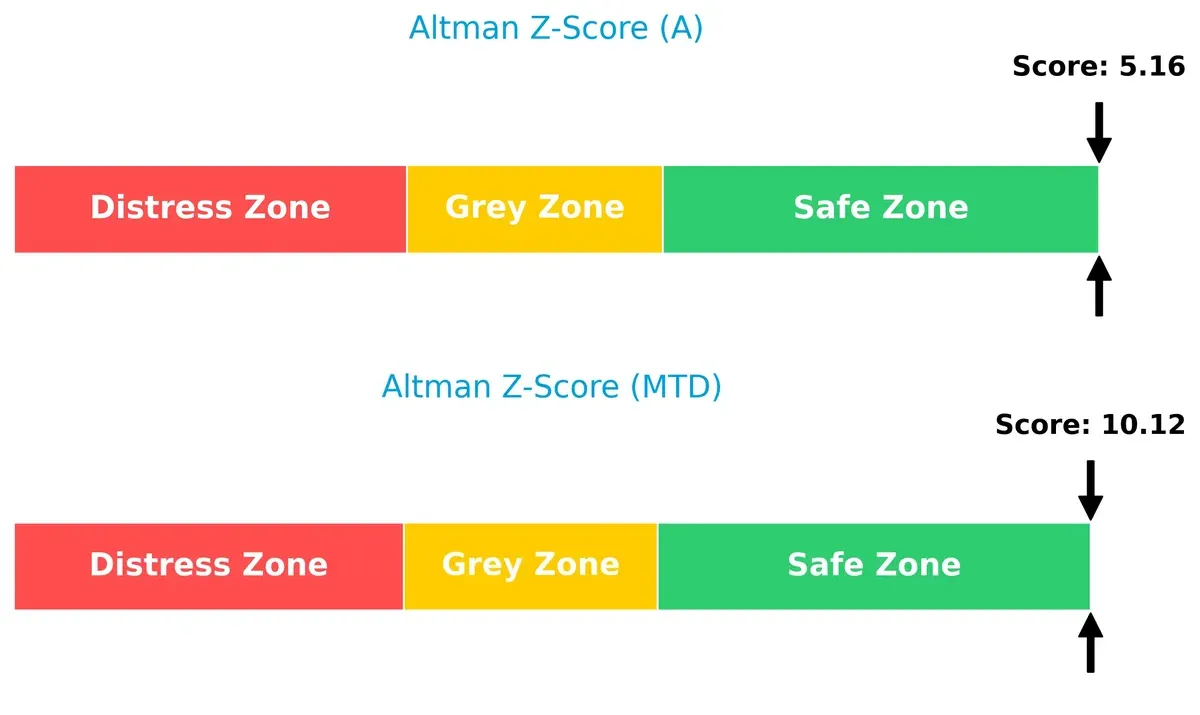
Bankruptcy Risk: Solvency Showdown
The Altman Z-Scores place both companies comfortably in the safe zone, but Mettler-Toledo’s 10.1 score far surpasses Agilent’s 5.2, indicating superior solvency and lower bankruptcy risk in the current economic cycle:
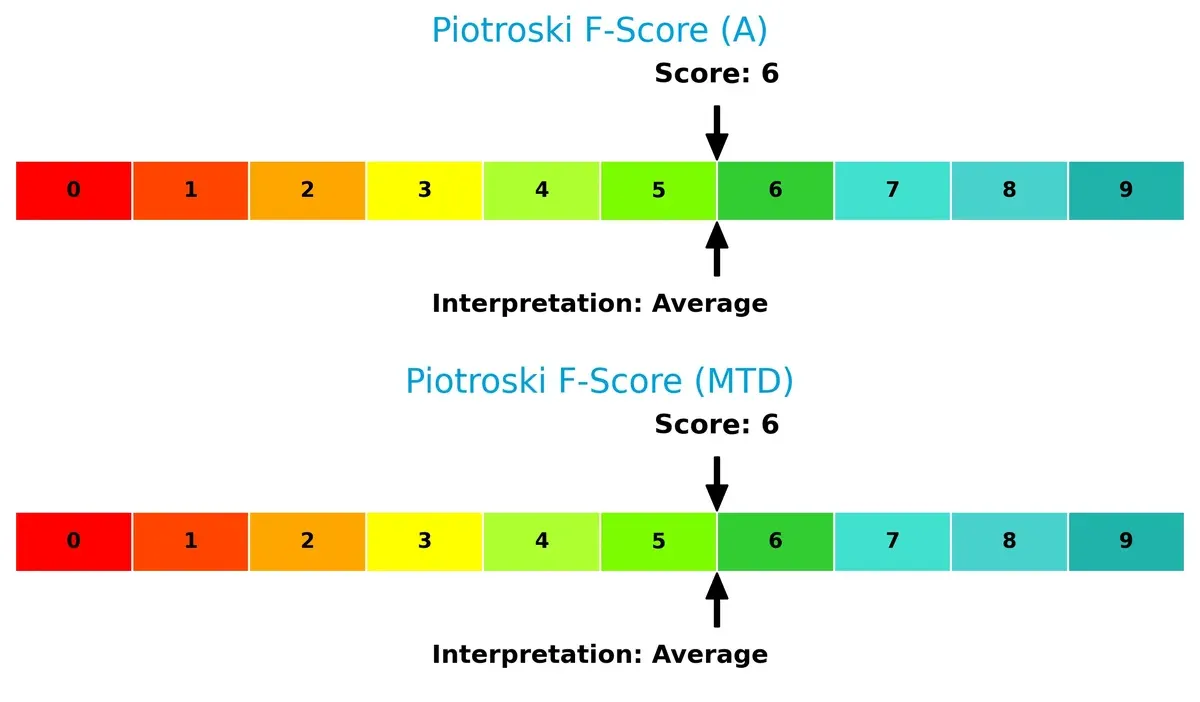
Financial Health: Quality of Operations
Both firms score a 6 on the Piotroski F-Score, indicating average financial health without glaring red flags. Neither shows alarming weaknesses in internal operations relative to the other:
How are the two companies positioned?
This section dissects the operational DNA of Agilent and Mettler-Toledo by comparing their revenue distribution and internal strengths and weaknesses. The goal is to confront their economic moats and identify which model offers the most resilient competitive advantage today.
Revenue Segmentation: The Strategic Mix
This visual comparison dissects how Agilent Technologies and Mettler-Toledo International diversify their income streams and where their primary sector bets lie:
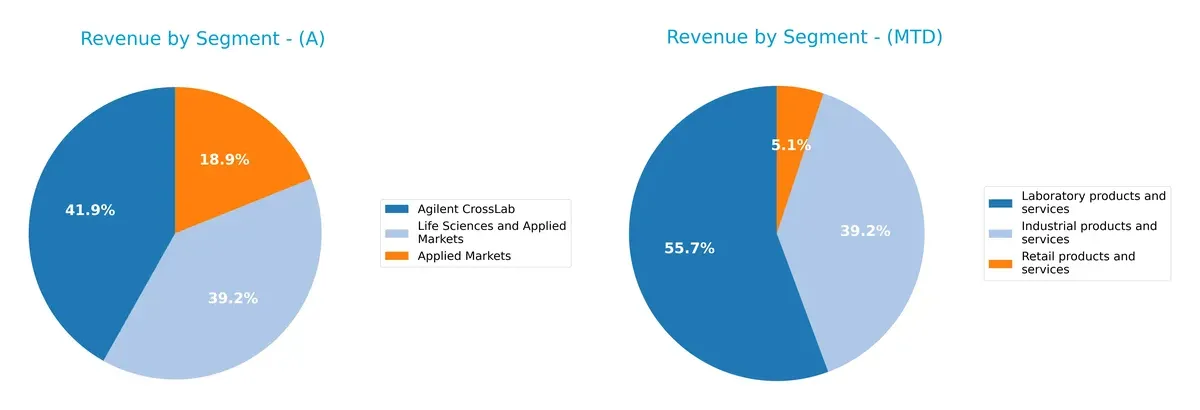
Agilent Technologies anchors its revenue in Life Sciences and Applied Markets with $2.7B, supplemented by a strong $2.9B in Agilent CrossLab. In contrast, Mettler-Toledo pivots around Laboratory Products and Services at $2.2B, with Industrial Products and Services contributing $1.6B. Agilent’s mix shows moderate diversification across high-tech segments, while Mettler-Toledo balances two substantial segments, reducing concentration risk but relying heavily on lab-related markets.
Strengths and Weaknesses Comparison
This table compares the Strengths and Weaknesses of Agilent Technologies, Inc. and Mettler-Toledo International Inc.:
Agilent Technologies Strengths
- Favorable net margin at 18.75%
- ROIC above WACC at 12.57%
- Strong liquidity ratios
- Moderate debt levels
- Diversified revenue streams across segments
- Broad global presence across Americas, Asia Pacific, and Europe
Mettler-Toledo Strengths
- Higher net margin at 21.59%
- Substantial ROIC at 35.95%
- Strong interest coverage at 16.31
- Favorable fixed asset turnover
- Diversified business with industrial, laboratory, and retail segments
- Presence in Americas, Europe, and Asia
Agilent Technologies Weaknesses
- Unfavorable valuation multiples: PE 31.79, PB 6.14
- Dividend yield low at 0.68%
- Neutral asset turnover at 0.55
- No indication of market share dominance
- Some segments show fluctuating revenues
Mettler-Toledo Weaknesses
- Negative ROE at -3677.41% indicates accounting anomaly or loss
- Unfavorable WACC at 10.01%
- High debt-to-assets ratio at 57.97%
- Low liquidity ratios with quick ratio 0.81
- Dividend yield is zero
- Unfavorable PE multiple at 33.06
Both companies demonstrate diversified operations and global reach, but Agilent maintains stronger balance sheet health and liquidity. Mettler-Toledo exhibits superior profitability metrics but carries financial risks from leverage and negative ROE, suggesting careful monitoring of capital structure and earnings quality is warranted.
The Moat Duel: Analyzing Competitive Defensibility
A structural moat protects long-term profits from relentless competition erosion. Let’s dissect how Agilent and Mettler-Toledo maintain their economic barriers:
Agilent Technologies, Inc.: Intangible Assets & Broad Product Ecosystem
Agilent’s moat stems from deep intangible assets and a broad life sciences product range. Its 3.2% ROIC premium over WACC signals value creation despite a slight ROIC decline. Expansion in diagnostics software may deepen its moat by 2026.
Mettler-Toledo International Inc.: Precision Instruments with Cost Advantage
Mettler-Toledo relies on precision manufacturing and strong brand reputation, achieving a 26% ROIC premium over WACC with a rising trend. Its cost advantage and software integration enhance pricing power and market penetration moving forward.
Intangible Assets vs. Cost Leadership: Who Holds the Deeper Moat?
Mettler-Toledo’s wider moat outpaces Agilent’s thanks to superior ROIC growth and margin strength. It is better positioned to defend market share amid competitive pressures and technological shifts by 2026.
Which stock offers better returns?
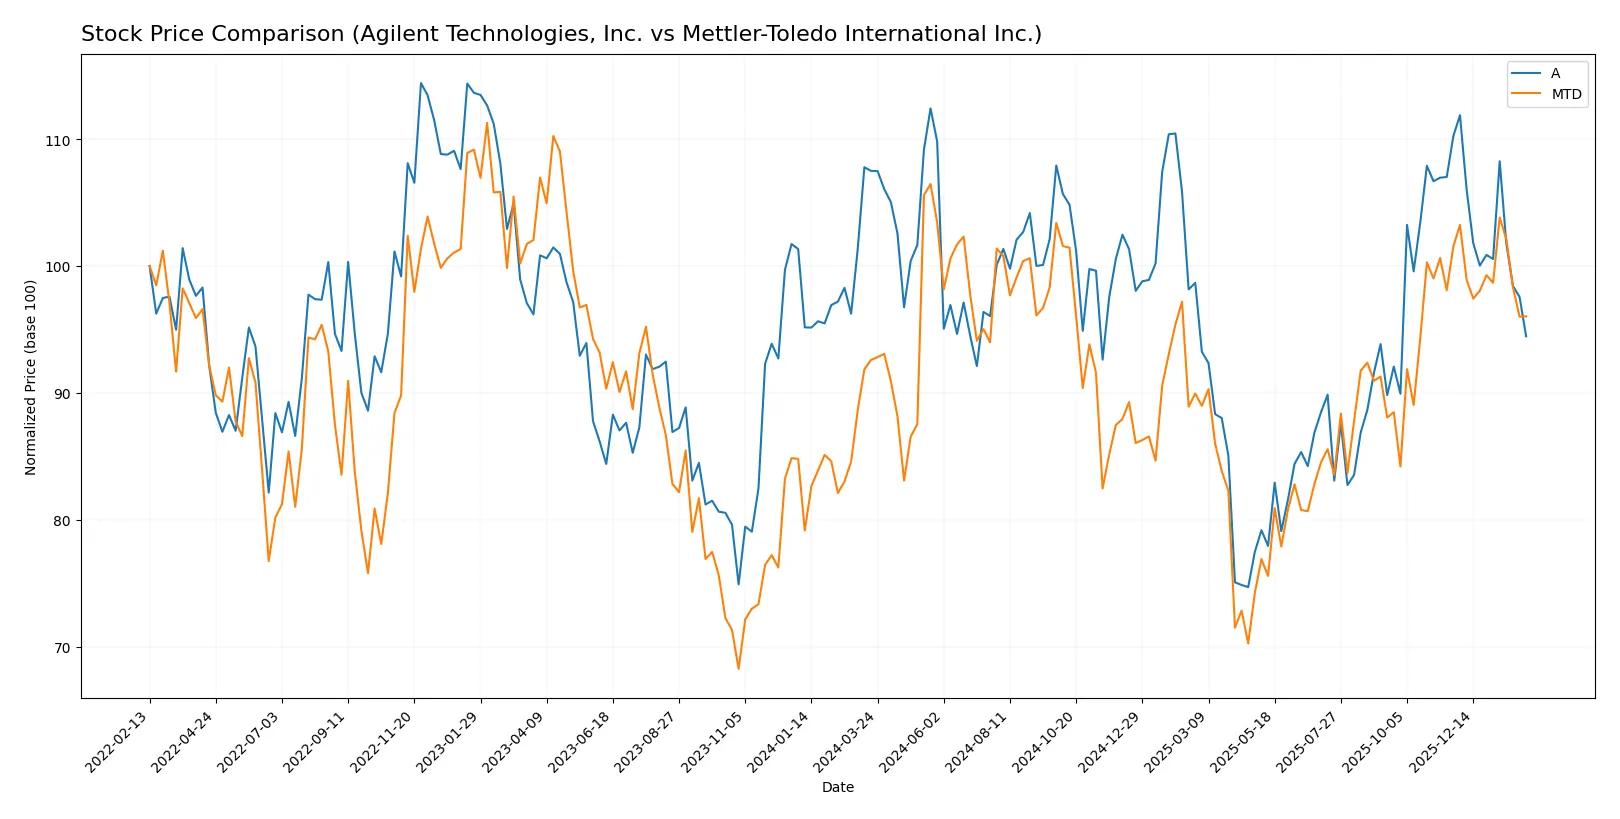
The past year shows divergent price dynamics: Agilent Technologies, Inc. declined steadily, while Mettler-Toledo International Inc. gained modestly before recent downturns.
Trend Comparison
Agilent Technologies, Inc. experienced a bearish trend with a -12.14% price change over 12 months, showing deceleration and a volatility of 12.76. The price peaked at 154.23 and fell to a low of 102.48.
Mettler-Toledo International Inc. posted a bullish 3.71% gain over the same period, despite deceleration. Volatility was high at 117.17, with a highest price of 1522.75 and a low of 1004.96.
Comparatively, Mettler-Toledo International Inc. outperformed Agilent Technologies, Inc. in market returns over the past year, despite recent short-term declines.
Target Prices
Analysts present a confident upside for Agilent Technologies and Mettler-Toledo International, reflecting strong sector momentum.
| Company | Target Low | Target High | Consensus |
|---|---|---|---|
| Agilent Technologies, Inc. | 130 | 180 | 166.36 |
| Mettler-Toledo International Inc. | 1400 | 1600 | 1504.17 |
Both stocks trade below consensus targets, signaling potential appreciation. Agilent’s current price at 129.58 is just below its low target, while Mettler-Toledo trades at 1373.57, well under its midpoint target. This gap suggests attractive entry points given their industry positioning.

Don’t Let Luck Decide Your Entry Point
Optimize your entry points with our advanced ProRealTime indicators. You’ll get efficient buy signals with precise price targets for maximum performance. Start outperforming now!
How do institutions grade them?
Agilent Technologies, Inc. Grades
Below is a summary of recent grades issued by notable financial institutions for Agilent Technologies, Inc.:
| Grading Company | Action | New Grade | Date |
|---|---|---|---|
| Evercore ISI Group | Upgrade | Outperform | 2026-01-05 |
| Barclays | Upgrade | Overweight | 2025-12-15 |
| Wells Fargo | Maintain | Overweight | 2025-11-25 |
| UBS | Maintain | Buy | 2025-11-25 |
| JP Morgan | Maintain | Overweight | 2025-11-25 |
| Baird | Maintain | Outperform | 2025-11-25 |
| Citigroup | Maintain | Buy | 2025-11-25 |
| Barclays | Maintain | Equal Weight | 2025-11-25 |
| B of A Securities | Maintain | Neutral | 2025-11-25 |
| TD Cowen | Maintain | Buy | 2025-10-14 |
Mettler-Toledo International Inc. Grades
The following table lists recent institutional grades for Mettler-Toledo International Inc.:
| Grading Company | Action | New Grade | Date |
|---|---|---|---|
| Wells Fargo | Maintain | Equal Weight | 2025-12-15 |
| Barclays | Maintain | Overweight | 2025-12-15 |
| Wells Fargo | Maintain | Equal Weight | 2025-11-10 |
| Stifel | Maintain | Buy | 2025-11-10 |
| Citigroup | Maintain | Buy | 2025-11-10 |
| Barclays | Maintain | Overweight | 2025-11-10 |
| JP Morgan | Maintain | Neutral | 2025-10-09 |
| Evercore ISI Group | Maintain | Outperform | 2025-10-07 |
| Barclays | Maintain | Overweight | 2025-10-02 |
| B of A Securities | Maintain | Neutral | 2025-09-22 |
Which company has the best grades?
Agilent Technologies shows more recent upgrades including a January 2026 upgrade to Outperform by Evercore ISI Group. Mettler-Toledo maintains stable grades without recent upgrades. This may influence investor sentiment, favoring Agilent’s momentum.
Risks specific to each company
The following risk categories identify critical pressure points and systemic threats facing Agilent Technologies, Inc. and Mettler-Toledo International Inc. in the 2026 market environment:
1. Market & Competition
Agilent Technologies, Inc.
- Faces intense competition in life sciences diagnostics, requiring innovation to maintain market share.
Mettler-Toledo International Inc.
- Competes globally in precision instruments with strong presence but vulnerable to pricing pressure.
2. Capital Structure & Debt
Agilent Technologies, Inc.
- Maintains moderate debt with a favorable debt-to-assets ratio of 26.35%, supporting financial stability.
Mettler-Toledo International Inc.
- Exhibits high debt-to-assets ratio at 57.97%, raising concerns about leverage and financial risk.
3. Stock Volatility
Agilent Technologies, Inc.
- Beta at 1.298 signals moderate volatility, aligned with healthcare sector norms.
Mettler-Toledo International Inc.
- Higher beta at 1.436 indicates elevated stock price fluctuations and risk.
4. Regulatory & Legal
Agilent Technologies, Inc.
- Subject to stringent healthcare regulations; compliance costs could pressure margins.
Mettler-Toledo International Inc.
- Operates globally with diverse regulations; legal risks increase with geographic spread.
5. Supply Chain & Operations
Agilent Technologies, Inc.
- Complex supply chain with exposure to component shortages; operational efficiency is crucial.
Mettler-Toledo International Inc.
- Relies on global manufacturing; supply disruptions could impact delivery and revenues.
6. ESG & Climate Transition
Agilent Technologies, Inc.
- Faces rising pressure to improve sustainability in products and operations.
Mettler-Toledo International Inc.
- ESG initiatives are advancing but require substantial investment to meet evolving standards.
7. Geopolitical Exposure
Agilent Technologies, Inc.
- Primarily US-based with some international exposure; geopolitical risks are moderate.
Mettler-Toledo International Inc.
- Diverse international operations increase vulnerability to geopolitical tensions and trade barriers.
Which company shows a better risk-adjusted profile?
Agilent Technologies’ moderate leverage and stable financial health suggest a stronger risk-adjusted profile. Mettler-Toledo’s high debt and stock volatility amplify its risk, despite robust operational metrics. The most impactful risk for Agilent is regulatory pressure affecting margins. For Mettler-Toledo, excessive leverage threatens financial flexibility. Agilent’s favorable debt-to-assets ratio (26.35%) versus Mettler-Toledo’s elevated 57.97% justifies my caution toward Mettler-Toledo’s balance sheet risk.
Final Verdict: Which stock to choose?
Agilent Technologies, Inc. excels as a cash-generating powerhouse with a solid economic moat, driven by efficient capital use and strong profitability metrics. Its main point of vigilance is a slightly declining ROIC trend, signaling potential pressure on future margins. This stock suits investors pursuing steady growth with moderate risk tolerance.
Mettler-Toledo International Inc. commands a strategic moat through superior ROIC growth and operational efficiency, showcasing its ability to sustain a competitive advantage. However, its elevated debt levels and volatile equity returns present a safety concern compared to Agilent. It fits well in a portfolio aimed at Growth at a Reasonable Price (GARP) with a higher risk appetite.
If you prioritize consistent value creation and financial stability, Agilent Technologies offers a compelling scenario due to its balanced profitability and healthier leverage profile. However, if you seek aggressive growth backed by rising capital returns and operational excellence, Mettler-Toledo outshines with a stronger moat despite its risk factors. Both scenarios require careful risk evaluation aligned with individual investment objectives.
Disclaimer: Investment carries a risk of loss of initial capital. The past performance is not a reliable indicator of future results. Be sure to understand risks before making an investment decision.
Go Further
I encourage you to read the complete analyses of Agilent Technologies, Inc. and Mettler-Toledo International Inc. to enhance your investment decisions: