Navigating the dynamic healthcare sector requires careful consideration of industry leaders like Agilent Technologies, Inc. and IQVIA Holdings Inc. Both companies operate within the medical diagnostics and research space, yet they distinguish themselves through unique innovation strategies and market approaches. Agilent focuses on advanced laboratory instruments, while IQVIA excels in analytics and clinical research services. In this article, I will help you determine which company presents the most compelling opportunity for your investment portfolio.
Table of contents
Companies Overview
I will begin the comparison between Agilent Technologies, Inc. and IQVIA Holdings Inc. by providing an overview of these two companies and their main differences.
Agilent Technologies Overview
Agilent Technologies, Inc. delivers application-focused solutions in life sciences, diagnostics, and applied chemical markets globally. The company offers a broad portfolio including chromatography systems, mass spectrometry instruments, cell analysis tools, and laboratory software. It serves markets through direct sales, distributors, and e-commerce, maintaining a strong presence in medical diagnostics and research since its incorporation in 1999.
IQVIA Holdings Overview
IQVIA Holdings Inc. provides advanced analytics, technology solutions, and clinical research services to the life sciences sector worldwide. The company operates through segments focused on technology and analytics, research and development, and contract sales and medical solutions. Founded in 1982, IQVIA leverages cloud applications, real-world data, and clinical trial services to support pharmaceutical and healthcare clients across multiple regions.
Key similarities and differences
Both Agilent and IQVIA operate in the healthcare industry, focusing on medical diagnostics and research, yet their business models differ. Agilent emphasizes laboratory instruments, consumables, and software for chemical and biological analysis. In contrast, IQVIA concentrates on analytics, clinical research, and healthcare technology solutions, offering data-driven services and trial management. Agilent’s approach is product- and equipment-based, while IQVIA’s is service- and data-centric.
Income Statement Comparison
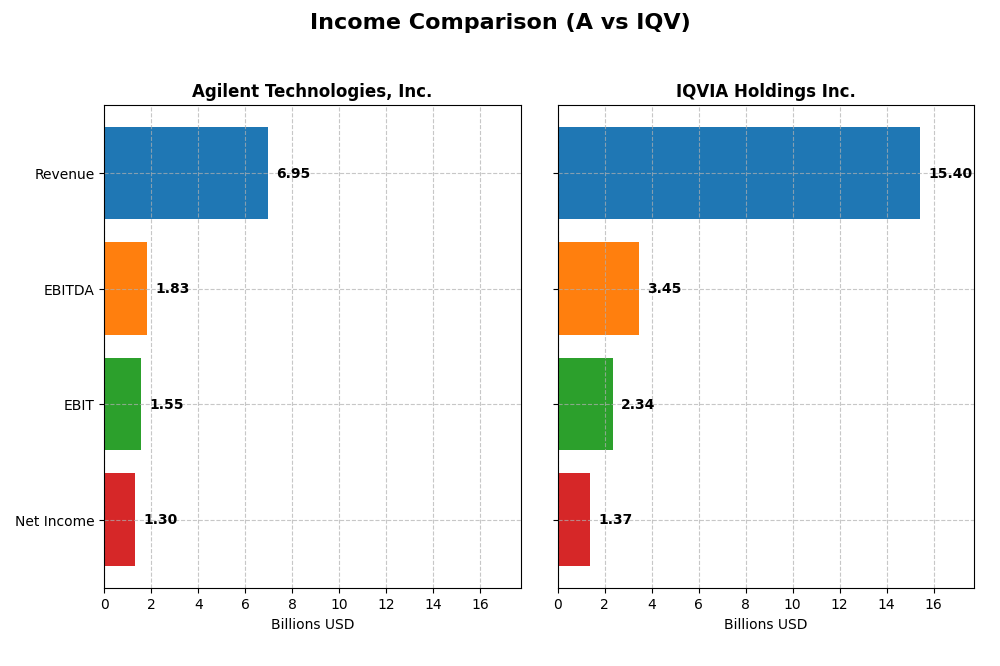
This table compares key income statement metrics for Agilent Technologies, Inc. and IQVIA Holdings Inc. for their most recent fiscal years.
| Metric | Agilent Technologies, Inc. | IQVIA Holdings Inc. |
|---|---|---|
| Market Cap | 42.1B | 41.3B |
| Revenue | 6.95B | 15.41B |
| EBITDA | 1.84B | 3.45B |
| EBIT | 1.55B | 2.34B |
| Net Income | 1.30B | 1.37B |
| EPS | 4.59 | 7.57 |
| Fiscal Year | 2025 | 2024 |
Income Statement Interpretations
Agilent Technologies, Inc.
Agilent Technologies demonstrated generally positive trends in revenue and net income from 2021 to 2025, with revenue increasing from $6.32B to $6.95B and net income rising from $1.21B to $1.30B. Margins remained stable, notably a gross margin of 52.43% and a net margin of 18.75% in 2025. The latest year showed revenue growth of 6.73% but a slight decline in EBIT and net margin, indicating some margin pressure despite EPS growth.
IQVIA Holdings Inc.
IQVIA Holdings experienced robust overall revenue growth, from $11.36B in 2020 to $15.41B in 2024, alongside net income expanding from $279M to $1.37B. Margins improved significantly over the period, with 2024 gross and net margins at 34.89% and 8.91%, respectively. The most recent year saw moderate revenue growth of 2.81%, positive EBIT growth of 9.76%, but a slight decline in net margin, reflecting mixed margin trends despite strong EPS growth.
Which one has the stronger fundamentals?
Both companies present favorable income statement evaluations with more than 60% positive indicators. IQVIA shows stronger overall growth in revenue, net income, and margins, supported by a higher proportion of favorable assessments (78.57%). Agilent maintains higher margins but faces slight margin declines recently. IQVIA’s substantial net income and EPS growth over the period contrast with Agilent’s steadier but slower expansion.
Financial Ratios Comparison
The table below presents the latest available financial ratios for Agilent Technologies, Inc. and IQVIA Holdings Inc., offering a side-by-side view of key performance and financial health metrics as of fiscal year-end 2025 for Agilent and 2024 for IQVIA.
| Ratios | Agilent Technologies, Inc. (A) | IQVIA Holdings Inc. (IQV) |
|---|---|---|
| ROE | 19.33% | 22.63% |
| ROIC | 12.57% | 8.59% |
| P/E | 31.79 | 25.95 |
| P/B | 6.14 | 5.87 |
| Current Ratio | 1.96 | 0.84 |
| Quick Ratio | 1.52 | 0.84 |
| D/E (Debt-to-Equity) | 0.50 | 2.33 |
| Debt-to-Assets | 26.35% | 52.63% |
| Interest Coverage | 13.21 | 3.29 |
| Asset Turnover | 0.55 | 0.57 |
| Fixed Asset Turnover | 3.43 | 19.93 |
| Payout Ratio | 21.64% | 0% |
| Dividend Yield | 0.68% | 0% |
Interpretation of the Ratios
Agilent Technologies, Inc.
Agilent shows predominantly favorable financial ratios, including a strong net margin of 18.75% and a solid ROE of 19.33%, indicating efficient profitability and shareholder value creation. Its leverage and liquidity metrics are positive, with a debt-to-assets ratio of 26.35% and a current ratio near 2. The company pays dividends, but its dividend yield is low at 0.68%, suggesting modest shareholder returns despite a stable payout policy.
IQVIA Holdings Inc.
IQVIA’s ratios present a mixed picture, with favorable ROE at 22.63% but neutral net margin and ROIC, indicating moderate profitability and capital efficiency. The company faces concerns due to a high debt-to-equity ratio of 2.33 and a low current ratio of 0.84, reflecting potential liquidity risks. IQV does not pay dividends, likely reflecting reinvestment strategies or debt management priorities.
Which one has the best ratios?
Agilent Technologies stands out with a majority of favorable ratios, particularly in profitability, leverage, and liquidity, supporting a generally positive financial profile. IQVIA, by contrast, shows significant unfavorable ratios related to debt and liquidity, and fewer favorable indicators. Overall, Agilent’s ratios are stronger and more balanced than IQVIA’s in this comparison.
Strategic Positioning
This section compares the strategic positioning of Agilent Technologies, Inc. and IQVIA Holdings Inc., focusing on market position, key segments, and exposure to technological disruption:
Agilent Technologies, Inc.
- Established market player in medical diagnostics with moderate competitive pressure.
- Diverse segments include Life Sciences, Diagnostics, and CrossLab services driving revenues.
- Operates across multiple lab instrumentation and diagnostic technologies with steady innovation.
IQVIA Holdings Inc.
- Large healthcare analytics and clinical research firm facing intense competition.
- Focuses on Technology & Analytics, Research & Development, and Contract Sales solutions.
- Leverages advanced cloud-based analytics and virtual trials, adapting to digital healthcare trends.
Agilent Technologies, Inc. vs IQVIA Holdings Inc. Positioning
Agilent pursues a diversified strategy across multiple scientific instruments and diagnostics segments, providing broad market exposure. IQVIA concentrates on healthcare analytics and clinical research services, emphasizing technology-driven solutions and consulting. Each approach offers distinct operational focuses and market engagement.
Which has the best competitive advantage?
Agilent shows a slightly favorable moat with value creation but declining profitability, while IQVIA has a slightly unfavorable moat with value destruction despite improving profitability, indicating Agilent currently holds a more sustainable competitive advantage.
Stock Comparison
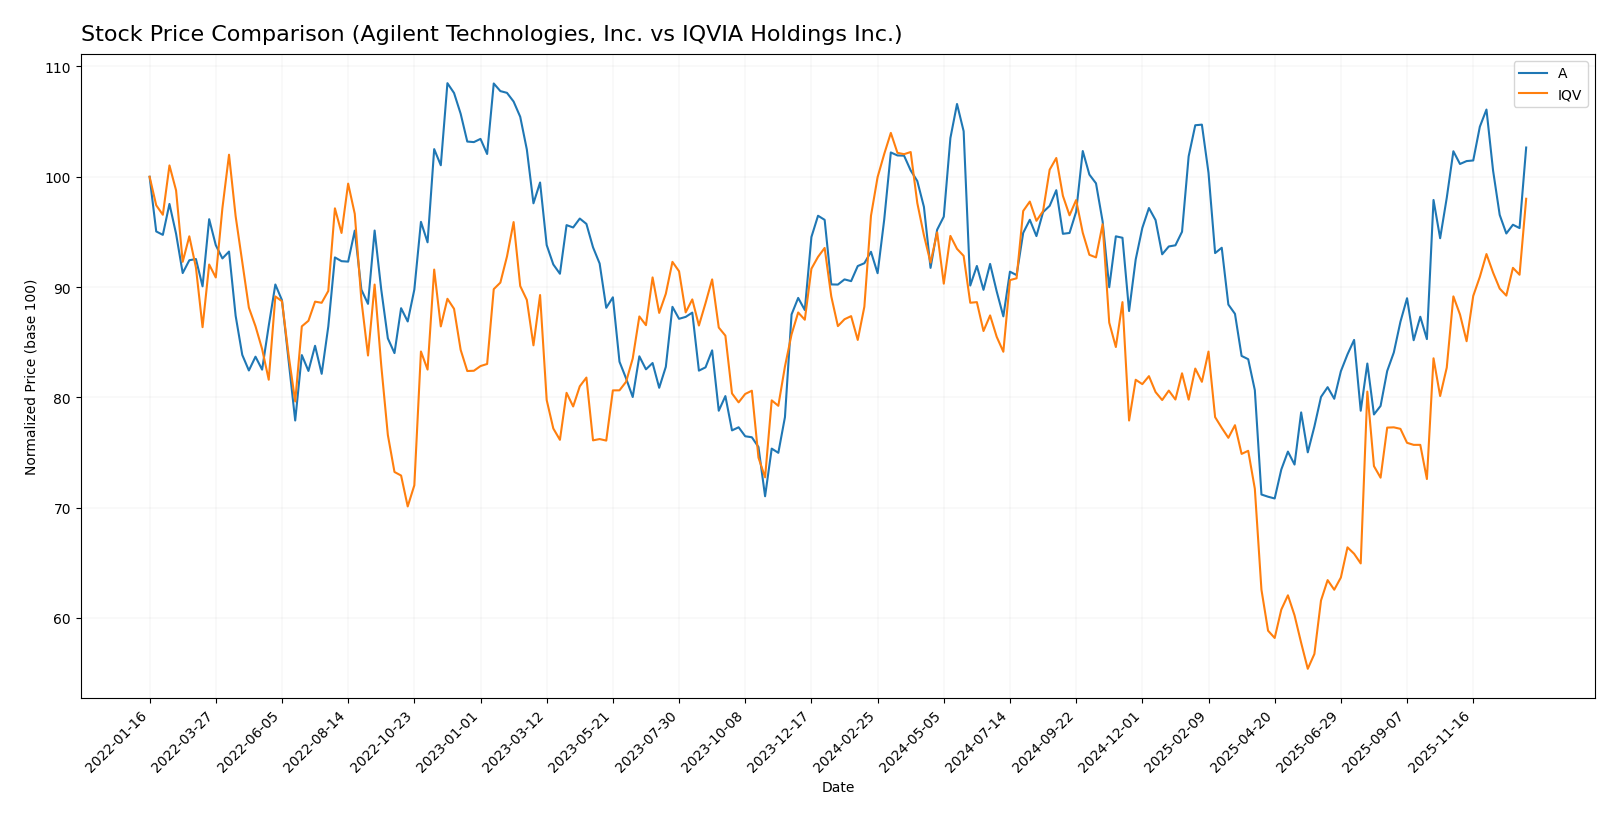
The past year showed distinct price movements and trading dynamics between Agilent Technologies, Inc. and IQVIA Holdings Inc., with Agilent exhibiting a clear bullish trend and IQVIA experiencing more moderate gains alongside notable volume shifts.
Trend Analysis
Agilent Technologies, Inc. recorded a 10.15% price increase over the past 12 months, confirming a bullish trend with deceleration. The stock ranged between 102.48 and 154.23, with a notable recent neutral trend showing slight decline.
IQVIA Holdings Inc. posted a 1.6% gain over the same period, reflecting a neutral overall trend despite accelerating momentum. Price fluctuated from 137.0 to 257.18, with recent strong bullish movement near 10%.
Comparing both, Agilent delivered the higher annual market performance with a 10.15% increase, while IQVIA’s smaller 1.6% gain indicates more subdued growth.
Target Prices
The current analyst consensus presents optimistic target prices for both Agilent Technologies, Inc. and IQVIA Holdings Inc.
| Company | Target High | Target Low | Consensus |
|---|---|---|---|
| Agilent Technologies, Inc. | 180 | 130 | 165 |
| IQVIA Holdings Inc. | 290 | 214 | 253.2 |
Analysts expect Agilent’s stock to appreciate from its current price of $148.52 toward a consensus target of $165. IQVIA’s consensus target of $253.2 suggests moderate upside from its current price near $242.41.
Analyst Opinions Comparison
This section compares analysts’ ratings and grades for Agilent Technologies, Inc. and IQVIA Holdings Inc.:
Rating Comparison
Agilent Technologies, Inc. Rating
- Rating: B+, classified as Very Favorable by analysts.
- Discounted Cash Flow Score: 4, indicating a favorable valuation outlook.
- Return on Equity Score: 5, rated very favorable for profit efficiency.
- Return on Assets Score: 5, very favorable for asset utilization.
- Debt To Equity Score: 2, moderate financial risk profile.
- Overall Score: 3, representing a moderate overall rating.
IQVIA Holdings Inc. Rating
- Rating: B+, also classified as Very Favorable by analysts.
- Discounted Cash Flow Score: 4, indicating a favorable valuation outlook.
- Return on Equity Score: 5, equally very favorable for profit efficiency.
- Return on Assets Score: 4, favorable but less than Agilent’s score.
- Debt To Equity Score: 1, lower score suggesting stronger balance sheet.
- Overall Score: 3, also representing a moderate overall rating.
Which one is the best rated?
Both Agilent Technologies and IQVIA hold the same overall rating of B+ with a moderate overall score of 3. Agilent has a higher return on assets score, while IQVIA has a stronger debt-to-equity score, indicating differing strengths in profitability and financial stability.
Scores Comparison
Here is a comparison of the financial scores for Agilent Technologies, Inc. and IQVIA Holdings Inc.:
Agilent Technologies, Inc. Scores
- Altman Z-Score: 5.21, indicating a safe zone from bankruptcy risk.
- Piotroski Score: 6, representing average financial strength.
IQVIA Holdings Inc. Scores
- Altman Z-Score: 2.15, indicating a grey zone with moderate bankruptcy risk.
- Piotroski Score: 5, representing average financial strength.
Which company has the best scores?
Agilent Technologies shows a stronger Altman Z-Score, placing it in a safer financial zone than IQVIA. Both companies have similar average Piotroski Scores, indicating comparable financial strength.
Grades Comparison
Here is a comparison of recent grades and rating trends for Agilent Technologies, Inc. and IQVIA Holdings Inc.:
Agilent Technologies, Inc. Grades
This table summarizes recent analyst grades and rating actions for Agilent Technologies, Inc.:
| Grading Company | Action | New Grade | Date |
|---|---|---|---|
| Evercore ISI Group | Upgrade | Outperform | 2026-01-05 |
| Barclays | Upgrade | Overweight | 2025-12-15 |
| JP Morgan | Maintain | Overweight | 2025-11-25 |
| Wells Fargo | Maintain | Overweight | 2025-11-25 |
| B of A Securities | Maintain | Neutral | 2025-11-25 |
| UBS | Maintain | Buy | 2025-11-25 |
| Barclays | Maintain | Equal Weight | 2025-11-25 |
| Citigroup | Maintain | Buy | 2025-11-25 |
| Baird | Maintain | Outperform | 2025-11-25 |
| TD Cowen | Maintain | Buy | 2025-10-14 |
Overall, Agilent’s grades show a generally positive trend with multiple upgrades and a strong consensus rating of “Buy” supported by 29 buy or strong buy recommendations.
IQVIA Holdings Inc. Grades
This table summarizes recent analyst grades and rating actions for IQVIA Holdings Inc.:
| Grading Company | Action | New Grade | Date |
|---|---|---|---|
| Truist Securities | Maintain | Buy | 2026-01-08 |
| UBS | Maintain | Buy | 2026-01-08 |
| Morgan Stanley | Maintain | Overweight | 2025-12-02 |
| TD Cowen | Downgrade | Hold | 2025-11-03 |
| Baird | Upgrade | Outperform | 2025-10-29 |
| Truist Securities | Maintain | Buy | 2025-10-29 |
| JP Morgan | Maintain | Overweight | 2025-10-29 |
| Stifel | Maintain | Buy | 2025-10-29 |
| Citigroup | Maintain | Neutral | 2025-10-29 |
| UBS | Maintain | Buy | 2025-10-29 |
IQVIA’s grades reveal mostly stable buy and outperform ratings, with a slight downgrade from TD Cowen. The consensus rating is also “Buy,” supported by 35 buy or strong buy recommendations.
Which company has the best grades?
Both Agilent Technologies and IQVIA Holdings have strong buy consensus ratings and numerous buy or outperform recommendations. IQVIA has a slightly larger number of buy ratings, but Agilent shows recent upgrades from major firms. Investors may note these subtle differences when assessing analyst sentiment.
Strengths and Weaknesses
Below is a comparative table outlining the key strengths and weaknesses of Agilent Technologies, Inc. (A) and IQVIA Holdings Inc. (IQV) based on recent financial and operational data.
| Criterion | Agilent Technologies, Inc. (A) | IQVIA Holdings Inc. (IQV) |
|---|---|---|
| Diversification | Broad product segmentation with strong Life Sciences and Applied Markets; steady revenue streams across segments | Diversified in Contract Sales, R&D, and Technology Analytics; heavy reliance on R&D Solutions |
| Profitability | Favorable net margin (18.75%) and ROIC (12.57%); creating value but with a declining ROIC trend | Moderate net margin (8.91%), ROIC (8.59%); shedding value but with improving ROIC |
| Innovation | Strong fixed asset turnover (3.43) indicating efficient asset use; consistent investment in Diagnostics and Genomics | Very high fixed asset turnover (19.93); significant investments in technology and analytics solutions |
| Global presence | Established global footprint with balanced revenue streams | Global presence focused on healthcare and tech solutions; less favorable liquidity ratios |
| Market Share | Strong market share in life sciences and diagnostics segments | Growing market share in healthcare services and analytics but higher debt levels |
Key takeaways: Agilent demonstrates strong profitability and diversified revenue, though its profitability shows signs of decline. IQV is improving profitability with significant innovation but faces challenges in liquidity and debt management. Investors should weigh Agilent’s stable value creation against IQV’s growth potential with caution on financial leverage.
Risk Analysis
Below is a comparative table highlighting key risk metrics for Agilent Technologies, Inc. (A) and IQVIA Holdings Inc. (IQV) as of the most recent fiscal years:
| Metric | Agilent Technologies, Inc. (A) | IQVIA Holdings Inc. (IQV) |
|---|---|---|
| Market Risk | Beta 1.29 (moderate volatility) | Beta 1.37 (moderate-high volatility) |
| Debt level | Debt-to-Equity 0.5 (low risk) | Debt-to-Equity 2.33 (high risk) |
| Regulatory Risk | Moderate (Healthcare sector) | Moderate (Healthcare sector) |
| Operational Risk | Favorable operational metrics | Neutral to favorable operational metrics |
| Environmental Risk | Standard industry compliance | Standard industry compliance |
| Geopolitical Risk | US-based, limited exposure | Global footprint, higher exposure |
Agilent shows lower financial leverage and a safe Altman Z-score (5.21), indicating strong financial stability and low bankruptcy risk. IQV’s higher debt levels and a Z-score in the grey zone (2.15) suggest more caution. Market volatility is slightly higher for IQV due to its global operations, increasing geopolitical and regulatory risks. Investors should weigh IQV’s growth potential against its elevated debt and operational complexities.
Which Stock to Choose?
Agilent Technologies, Inc. (A) exhibits a favorable income evolution with solid gross and EBIT margins, though recent EBIT and net margin growth show slight declines. Its financial ratios are predominantly favorable, highlighting strong profitability and moderate debt, supported by a very favorable B+ rating and a safe zone Altman Z-Score.
IQVIA Holdings Inc. (IQV) shows favorable income growth overall, particularly in net income and EPS, despite mixed recent revenue and margin growth. Its financial ratios are slightly unfavorable due to high debt levels and weaker liquidity, but it maintains a very favorable B+ rating and a grey zone Altman Z-Score indicating moderate financial risk.
Investors prioritizing stability, strong profitability, and moderate leverage might view Agilent Technologies as potentially favorable, while those focused on growth and improving profitability despite higher financial risk could interpret IQVIA’s profile as more suitable. The choice may depend on the investor’s risk tolerance and strategic focus.
Disclaimer: Investment carries a risk of loss of initial capital. The past performance is not a reliable indicator of future results. Be sure to understand risks before making an investment decision.
Go Further
I encourage you to read the complete analyses of Agilent Technologies, Inc. and IQVIA Holdings Inc. to enhance your investment decisions: