Home > Comparison > Healthcare > IDXX vs A
The strategic rivalry between IDEXX Laboratories, Inc. and Agilent Technologies, Inc. defines the current trajectory of the healthcare diagnostics sector. IDEXX operates as a specialized veterinary and water-testing diagnostics provider, while Agilent delivers diversified analytical instruments and life sciences solutions. This head-to-head pits niche focus against broad application. This analysis will determine which corporate path offers superior risk-adjusted returns for a diversified portfolio.

Table of contents
Companies Overview
IDEXX Laboratories and Agilent Technologies both hold prominent positions in the medical diagnostics and research market, shaping critical healthcare solutions globally.
IDEXX Laboratories, Inc.: Veterinary and Water Diagnostics Leader
IDEXX Laboratories dominates the companion animal veterinary and water testing markets. Its core revenue stems from point-of-care diagnostic instruments, rapid assay test kits, and veterinary software. In 2026, IDEXX sharpens its focus on expanding veterinary reference laboratory services and enhancing diagnostic imaging technology, reinforcing its competitive advantage in animal health diagnostics.
Agilent Technologies, Inc.: Life Sciences and Chemical Analysis Innovator
Agilent Technologies leads in life sciences and applied chemical markets with advanced liquid and gas chromatography systems, mass spectrometry, and laboratory automation. Its Diagnostics and Genomics segment fuels revenue through genetic analysis arrays and pharmacodiagnostics. The company’s 2026 strategy centers on integrating laboratory software and analytics to boost operational efficiency and customer service.
Strategic Collision: Similarities & Divergences
Both companies excel in diagnostics but diverge in focus: IDEXX commits to veterinary and environmental diagnostics, while Agilent prioritizes life sciences and chemical analysis. Their primary battleground lies in diagnostic innovation, particularly in instrumentation and software integration. IDEXX’s niche animal health focus contrasts with Agilent’s broad application solutions, creating distinctive investment profiles driven by specialized markets versus diversified technological platforms.
Income Statement Comparison
This data dissects the core profitability and scalability of both corporate engines to reveal who dominates the bottom line:
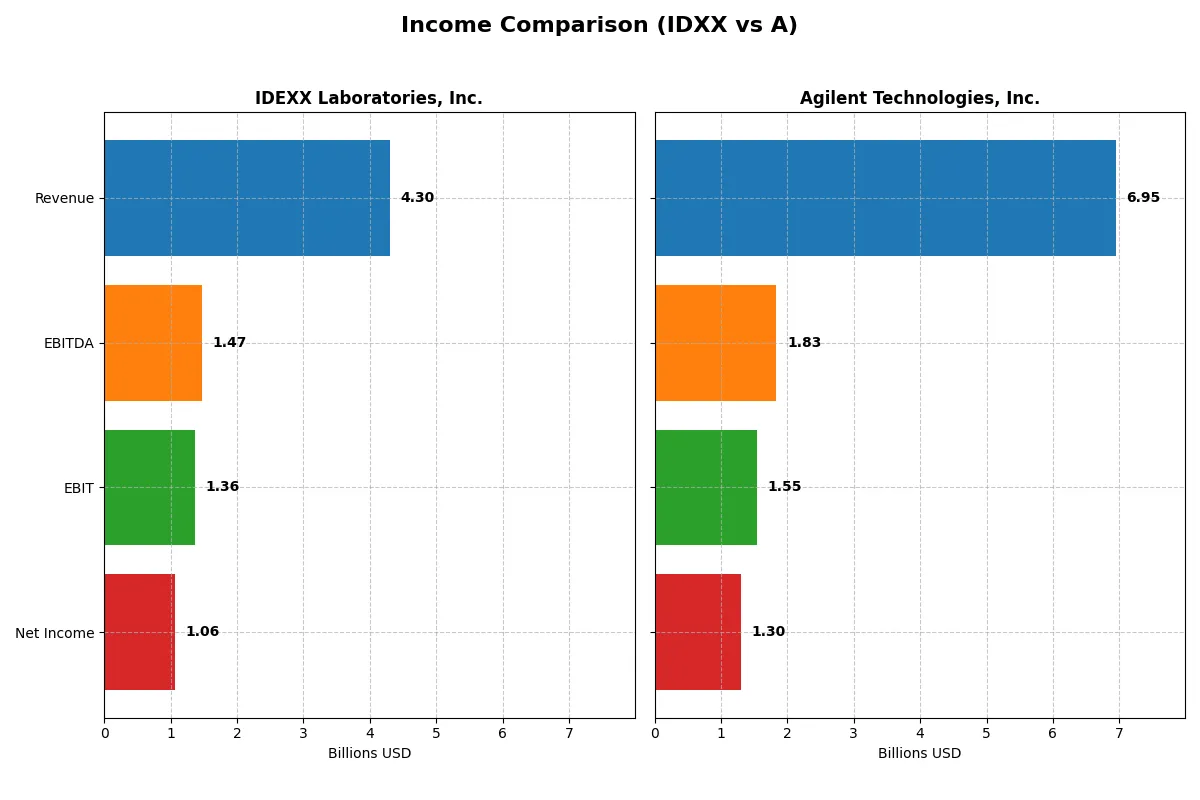
| Metric | IDEXX Laboratories, Inc. (IDXX) | Agilent Technologies, Inc. (A) |
|---|---|---|
| Revenue | 4.30B | 6.95B |
| Cost of Revenue | 1.64B | 3.31B |
| Operating Expenses | 1.30B | 2.16B |
| Gross Profit | 2.66B | 3.64B |
| EBITDA | 1.47B | 1.84B |
| EBIT | 1.36B | 1.55B |
| Interest Expense | 38M | 112M |
| Net Income | 1.06B | 1.30B |
| EPS | 13.17 | 4.59 |
| Fiscal Year | 2025 | 2025 |
Income Statement Analysis: The Bottom-Line Duel
This income statement comparison reveals which company converts revenue into profit most efficiently, reflecting their operational strength.
IDEXX Laboratories, Inc. Analysis
IDEXX’s revenue climbed from 3.2B in 2021 to 4.3B in 2025, with net income rising from 745M to 1.06B. Its gross margin remains robust at 61.8%, while net margin expands to 24.6%, signaling strong profitability. In 2025, IDEXX accelerated EBIT by 19.4%, showcasing growing operational momentum and disciplined cost control.
Agilent Technologies, Inc. Analysis
Agilent’s revenue grew moderately from 6.3B in 2021 to 6.95B in 2025, with net income rising from 1.21B to 1.3B. Gross margin stands at 52.4%, and net margin at 18.8%, both solid but lower than IDEXX. However, EBIT declined 4.3% in 2025, indicating pressure on operating efficiency despite steady revenue growth.
Margin Dominance vs. Revenue Scale
IDEXX leads with superior margin expansion and faster profit growth, reflecting sharper operational efficiency. Agilent boasts higher absolute revenue and net income but faces margin compression and EBIT decline. For investors prioritizing margin strength and earnings momentum, IDEXX’s profile currently offers a more compelling efficiency story.
Financial Ratios Comparison
These vital ratios act as a diagnostic tool to expose the underlying fiscal health, valuation premiums, and capital efficiency of each company:
| Ratios | IDEXX Laboratories, Inc. (IDXX) | Agilent Technologies, Inc. (A) |
|---|---|---|
| ROE | 66.0% | 19.3% |
| ROIC | 40.7% | 12.6% |
| P/E | 51.1 | 31.8 |
| P/B | 33.8 | 6.14 |
| Current Ratio | 1.23 | 1.96 |
| Quick Ratio | 0.90 | 1.52 |
| D/E | 0.05 | 0.50 |
| Debt-to-Assets | 2.2% | 26.4% |
| Interest Coverage | 35.5 | 13.2 |
| Asset Turnover | 1.28 | 0.55 |
| Fixed Asset Turnover | 5.76 | 3.43 |
| Payout ratio | 0% | 21.6% |
| Dividend yield | 0% | 0.68% |
| Fiscal Year | 2025 | 2025 |
Efficiency & Valuation Duel: The Vital Signs
Financial ratios act as a company’s DNA, exposing hidden risks and operational strengths critical for investment decisions.
IDEXX Laboratories, Inc.
IDEXX exhibits exceptional profitability with a 66% ROE and a robust 25% net margin, signaling strong operational efficiency. However, the stock trades at a stretched P/E of 51.15 and P/B of 33.75, indicating premium valuation. The company returns no dividends, instead reinvesting heavily in growth and R&D, supporting long-term value creation.
Agilent Technologies, Inc.
Agilent shows moderate profitability with a 19% ROE and an 18.75% net margin, reflecting stable but less aggressive returns. Its valuation is elevated with a P/E of 31.79 and P/B of 6.14, suggesting some premium but less stretched than IDEXX. Agilent pays a small dividend yield of 0.68%, balancing shareholder returns with ongoing R&D investment.
Premium Valuation vs. Operational Safety
IDEXX commands a premium valuation justified by its superior profitability and reinvestment strategy, yet it carries valuation risk. Agilent offers a safer valuation profile with consistent profitability and dividend income. Investors seeking growth may prefer IDEXX, while those favoring stability might lean toward Agilent.
Which one offers the Superior Shareholder Reward?
IDEXX Laboratories (IDXX) forgoes dividends, investing heavily in growth, reflected in zero payout ratio. Agilent Technologies (A) pays a modest 0.68% dividend yield with a stable 21% payout ratio. IDXX’s aggressive share buybacks and strong free cash flow (13.2/share) fuel capital return. Agilent’s buybacks are less intense; it balances dividends and buybacks. Historically, IDXX’s reinvestment strategy supports higher ROIC, justifying its premium valuation. Agilent offers steady income but lower growth leverage. I conclude IDXX delivers a superior total shareholder return profile in 2026, given its sustainable capital allocation and growth focus.
Comparative Score Analysis: The Strategic Profile
The radar chart reveals the fundamental DNA and trade-offs of both firms, highlighting their financial strengths and valuation nuances:
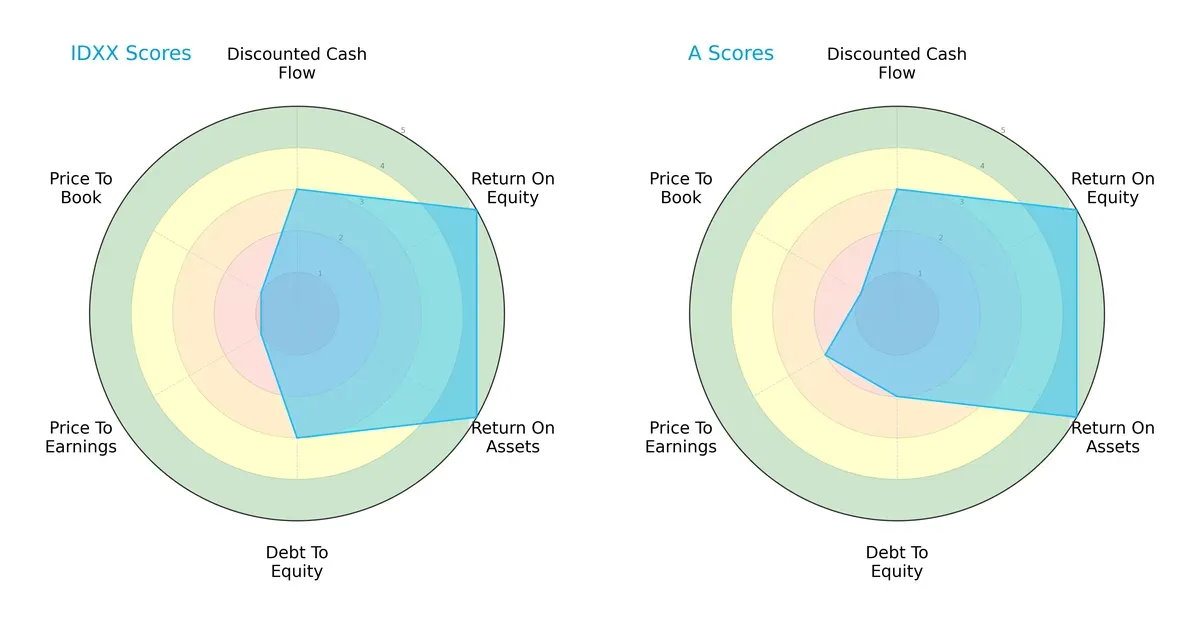
Both IDEXX Laboratories and Agilent Technologies share strong operational efficiency, scoring very favorably on ROE and ROA. IDEXX maintains a more balanced financial profile with a moderate debt-to-equity score of 3, compared to Agilent’s weaker 2. However, IDEXX’s valuation metrics (P/E and P/B) are very unfavorable, signaling potential overvaluation risks. Agilent leans more on its valuation edge with slightly better P/E but still faces challenges in price-to-book. Overall, IDEXX exhibits a robust asset and equity return focus while Agilent shows moderate financial leverage but less attractive valuation.
Bankruptcy Risk: Solvency Showdown
The Altman Z-Score delta clearly favors IDEXX, suggesting a stronger solvency foundation in this cycle:
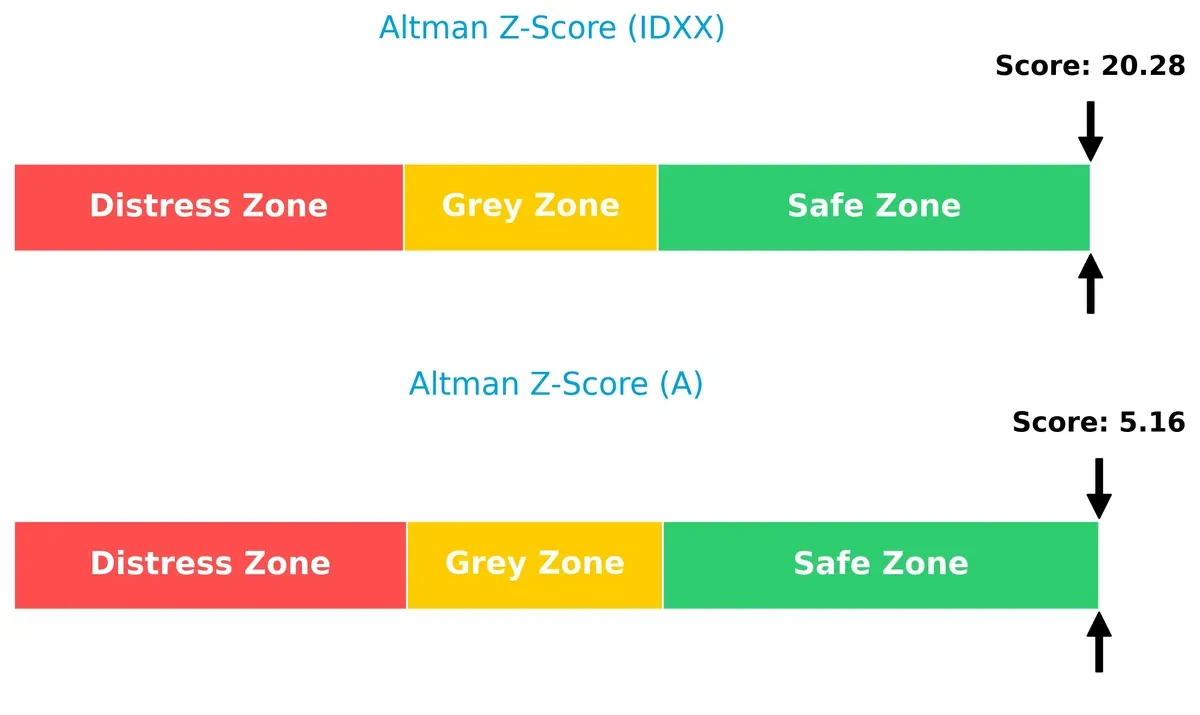
IDEXX scores an impressive 20.3, deeply within the safe zone, signaling exceptional financial stability and minimal bankruptcy risk. Agilent’s 5.16, while also in the safe zone, indicates a more moderate cushion. Historically, such a high Z-score for IDEXX reflects prudent capital allocation and conservative leverage, enhancing its long-term survival prospects compared to Agilent.
Financial Health: Quality of Operations
The Piotroski F-Score comparison confirms IDEXX’s superior operational health and internal strength:
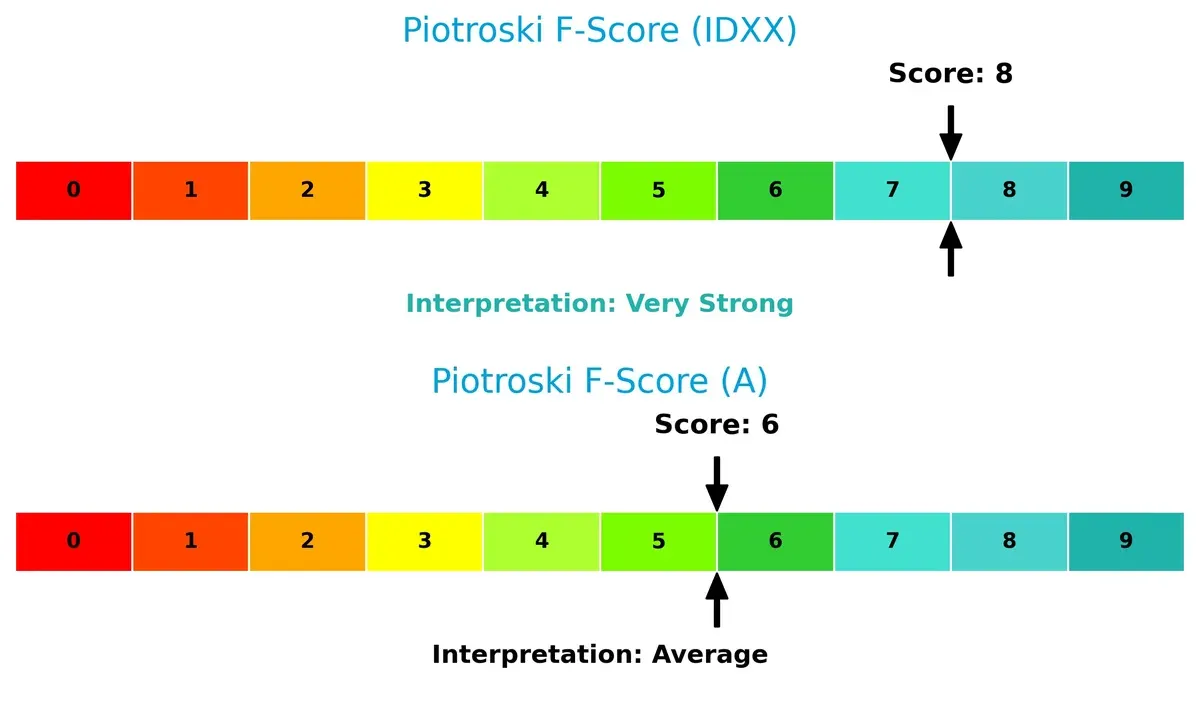
With a Piotroski score of 8, IDEXX demonstrates very strong financial health, showcasing solid profitability, liquidity, and operational efficiency. Agilent’s score of 6 is average, suggesting some internal weaknesses or less efficient capital use that warrant caution. Investors should note IDEXX’s superior internal metrics as a sign of operational resilience and prudent management execution relative to Agilent.
How are the two companies positioned?
This section dissects the operational DNA of IDEXX and Agilent by comparing their revenue distribution and internal dynamics. The goal is to confront their economic moats to reveal which model offers a more resilient, sustainable competitive advantage today.
Revenue Segmentation: The Strategic Mix
This visual comparison dissects how IDEXX Laboratories and Agilent Technologies diversify their revenue streams and reveals their primary sector bets:
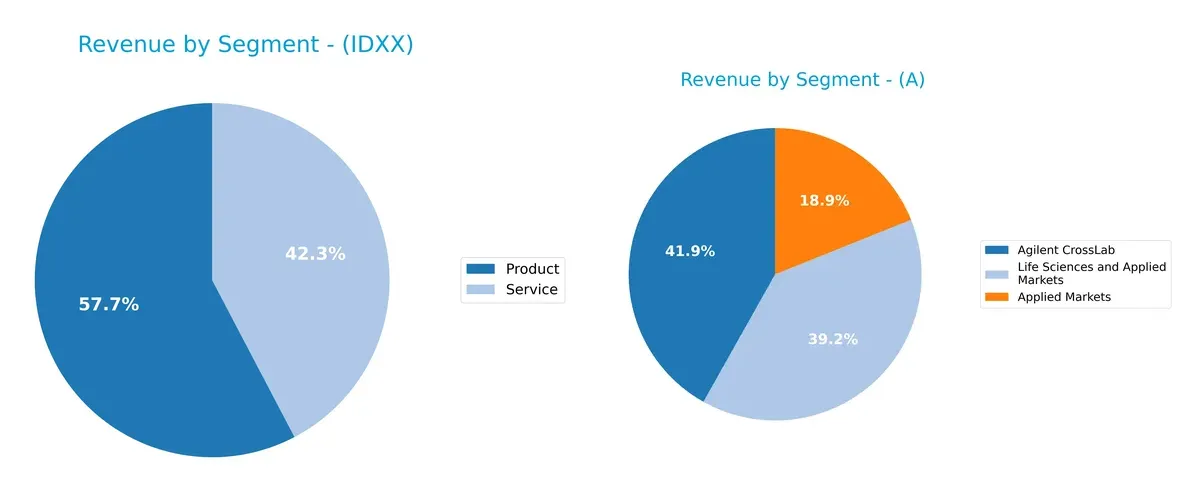
IDEXX leans heavily on two main segments: Product at $2.25B and Service at $1.65B, showing moderate diversification. Agilent presents a broader mix with three sizable segments: Life Sciences and Applied Markets ($3.2B), Agilent CrossLab ($1.64B), and Diagnostics and Genomics ($1.65B). Agilent’s spread reduces concentration risk and signals ecosystem lock-in, while IDEXX’s reliance on product and service revenue anchors it in veterinary diagnostics infrastructure.
Strengths and Weaknesses Comparison
This table compares the Strengths and Weaknesses of IDEXX and Agilent Technologies:
IDEXX Strengths
- Strong profitability with 24.6% net margin and 66% ROE
- Excellent capital efficiency: 40.7% ROIC vs 11.5% WACC
- Low leverage with 2.2% debt-to-assets and strong interest coverage
- High asset turnover indicates efficient use of assets
- Global presence including strong US and EMEA markets
- Consistent revenue growth in products and services
Agilent Strengths
- Broad global diversification across Americas, Asia Pacific, Europe
- Favorable liquidity ratios with 1.96 current and 1.52 quick ratio
- Solid profitability with 18.8% net margin and 19.3% ROE
- Moderate leverage with 26.4% debt-to-assets and good interest coverage
- Strong fixed asset turnover at 3.43
- Diverse revenue streams across CrossLab, Diagnostics, Life Sciences
IDEXX Weaknesses
- High valuation multiples: PE 51.2 and PB 33.8 suggest overvaluation risk
- WACC at 11.5% is higher than ROIC margin comfort zone
- Dividend yield is zero, limiting income appeal
- Neutral liquidity ratios could strain short-term flexibility
- Limited diversification as majority revenue is US-based
- Lack of dividend may deter income-focused investors
Agilent Weaknesses
- Unfavorable PE 31.8 and PB 6.1 multiples indicate valuation concerns
- Dividend yield low at 0.68% reduces income attractiveness
- Asset turnover at 0.55 suggests less operational efficiency
- WACC neutral but lower ROIC of 12.6% narrows spread
- Revenue heavily dependent on Americas and Asia Pacific regions
- Moderate profitability metrics relative to sector benchmarks
Both companies demonstrate favorable overall financial health but balance sheet and valuation characteristics differ notably. IDEXX excels in profitability and efficiency but carries valuation risk and limited diversification. Agilent offers broader geographic exposure and liquidity strengths but faces challenges in operational efficiency and valuation. These contrasting profiles shape distinct strategic considerations.
The Moat Duel: Analyzing Competitive Defensibility
A structural moat remains the sole shield protecting long-term profits from relentless competition and market disruption:
IDEXX Laboratories, Inc.: Intangible Assets & Switching Costs Powerhouse
IDEXX leverages strong intangible assets and switching costs, reflected in a robust 31.7% EBIT margin and 24.6% net margin. Its 29% ROIC premium over WACC signals value creation, though ROIC slightly declines. Expansion into human diagnostics in 2026 could deepen its moat.
Agilent Technologies, Inc.: Diversified Cost Advantage with Global Reach
Agilent’s moat stems from cost advantages and scale across life sciences and diagnostics, evident in a solid 22.3% EBIT margin and steady revenue streams. Its 3.2% ROIC excess over WACC confirms value creation but declining profitability warns of margin pressure. Innovation in genomics and analytics may disrupt markets ahead.
Intangible Assets vs. Scale Efficiency: IDEXX’s Deeper Moat
IDEXX’s higher ROIC spread and margin dominance indicate a wider moat than Agilent’s cost-focused moat. IDEXX’s entrenched switching costs better defend market share amid evolving diagnostics landscapes. I see IDEXX as better positioned to sustain profits over the next cycle.
Which stock offers better returns?
The past year shows divergent trajectories for IDEX Laboratories and Agilent Technologies, with notable shifts in momentum and trading volumes shaping their price action.
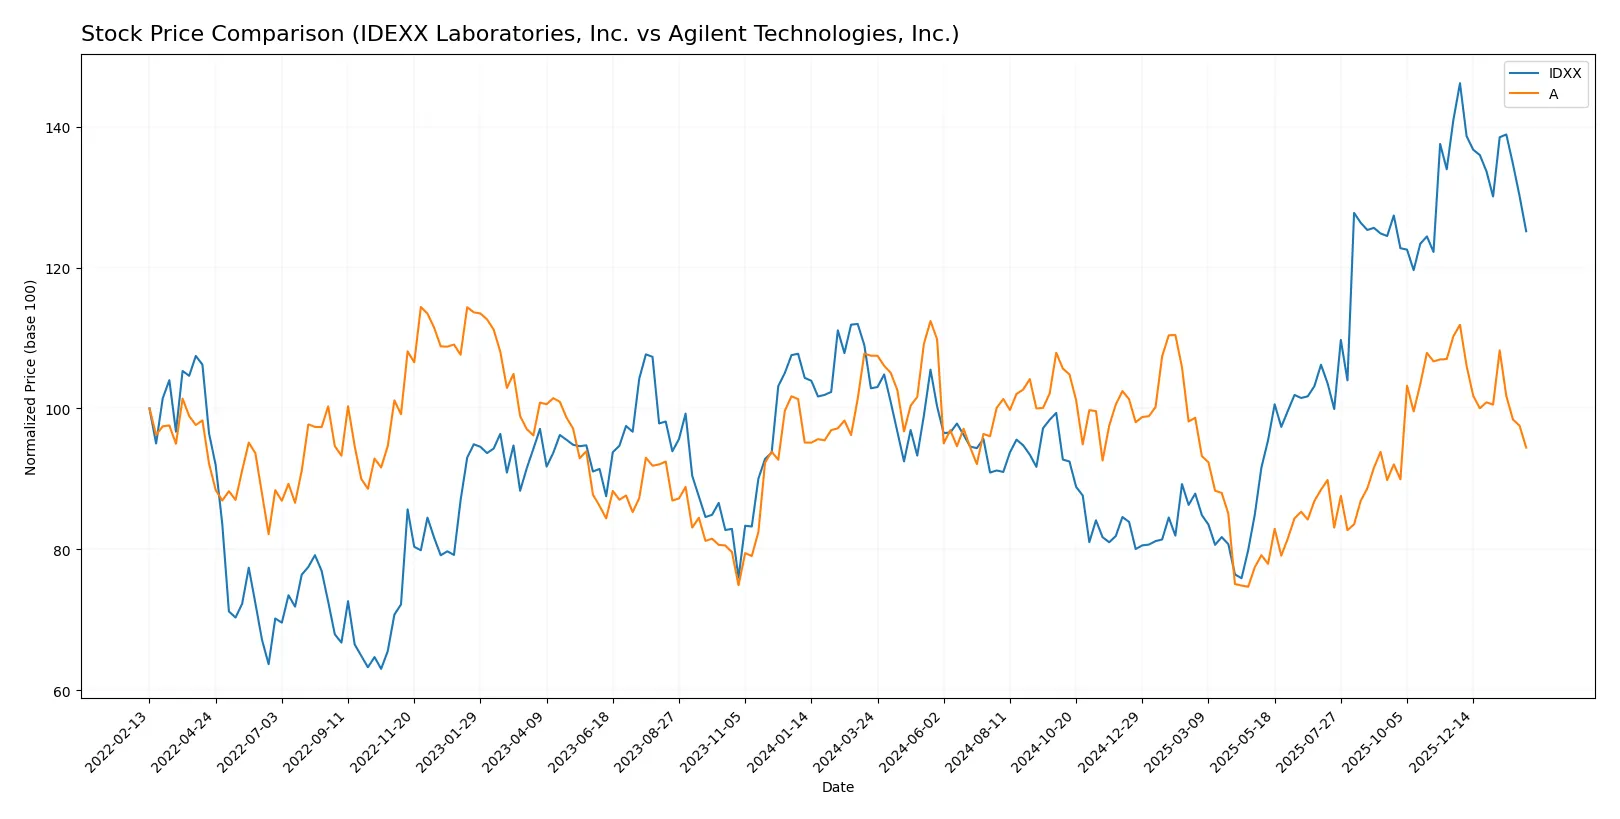
Trend Comparison
IDEXX Laboratories posts a 21.7% price gain over 12 months, marking a bullish trend despite recent deceleration and a notable correction starting late 2025.
Agilent Technologies shows a 12.1% decline over the same period, confirming a bearish trend with decelerating losses and persistent downward pressure since November 2025.
Comparing trends, IDEXX outperforms Agilent, delivering the strongest market performance with a clear upward trajectory over the past year.
Target Prices
Analysts present a bullish consensus for both IDEXX Laboratories and Agilent Technologies.
| Company | Target Low | Target High | Consensus |
|---|---|---|---|
| IDEXX Laboratories, Inc. | 730 | 830 | 789.29 |
| Agilent Technologies, Inc. | 130 | 180 | 166.36 |
The consensus targets imply 22% upside for IDEXX from $645, while Agilent shows 28% potential gain from $130. Both reflect strong confidence above current prices.

Don’t Let Luck Decide Your Entry Point
Optimize your entry points with our advanced ProRealTime indicators. You’ll get efficient buy signals with precise price targets for maximum performance. Start outperforming now!
How do institutions grade them?
IDEXX Laboratories, Inc. Grades
The latest analyst grades for IDEXX Laboratories reflect consistent positive sentiment:
| Grading Company | Action | New Grade | Date |
|---|---|---|---|
| Barclays | Maintain | Overweight | 2026-02-05 |
| BTIG | Maintain | Buy | 2026-02-03 |
| UBS | Maintain | Neutral | 2026-02-03 |
| UBS | Maintain | Neutral | 2025-11-04 |
| JP Morgan | Maintain | Overweight | 2025-11-04 |
| BTIG | Maintain | Buy | 2025-11-04 |
| Morgan Stanley | Maintain | Overweight | 2025-11-04 |
| Stifel | Upgrade | Buy | 2025-10-31 |
| Morgan Stanley | Maintain | Overweight | 2025-08-15 |
| Piper Sandler | Maintain | Neutral | 2025-08-11 |
Agilent Technologies, Inc. Grades
Agilent Technologies has received several upgrades and stable positive ratings recently:
| Grading Company | Action | New Grade | Date |
|---|---|---|---|
| Evercore ISI Group | Upgrade | Outperform | 2026-01-05 |
| Barclays | Upgrade | Overweight | 2025-12-15 |
| Wells Fargo | Maintain | Overweight | 2025-11-25 |
| UBS | Maintain | Buy | 2025-11-25 |
| JP Morgan | Maintain | Overweight | 2025-11-25 |
| Baird | Maintain | Outperform | 2025-11-25 |
| Citigroup | Maintain | Buy | 2025-11-25 |
| Barclays | Maintain | Equal Weight | 2025-11-25 |
| B of A Securities | Maintain | Neutral | 2025-11-25 |
| TD Cowen | Maintain | Buy | 2025-10-14 |
Which company has the best grades?
Agilent Technologies shows a stronger trend of upgrades and “Outperform” ratings compared to IDEXX’s more mixed grades, which include several “Neutral” opinions. This suggests investors might view Agilent as having higher near-term growth potential or stability.
Risks specific to each company
The following categories identify the critical pressure points and systemic threats facing both firms in the 2026 market environment:
1. Market & Competition
IDEXX Laboratories, Inc.
- Faces intense competition in veterinary diagnostics; innovation pace crucial to maintain market share.
Agilent Technologies, Inc.
- Competes broadly in life sciences and diagnostics; diversification helps but also increases complexity.
2. Capital Structure & Debt
IDEXX Laboratories, Inc.
- Very low debt-to-equity (0.05) minimizes financial risk; strong interest coverage improves stability.
Agilent Technologies, Inc.
- Moderate debt-to-equity (0.5) elevates leverage risk; interest coverage remains adequate but less robust.
3. Stock Volatility
IDEXX Laboratories, Inc.
- Beta 1.66 indicates higher volatility than market; investors face greater price swings.
Agilent Technologies, Inc.
- Beta 1.3 suggests moderate volatility, closer to market norms, offering steadier stock behavior.
4. Regulatory & Legal
IDEXX Laboratories, Inc.
- Subject to veterinary and human diagnostics regulations; compliance costs can rise unexpectedly.
Agilent Technologies, Inc.
- Heavily regulated across multiple diagnostic segments; potential for costly compliance and litigation.
5. Supply Chain & Operations
IDEXX Laboratories, Inc.
- Relies on specialized components for diagnostics; supply disruptions could impede product delivery.
Agilent Technologies, Inc.
- Complex global supply chain; operational risks amplified by diverse product lines and geographic reach.
6. ESG & Climate Transition
IDEXX Laboratories, Inc.
- Growing pressure to improve sustainability in animal health market; ESG policies still evolving.
Agilent Technologies, Inc.
- Faces significant ESG scrutiny, especially in chemical and laboratory waste management; proactive initiatives needed.
7. Geopolitical Exposure
IDEXX Laboratories, Inc.
- Moderate exposure; U.S.-centric but with growing international sales vulnerable to trade tensions.
Agilent Technologies, Inc.
- Higher global footprint increases risk from geopolitical instability and tariff fluctuations.
Which company shows a better risk-adjusted profile?
IDEXX’s most significant risk is its elevated stock volatility paired with premium valuation multiples, which could amplify downside in market downturns. Agilent’s leverage and complex global operations pose the largest risks, but its broader diversification provides some cushion. Overall, Agilent shows a more balanced risk profile, supported by stronger liquidity and moderate volatility. The recent low debt-to-equity ratio for IDEXX is reassuring, yet its stretched price multiples raise caution for risk-conscious investors in 2026.
Final Verdict: Which stock to choose?
IDEXX Laboratories stands out with its superpower of exceptional capital efficiency and robust profitability, consistently generating returns far above its cost of capital. Its point of vigilance lies in the stretched valuation multiples, which could pressure future gains. It suits an aggressive growth portfolio willing to pay for premium quality.
Agilent Technologies benefits from a strategic moat built on diversified revenue streams and strong income quality, offering more balance and resilience. Relative to IDEXX, it presents a safer profile with better liquidity and moderate valuation. It fits well within a GARP (Growth at a Reasonable Price) portfolio seeking steady returns with controlled risk.
If you prioritize high-return growth fueled by operational excellence, IDEXX outshines due to its superior ROIC and earnings momentum. However, if you seek better stability and income diversification with a margin of safety, Agilent offers a more balanced risk-reward profile. Both scenarios warrant cautious monitoring of profitability trends and valuation pressures.
Disclaimer: Investment carries a risk of loss of initial capital. The past performance is not a reliable indicator of future results. Be sure to understand risks before making an investment decision.
Go Further
I encourage you to read the complete analyses of IDEXX Laboratories, Inc. and Agilent Technologies, Inc. to enhance your investment decisions: