Home > Comparison > Healthcare > DHR vs A
The strategic rivalry between Danaher Corporation and Agilent Technologies shapes the Healthcare sector’s diagnostics and research landscape. Danaher operates as a diversified industrial powerhouse with broad life sciences and environmental solutions. Agilent focuses on specialized analytical instrumentation and applied chemical markets, emphasizing precision tools. This analysis explores their contrasting operational models and competitive dynamics to identify which company presents a superior risk-adjusted opportunity for a balanced, diversified portfolio.

Table of contents
Companies Overview
Danaher and Agilent stand as pivotal players in the medical diagnostics and research industry, shaping innovation and market dynamics.
Danaher Corporation: Diversified Healthcare Innovator
Danaher dominates the medical diagnostics and research sector with a broad portfolio across Life Sciences, Diagnostics, and Environmental & Applied Solutions. Its revenue streams stem from advanced instruments, consumables, and software servicing pharmaceutical, clinical, industrial, and research clients. In 2026, Danaher focuses strategically on expanding bioprocess technologies and automation to capture growth in gene and cell therapy markets.
Agilent Technologies, Inc.: Precision Analytical Solutions Leader
Agilent specializes in application-focused solutions for life sciences, diagnostics, and chemical markets through chromatography, spectroscopy, and genomics instruments and software. Its revenue engine relies on high-tech tools and consumables paired with laboratory services and analytics. The company’s 2026 strategy emphasizes integrated software services and automation to enhance customer productivity and compliance across scientific workflows.
Strategic Collision: Similarities & Divergences
Both firms compete intensely in life sciences and diagnostics but diverge philosophically—Danaher employs a diversified, multi-segment approach, while Agilent pursues focused, application-specific innovations. The primary battleground lies in advanced laboratory automation and analytics software, where precision and integration drive market share. Their distinct profiles reflect Danaher’s broad industrial scale versus Agilent’s specialized technological niche.
Income Statement Comparison
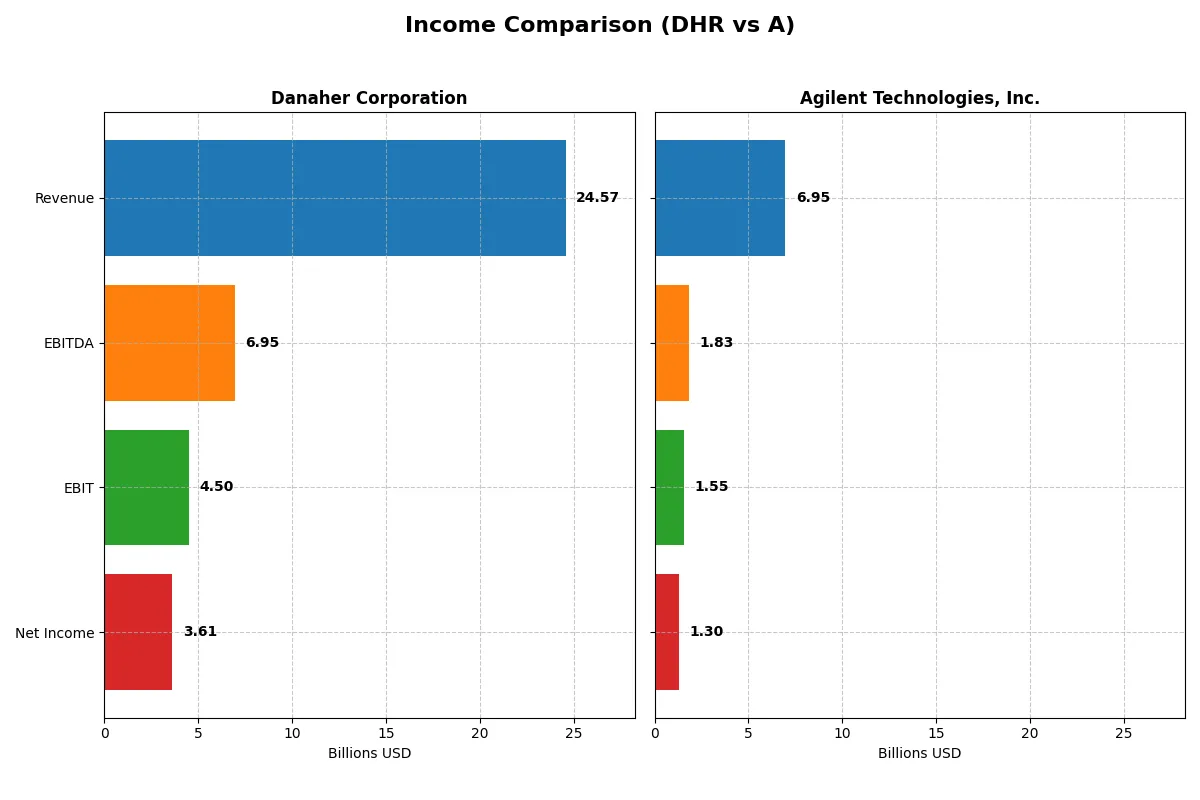
This data dissects the core profitability and scalability of both corporate engines to reveal who dominates the bottom line:
| Metric | Danaher Corporation (DHR) | Agilent Technologies, Inc. (A) |
|---|---|---|
| Revenue | 24.6B | 6.9B |
| Cost of Revenue | 9.6B | 3.3B |
| Operating Expenses | 9.8B | 2.2B |
| Gross Profit | 15.0B | 3.6B |
| EBITDA | 6.9B | 1.8B |
| EBIT | 4.5B | 1.5B |
| Interest Expense | 265M | 112M |
| Net Income | 3.6B | 1.3B |
| EPS | 5.07 | 4.59 |
| Fiscal Year | 2025 | 2025 |
Income Statement Analysis: The Bottom-Line Duel
This income statement comparison reveals which company runs a more efficient and profitable corporate engine in recent years.
Danaher Corporation Analysis
Danaher’s revenue declined 16.6% over five years, falling to $24.6B in 2025, while net income plunged 43.8% to $3.6B. The company sustains a robust 60.9% gross margin but suffers margin pressure, with net margin shrinking to 14.7%. Despite favorable cost control, recent EBIT and net margin contractions signal waning momentum.
Agilent Technologies, Inc. Analysis
Agilent’s revenue grew 9.9% over five years, reaching $6.9B in 2025, with net income rising 7.7% to $1.3B. It maintains a solid 52.4% gross margin and a strong 18.8% net margin, outperforming Danaher on profitability ratios. Though EBIT dipped 4.3% last year, EPS growth of 3.2% indicates steady operational efficiency.
Margin Resilience vs. Growth Stability
Danaher boasts superior gross margin but reveals troubling declines in revenue and net income, eroding overall profitability. Agilent delivers consistent revenue and earnings growth with healthier net margins and EPS improvements. For investors prioritizing stable growth and margin resilience, Agilent’s profile appears more attractive amid Danaher’s recent contraction.
Financial Ratios Comparison
These vital ratios act as a diagnostic tool to expose the underlying fiscal health, valuation premiums, and capital efficiency of the companies compared below:
| Ratios | Danaher Corporation (DHR) | Agilent Technologies, Inc. (A) |
|---|---|---|
| ROE | 6.9% | 19.3% |
| ROIC | 5.7% | 12.6% |
| P/E | 44.8 | 31.8 |
| P/B | 3.08 | 6.14 |
| Current Ratio | 1.87 | 1.96 |
| Quick Ratio | 1.51 | 1.52 |
| D/E | 0.35 | 0.50 |
| Debt-to-Assets | 22.1% | 26.4% |
| Interest Coverage | 19.4 | 13.2 |
| Asset Turnover | 0.29 | 0.55 |
| Fixed Asset Turnover | 4.44 | 3.43 |
| Payout Ratio | 24.3% | 21.6% |
| Dividend Yield | 0.54% | 0.68% |
| Fiscal Year | 2025 | 2025 |
Efficiency & Valuation Duel: The Vital Signs
Ratios serve as a company’s DNA, exposing hidden risks and operational excellence crucial for investor insight.
Danaher Corporation
Danaher shows a modest ROE at 6.9% with a solid net margin of 14.7%, signaling decent profitability but limited equity returns. The stock trades at a stretched P/E of 44.8 and a P/B of 3.08, indicating a premium valuation. Dividend yield is low at 0.54%, suggesting a focus on reinvestment, likely in R&D for growth.
Agilent Technologies, Inc.
Agilent impresses with a strong ROE of 19.3% and a higher net margin of 18.8%, reflecting efficient capital use and profitability. The valuation is relatively expensive with a P/E of 31.8 and P/B of 6.14, showing investor optimism. Dividend yield stands at 0.68%, hinting at some shareholder returns while maintaining growth investments.
Premium Valuation vs. Operational Safety
Agilent offers higher profitability and a better ROE at a lower P/E than Danaher, though its P/B is more stretched. Danaher’s conservative leverage and stable margins provide operational safety. Investors seeking growth with some risk tolerance may prefer Agilent; risk-averse investors might lean toward Danaher’s steadier profile.
Which one offers the Superior Shareholder Reward?
I see Danaher (DHR) and Agilent (A) both distribute cash via dividends and buybacks but differ sharply in scale and sustainability. Danaher yields about 0.54% with a 24% payout ratio, ensuring strong free cash flow coverage at 82%. Its buybacks are steady, supporting shareholder value without overleveraging. Agilent offers a higher yield near 0.68% and a 22% payout ratio but covers dividends less comfortably with 74% free cash flow coverage. Agilent’s buybacks are smaller relative to cash flow, signaling a more conservative capital return approach. Historically in industrial tech, Danaher’s balanced distribution and robust margins favor sustainable, long-term total return. I conclude Danaher offers a superior shareholder reward in 2026 given its stronger FCF backing and disciplined buyback strategy.
Comparative Score Analysis: The Strategic Profile
The radar chart reveals the fundamental DNA and trade-offs of Danaher Corporation and Agilent Technologies, Inc., highlighting their key financial strengths and weaknesses:
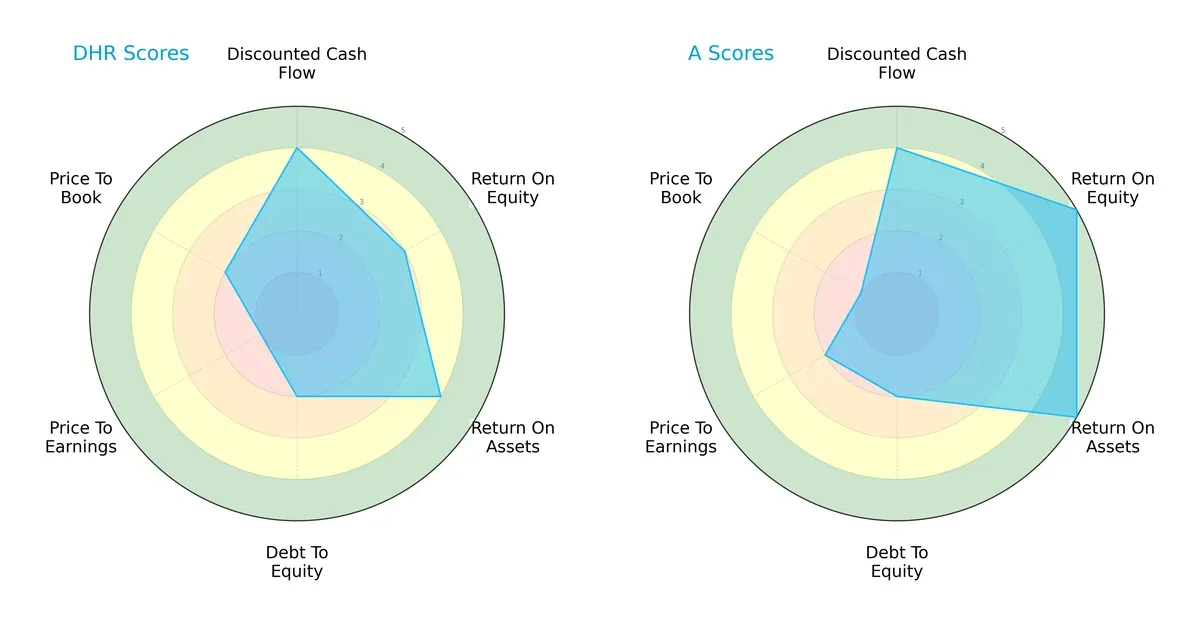
Danaher shows strength in discounted cash flow (4) and return on assets (4), but struggles with valuation metrics (P/E at 1). Agilent excels in return on equity (5) and return on assets (5), with a slightly better P/E score (2) but weaker price-to-book (1). Agilent presents a more balanced profitability profile, while Danaher relies on asset efficiency and discounted cash flow advantages.
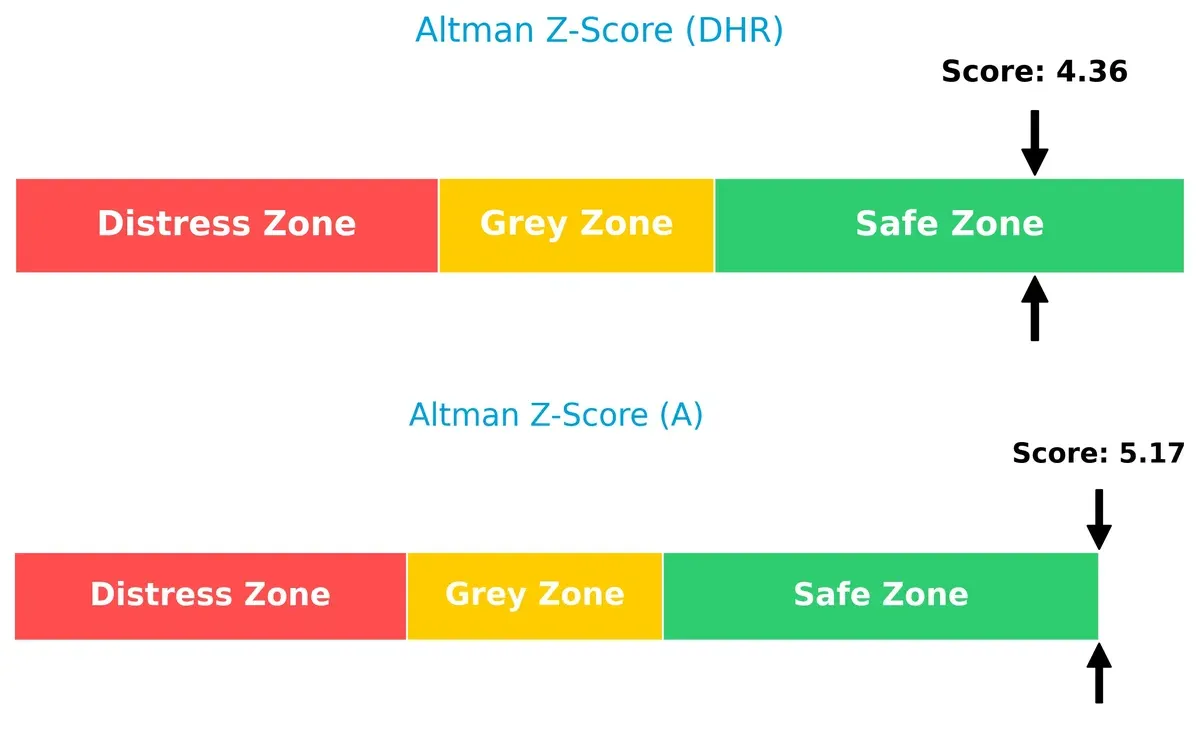
Bankruptcy Risk: Solvency Showdown
The Altman Z-Score difference favors Agilent at 5.17 versus Danaher’s 4.36, both firmly in the safe zone, implying strong long-term solvency for both firms in this cycle:
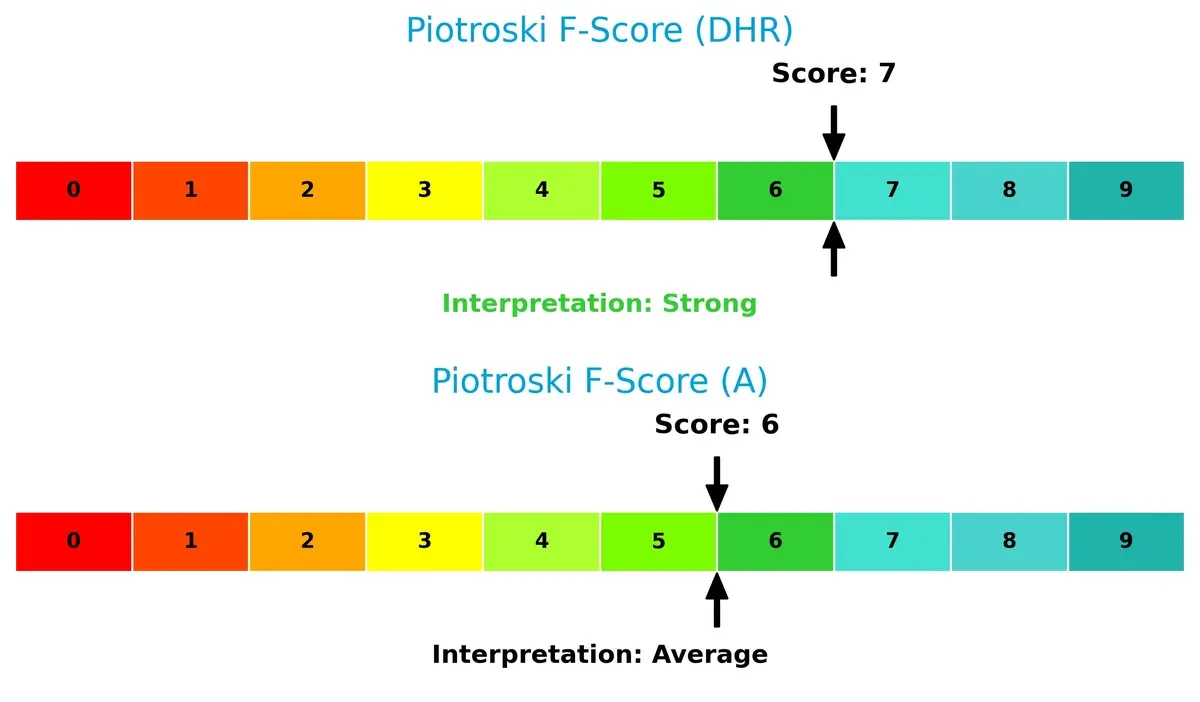
Financial Health: Quality of Operations
Danaher’s Piotroski F-Score of 7 outperforms Agilent’s 6, indicating Danaher maintains stronger internal financial health and fewer red flags in operational metrics:
How are the two companies positioned?
This section dissects the operational DNA of Danaher and Agilent by comparing their revenue distribution and internal dynamics. The goal is to confront their economic moats and identify which business model offers the most resilient, sustainable competitive advantage today.
Revenue Segmentation: The Strategic Mix
This comparison dissects how Danaher Corporation and Agilent Technologies diversify income streams and reveals their primary sector bets:
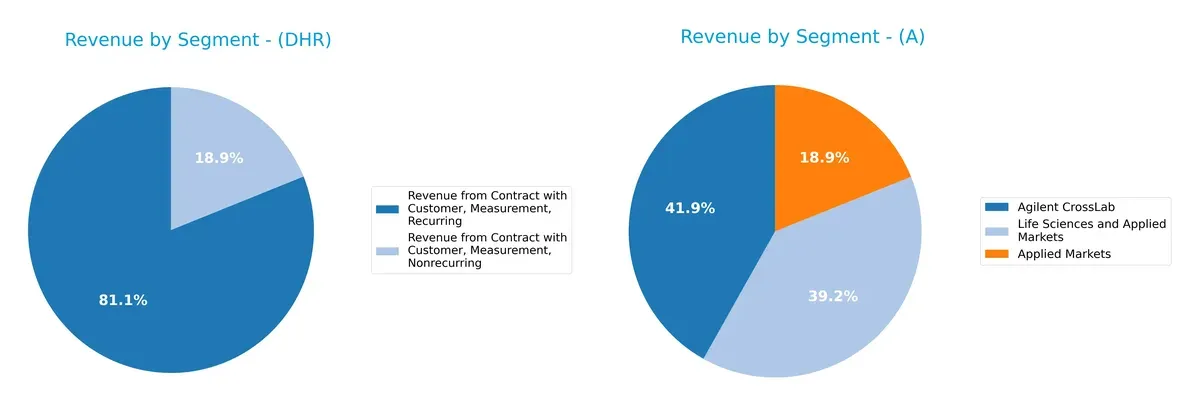
Danaher anchors its revenue heavily in Measurement, with recurring contracts reaching $19.4B in 2024, overshadowing nonrecurring $4.5B. This concentration signals strong ecosystem lock-in and predictable cash flow. Agilent shows a more balanced mix: $3.2B in Life Sciences, $1.6B in Diagnostics, and $1.6B in CrossLab for 2024. Agilent’s broader spread mitigates concentration risk but may dilute infrastructure dominance. Both firms leverage their core strengths differently in complex markets.
Strengths and Weaknesses Comparison
This table compares the strengths and weaknesses of Danaher Corporation and Agilent Technologies, Inc.:
Danaher Corporation Strengths
- Diversified revenue streams with strong recurring measurement contracts
- Favorable net margin at 14.7%
- Solid liquidity ratios: current ratio 1.87 and quick ratio 1.51
- Low debt-to-equity at 0.35 enhances financial stability
- Global presence with significant revenue from North America and other developed markets
- Strong fixed asset turnover at 4.44 indicates efficient use of assets
Agilent Technologies Strengths
- Higher profitability: net margin 18.7%, ROE 19.3%, and ROIC 12.6% all favorable
- Healthy liquidity ratios: current ratio 1.96 and quick ratio 1.52
- Balanced debt with debt-to-equity 0.5 and favorable interest coverage
- Diversified product segments including Life Sciences and Diagnostics
- Global reach across Americas, Asia Pacific, and Europe provides geographic diversification
- Favorable asset turnover at 0.55 supports efficient revenue generation
Danaher Corporation Weaknesses
- Unfavorable ROE at 6.88%, below WACC of 7.67%, signaling limited value creation
- High P/E of 44.8 and P/B of 3.08 suggest expensive valuation
- Lower asset turnover at 0.29 may indicate less efficient revenue use
- Unfavorable dividend yield at 0.54% compared to peers
- Moderate global revenue concentration in fewer regions
- Some reliance on nonrecurring measurement revenue
Agilent Technologies Weaknesses
- Unfavorable valuation multiples: P/E 31.8 and P/B 6.14 are elevated
- Neutral WACC at 9.35% relative to ROIC 12.57% implies moderate capital efficiency
- Dividend yield low at 0.68%, limiting income appeal
- Asset turnover neutral at 0.55, room to improve operational efficiency
- Slightly higher debt-to-assets ratio at 26.35% increases leverage risk
Both companies show favorable overall financial profiles with diversified portfolios and global footprints. Danaher’s strength lies in liquidity and asset utilization, but its lower ROE versus WACC warns of capital inefficiency. Agilent delivers superior profitability metrics but faces risks from high valuation multiples and leverage. Each company’s strategic focus must balance growth with prudent capital allocation.
The Moat Duel: Analyzing Competitive Defensibility
A structural moat is the only thing protecting long-term profits from the erosion of competition. Let’s dissect the economic moats of Danaher and Agilent:
Danaher Corporation: Diversified Innovation Moat
Danaher relies on intangible assets and diversified technologies across life sciences and diagnostics. Its moat shows in stable margins but declining ROIC signals weakening competitive edge in 2026.
Agilent Technologies, Inc.: Focused Efficiency Moat
Agilent’s moat stems from cost advantage and specialized analytical instruments. It sustains higher ROIC than Danaher, though profitability trends slightly decline, with growth potential in emerging markets.
Moat Durability: Diversification vs. Focused Capital Efficiency
Agilent’s slightly favorable moat outpaces Danaher’s deteriorating value creation. I see Agilent better equipped to defend market share amid intensifying competition and shifting technology demands.
Which stock offers better returns?
Over the past 12 months, both Danaher Corporation and Agilent Technologies, Inc. experienced bearish trends with notable price declines and shifting volume dynamics.
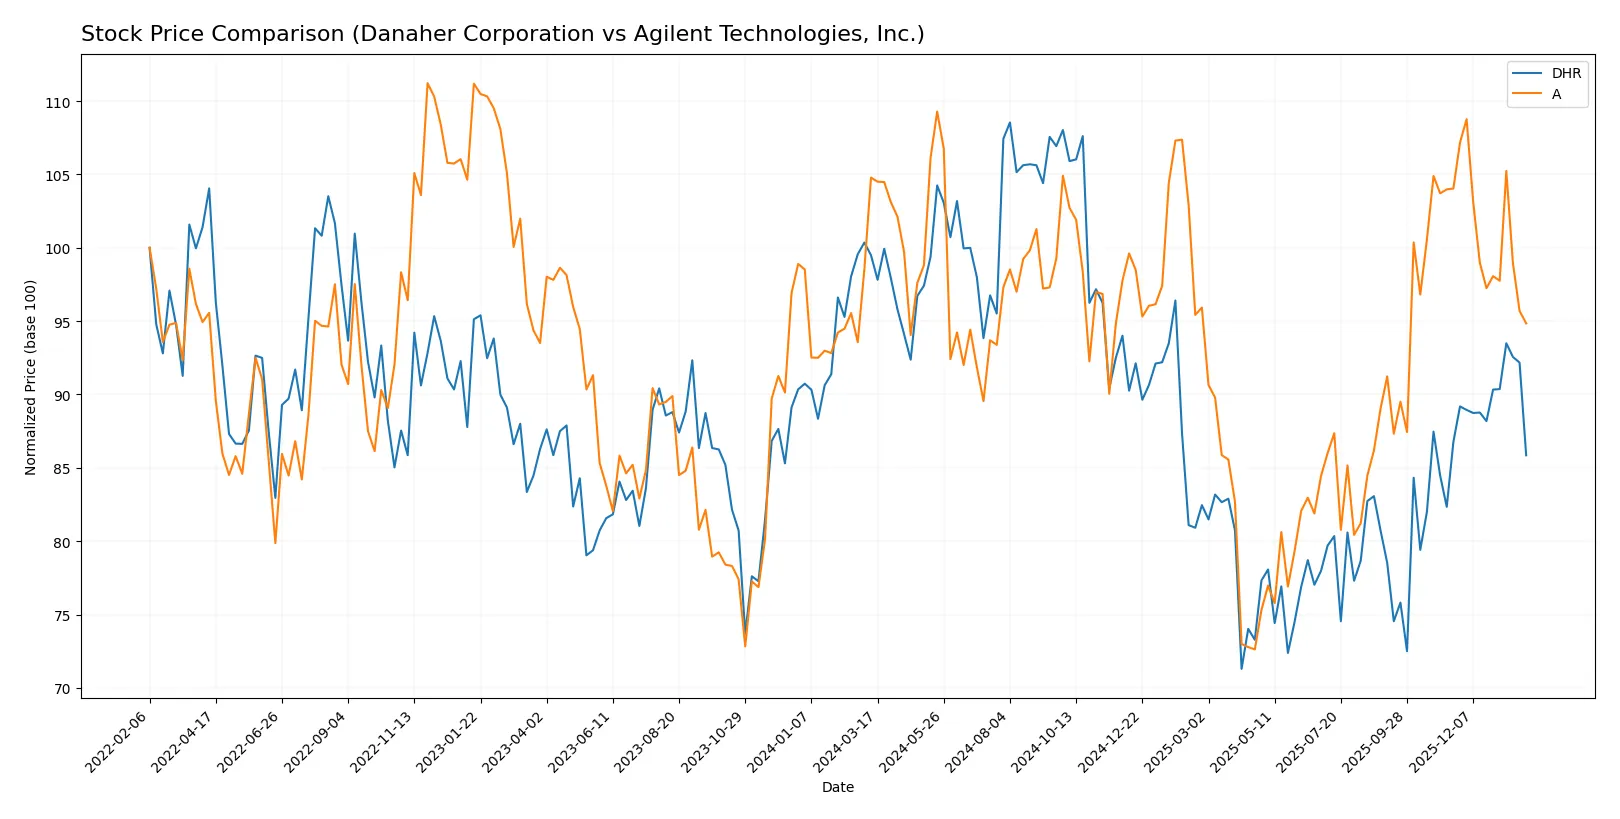
Trend Comparison
Danaher Corporation’s stock declined 13.72% over the last year, showing a bearish trend with accelerating downward momentum and high volatility (26.61 std dev). The price ranged between 181.77 and 276.75.
Agilent Technologies, Inc. fell 9.48% over the same period, also bearish but with decelerating decline and lower volatility (12.85 std dev). Its price fluctuated between 102.48 and 154.23.
Danaher’s steeper loss and accelerating downtrend contrast with Agilent’s milder, decelerating decline. Danaher delivered the weaker market performance in this comparison.
Target Prices
Analysts present a cautiously optimistic consensus for Danaher Corporation and Agilent Technologies, suggesting moderate upside potential.
| Company | Target Low | Target High | Consensus |
|---|---|---|---|
| Danaher Corporation | 220 | 270 | 252.33 |
| Agilent Technologies, Inc. | 130 | 180 | 166.36 |
Danaher’s target consensus stands about 15% above the current price of $218.89, reflecting confidence in its healthcare segment. Agilent’s consensus at $166.36 implies roughly 24% upside from $133.85, signaling solid growth expectations but with moderate risk.

Don’t Let Luck Decide Your Entry Point
Optimize your entry points with our advanced ProRealTime indicators. You’ll get efficient buy signals with precise price targets for maximum performance. Start outperforming now!
How do institutions grade them?
Here is a summary of recent grades assigned to Danaher Corporation and Agilent Technologies, Inc.:
Danaher Corporation Grades
The table below lists recent institutional grades for Danaher Corporation.
| Grading Company | Action | New Grade | Date |
|---|---|---|---|
| JP Morgan | maintain | Overweight | 2026-01-29 |
| Jefferies | maintain | Buy | 2026-01-29 |
| TD Cowen | maintain | Buy | 2026-01-07 |
| Guggenheim | maintain | Buy | 2026-01-05 |
| Wells Fargo | maintain | Equal Weight | 2025-12-15 |
| Wells Fargo | maintain | Equal Weight | 2025-10-23 |
| Barclays | maintain | Overweight | 2025-10-22 |
| TD Cowen | maintain | Buy | 2025-10-22 |
| Rothschild & Co | downgrade | Neutral | 2025-10-08 |
| Evercore ISI Group | maintain | Outperform | 2025-10-07 |
Agilent Technologies, Inc. Grades
The table below lists recent institutional grades for Agilent Technologies, Inc.
| Grading Company | Action | New Grade | Date |
|---|---|---|---|
| Evercore ISI Group | upgrade | Outperform | 2026-01-05 |
| Barclays | upgrade | Overweight | 2025-12-15 |
| Barclays | maintain | Equal Weight | 2025-11-25 |
| Citigroup | maintain | Buy | 2025-11-25 |
| UBS | maintain | Buy | 2025-11-25 |
| B of A Securities | maintain | Neutral | 2025-11-25 |
| JP Morgan | maintain | Overweight | 2025-11-25 |
| Wells Fargo | maintain | Overweight | 2025-11-25 |
| Baird | maintain | Outperform | 2025-11-25 |
| TD Cowen | maintain | Buy | 2025-10-14 |
Which company has the best grades?
Both companies receive strong institutional support with multiple “Buy,” “Overweight,” and “Outperform” ratings. Danaher shows some recent downgrades, unlike Agilent, which has seen upgrades lately. Investors may view Agilent’s improving grades as a signal of growing confidence.
Risks specific to each company
The following categories identify the critical pressure points and systemic threats facing both firms in the 2026 market environment:
1. Market & Competition
Danaher Corporation
- Large scale and diversified segments offer resilience but asset turnover remains low, signaling efficiency challenges.
Agilent Technologies, Inc.
- Stronger margins and ROIC reflect competitive strengths, but higher beta suggests more market sensitivity.
2. Capital Structure & Debt
Danaher Corporation
- Conservative debt-to-equity ratio (0.35) and high interest coverage (17x) reduce financial risk.
Agilent Technologies, Inc.
- Higher leverage (0.5 D/E) and lower interest coverage (13.8x) increase vulnerability but remain manageable.
3. Stock Volatility
Danaher Corporation
- Beta at 0.93 shows below-market volatility, implying more stable stock behavior.
Agilent Technologies, Inc.
- Beta at 1.29 indicates above-market volatility, translating to greater price swings and investment risk.
4. Regulatory & Legal
Danaher Corporation
- Exposure to global healthcare regulations may impact diagnostics and life sciences segments.
Agilent Technologies, Inc.
- Similar regulatory environment with added risks in genomics and diagnostics compliance complexity.
5. Supply Chain & Operations
Danaher Corporation
- Extensive global operations and diverse product lines reduce supply chain concentration risks.
Agilent Technologies, Inc.
- More focused product scope could increase vulnerability to supply disruptions in key components.
6. ESG & Climate Transition
Danaher Corporation
- Increasing ESG integration in water and environmental solutions aligns with climate transition opportunities.
Agilent Technologies, Inc.
- Focus on applied chemical markets demands ongoing adaptation to stricter environmental standards.
7. Geopolitical Exposure
Danaher Corporation
- Broad international footprint exposes Danaher to geopolitical tensions but offers geographic risk diversification.
Agilent Technologies, Inc.
- Concentrated US operations somewhat limit geopolitical risks but reduce global market diversification.
Which company shows a better risk-adjusted profile?
Danaher’s strongest risk factor is its relatively low asset turnover, which may hinder capital efficiency despite a solid balance sheet. Agilent faces heightened stock volatility and greater financial leverage, increasing its exposure to market swings. Danaher’s lower beta and superior interest coverage suggest a more stable risk-adjusted profile. Recent ratio data confirm Danaher’s prudent capital structure and operational resilience, justifying greater investor confidence in volatile markets.
Final Verdict: Which stock to choose?
Danaher Corporation’s superpower lies in its robust operational efficiency and solid balance sheet, supporting steady cash generation despite recent profitability headwinds. A point of vigilance is its declining return on invested capital, signaling caution on long-term value creation. It suits portfolios targeting stable industrial exposure with a moderate risk appetite.
Agilent Technologies commands a strategic moat through its superior return on equity and consistent value creation, underpinned by a healthier growth trajectory. It offers a relatively safer profile with stronger income statement metrics and financial scores. This stock aligns well with investors pursuing GARP—Growth at a Reasonable Price—strategies.
If you prioritize value preservation and operational resilience, Danaher’s efficiency and financial stability make it a compelling choice despite its ROIC challenges. However, if you seek growth backed by proven capital efficiency and stronger earnings momentum, Agilent outshines with better profitability and a more favorable long-term growth outlook. Both require careful monitoring of market conditions and company-specific risks.
Disclaimer: Investment carries a risk of loss of initial capital. The past performance is not a reliable indicator of future results. Be sure to understand risks before making an investment decision.
Go Further
I encourage you to read the complete analyses of Danaher Corporation and Agilent Technologies, Inc. to enhance your investment decisions: