In the dynamic healthcare sector, Agilent Technologies, Inc. and Charles River Laboratories International, Inc. stand out as leaders in medical diagnostics and research services. Both companies innovate within overlapping markets, focusing on advancing life sciences and pharmaceutical development. Their distinct yet complementary approaches make them compelling candidates for comparison. In this article, I will help you identify which company offers the most promising investment opportunity for your portfolio.
Table of contents
Companies Overview
I will begin the comparison between Agilent Technologies, Inc. and Charles River Laboratories International, Inc. by providing an overview of these two companies and their main differences.
Agilent Technologies Overview
Agilent Technologies, Inc. delivers application-focused solutions to the life sciences, diagnostics, and applied chemical markets globally. Its offerings include advanced instrumentation systems such as liquid chromatography and mass spectrometry, diagnostic arrays, reagents, and laboratory automation. Agilent operates through multiple segments providing both products and services, targeting customers via direct sales and distribution channels. The company is headquartered in Santa Clara, California, and employs around 17,900 people.
Charles River Laboratories Overview
Charles River Laboratories International, Inc. is a non-clinical contract research organization specializing in drug discovery, non-clinical development, and safety testing services worldwide. It operates three main segments: Research Models and Services, Discovery and Safety Assessment, and Manufacturing Solutions, supporting pharmaceutical and biotechnology clients. Headquartered in Wilmington, Massachusetts, Charles River employs about 18,700 people and focuses on providing research models, safety assessment, and quality control testing.
Key similarities and differences
Both companies operate within the healthcare sector focusing on diagnostics and research, serving the pharmaceutical and life sciences markets. Agilent primarily supplies analytical instruments, consumables, and software, while Charles River provides contract research services and specialized testing. Agilent’s business model emphasizes product sales and related services, whereas Charles River centers on research models and outsourced drug development support. Both companies maintain global operations with significant employee bases and publicly trade on the NYSE.
Income Statement Comparison
The table below compares the key income statement metrics for Agilent Technologies, Inc. and Charles River Laboratories International, Inc. based on their most recent fiscal year data.
| Metric | Agilent Technologies, Inc. | Charles River Laboratories International, Inc. |
|---|---|---|
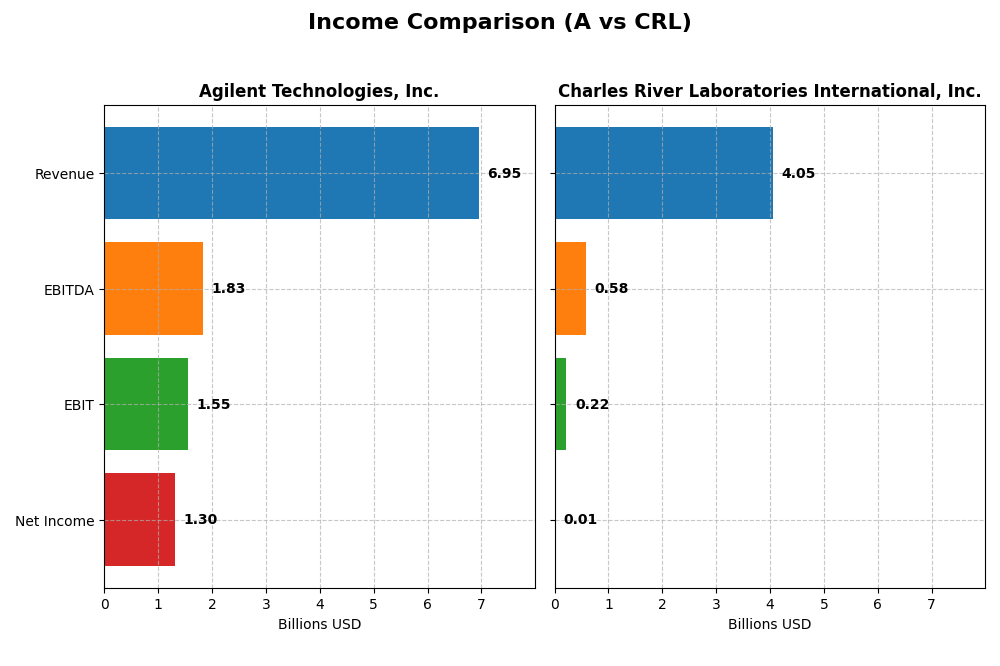
| Market Cap | 42.1B | 10.9B |
| Revenue | 6.95B | 4.05B |
| EBITDA | 1.84B | 581M |
| EBIT | 1.55B | 219M |
| Net Income | 1.30B | 10.3M |
| EPS | 4.59 | 0.20 |
| Fiscal Year | 2025 | 2024 |
Income Statement Interpretations
Agilent Technologies, Inc.
Agilent Technologies showed a generally positive trend in revenue and net income from 2021 to 2025, with revenue rising from $6.3B to $6.9B and net income increasing from $1.21B to $1.30B. Margins remained strong, with a gross margin of 52.43% and net margin at 18.75%. The latest year saw moderate revenue growth (6.73%) but slight margin compression, indicated by a decline in EBIT and net margin.
Charles River Laboratories International, Inc.
Charles River Laboratories experienced mixed results, with revenue increasing overall from $2.9B in 2020 to $4.05B in 2024, despite a recent 1.92% decline. Net income deteriorated sharply, falling from $364M in 2020 to $10M in 2024, reflecting a major margin contraction to 0.25%. The most recent year showed significant declines in EBIT and EPS, signaling operational challenges.
Which one has the stronger fundamentals?
Agilent Technologies presents stronger fundamentals with consistent revenue and net income growth, favorable margins, and a positive overall income statement evaluation. In contrast, Charles River Laboratories shows unfavorable trends in profitability and margin declines, with net income and EPS sharply falling despite revenue growth over the longer term. This indicates Agilent’s relative resilience in income generation.
Financial Ratios Comparison
The table below presents a side-by-side comparison of key financial ratios for Agilent Technologies, Inc. and Charles River Laboratories International, Inc. for their most recent fiscal years.
| Ratios | Agilent Technologies, Inc. (2025) | Charles River Laboratories International, Inc. (2024) |
|---|---|---|
| ROE | 19.3% | 0.3% |
| ROIC | 12.6% | 0.9% |
| P/E | 31.8 | 921.1 |
| P/B | 6.14 | 2.74 |
| Current Ratio | 1.96 | 1.41 |
| Quick Ratio | 1.52 | 1.13 |
| D/E (Debt to Equity) | 0.50 | 0.79 |
| Debt-to-Assets | 26.4% | 36.2% |
| Interest Coverage | 13.2 | 1.80 |
| Asset Turnover | 0.55 | 0.54 |
| Fixed Asset Turnover | 3.43 | 2.01 |
| Payout ratio | 21.6% | 0% |
| Dividend yield | 0.68% | 0% |
Interpretation of the Ratios
Agilent Technologies, Inc.
Agilent exhibits strong profitability with favorable net margin (18.75%), ROE (19.33%), and ROIC (12.57%), alongside solid liquidity indicated by current (1.96) and quick ratios (1.52). However, high valuation multiples such as a P/E of 31.79 and P/B of 6.14 raise concerns. The company pays dividends with a low yield of 0.68%, suggesting cautious income returns.
Charles River Laboratories International, Inc.
Charles River shows weak profitability ratios: net margin (0.25%), ROE (0.3%), and ROIC (0.95%) are unfavorable, reflecting operational challenges. Liquidity ratios are mixed, with a quick ratio favorable at 1.13 but current ratio neutral at 1.41. The firm does not pay dividends, possibly prioritizing reinvestment or growth, as indicated by the absence of dividend yield.
Which one has the best ratios?
Agilent Technologies demonstrates a predominantly favorable ratio profile, with 64.29% of ratios positive versus only 21.43% unfavorable, suggesting overall financial strength. In contrast, Charles River Laboratories has a less favorable ratio distribution, with 42.86% unfavorable and only 7.14% favorable ratios. Thus, Agilent presents the stronger financial metrics between the two.
Strategic Positioning
This section compares the strategic positioning of Agilent Technologies, Inc. and Charles River Laboratories International, Inc., focusing on Market position, Key segments, and Exposure to technological disruption:
Agilent Technologies, Inc.
- Leading in life sciences and diagnostics markets with strong competitive pressure.
- Diversified segments including Life Sciences, Diagnostics, and CrossLab services driving growth.
- Exposure through advanced analytical instruments and software in evolving life sciences fields.
Charles River Laboratories International, Inc.
- Focused on non-clinical contract research with moderate competitive pressure.
- Concentrated in Research Models, Safety Assessment, and Manufacturing services.
- Exposure via drug discovery and safety testing services, reliant on biotech innovation.
Agilent Technologies, Inc. vs Charles River Laboratories International, Inc. Positioning
Agilent exhibits a diversified business model across diagnostics, applied markets, and lab services, offering broad market exposure. Charles River is more concentrated in contract research and testing services, which may limit segment flexibility but focus expertise.
Which has the best competitive advantage?
Agilent shows a slightly favorable moat with value creation despite declining profitability, while Charles River’s moat is very unfavorable, reflecting value destruction and sharply declining returns on invested capital.
Stock Comparison
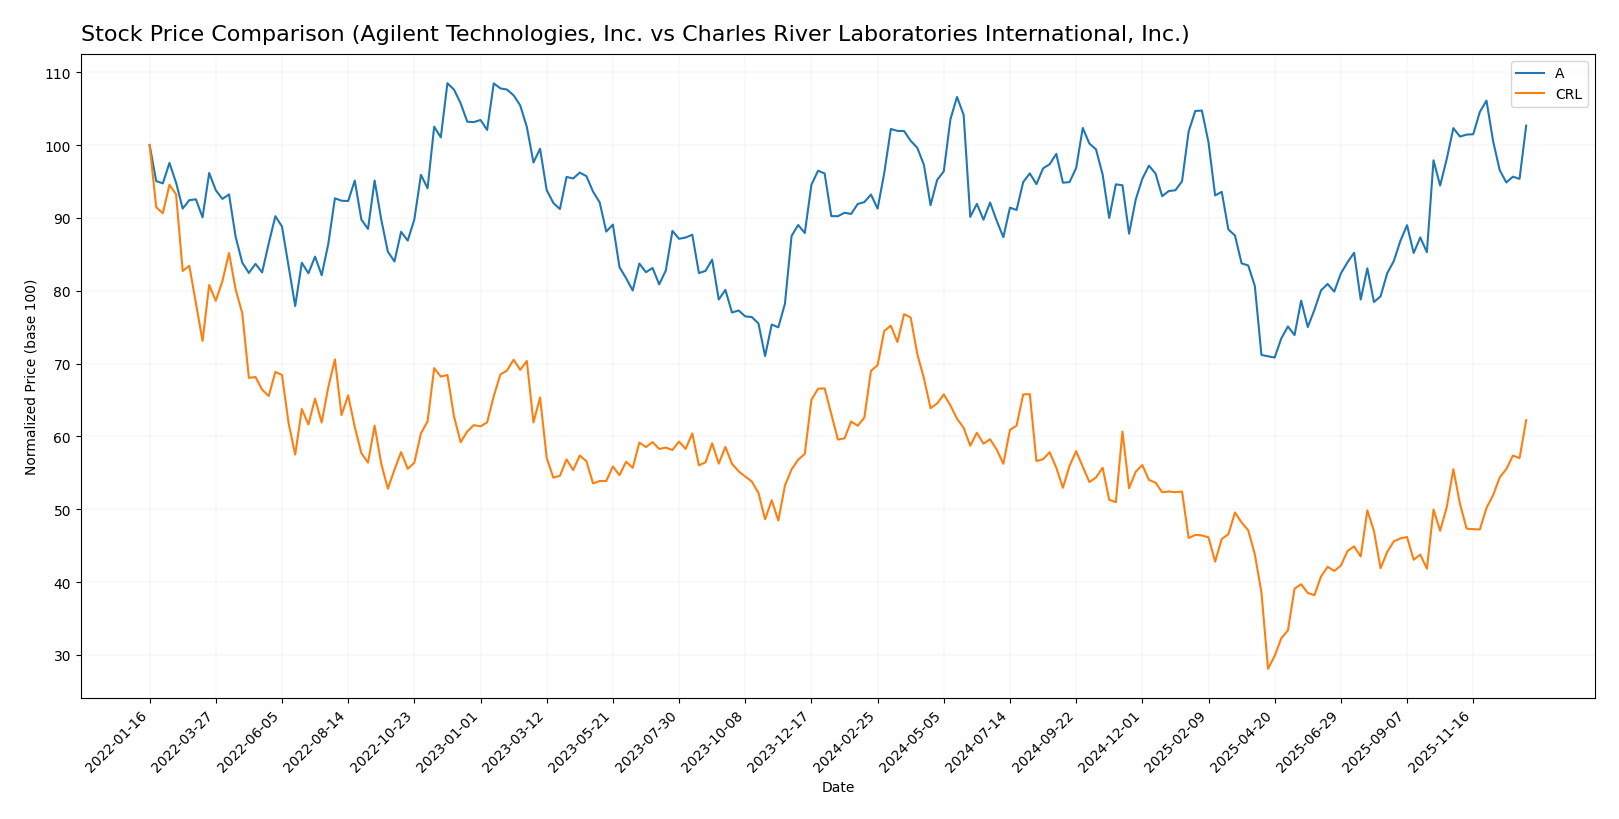
The stock price movements of Agilent Technologies, Inc. and Charles River Laboratories International, Inc. over the past year reveal contrasting trends, with Agilent showing steady gains and Charles River experiencing notable volatility and a recent rebound.
Trend Analysis
Agilent Technologies, Inc. (A) displayed a 10.15% price increase over the past 12 months, indicating a bullish trend with deceleration in momentum. The stock ranged from a low of 102.48 to a high of 154.23, with moderate volatility (std deviation 12.84).
Charles River Laboratories International, Inc. (CRL) recorded a -9.82% price change over the same period, reflecting a bearish trend with accelerating downward movement. The stock showed high volatility (std deviation 36.13), hitting a low of 99.75 and a high of 272.57, but has recently rebounded with a 12.11% gain.
Comparing the two, Agilent Technologies delivered the highest market performance over the past year, combining positive returns with more stable trading dynamics than Charles River Laboratories.
Target Prices
The current analyst consensus indicates optimistic price targets for both Agilent Technologies, Inc. and Charles River Laboratories International, Inc.
| Company | Target High | Target Low | Consensus |
|---|---|---|---|
| Agilent Technologies, Inc. | 180 | 130 | 165 |
| Charles River Laboratories, Inc. | 224 | 185 | 204.86 |
Analysts expect Agilent’s stock to appreciate moderately from its current price of $148.52, while Charles River Laboratories shows potential for a slight increase from $220.91.
Analyst Opinions Comparison
This section compares analysts’ ratings and grades for Agilent Technologies, Inc. (A) and Charles River Laboratories International, Inc. (CRL):
Rating Comparison
A Rating
- Rating: B+, considered very favorable by analysts.
- Discounted Cash Flow Score: 4, indicating favorable valuation expectations.
- ROE Score: 5, a very favorable measure of efficient profit generation.
- ROA Score: 5, very favorable, demonstrating effective asset utilization.
- Debt To Equity Score: 2, moderate, suggesting some financial risk.
- Overall Score: 3, moderate summary of financial standing.
CRL Rating
- Rating: C, also considered very favorable by analysts.
- Discounted Cash Flow Score: 4, indicating favorable valuation expectations.
- ROE Score: 1, very unfavorable, showing low efficiency in generating profit from equity.
- ROA Score: 1, very unfavorable, indicating poor asset utilization.
- Debt To Equity Score: 1, very unfavorable, reflecting high financial risk from debt levels.
- Overall Score: 2, moderate but lower than A, indicating a weaker overall financial position.
Which one is the best rated?
Based strictly on the provided data, Agilent Technologies (A) holds higher scores in return on equity, return on assets, and debt-to-equity metrics, resulting in a better overall rating than Charles River Laboratories (CRL), which has notably lower performance scores in these key areas.
Scores Comparison
The scores comparison between Agilent Technologies and Charles River Laboratories is as follows:
Agilent Technologies Scores
- Altman Z-Score: 5.21, indicating a safe financial zone with low bankruptcy risk.
- Piotroski Score: 6, reflecting average financial strength and value potential.
Charles River Laboratories Scores
- Altman Z-Score: 2.27, placing the company in a grey zone with moderate bankruptcy risk.
- Piotroski Score: 6, also reflecting average financial strength and value potential.
Which company has the best scores?
Agilent Technologies shows a stronger Altman Z-Score, indicating better financial stability than Charles River Laboratories. Both companies have the same average Piotroski Score, suggesting similar financial strength from a value investment perspective.
Grades Comparison
I present below a comparison of the latest available grades for Agilent Technologies, Inc. and Charles River Laboratories International, Inc.:
Agilent Technologies, Inc. Grades
The table summarizes recent grades and rating actions by major grading companies for Agilent Technologies, Inc.:
| Grading Company | Action | New Grade | Date |
|---|---|---|---|
| Evercore ISI Group | Upgrade | Outperform | 2026-01-05 |
| Barclays | Upgrade | Overweight | 2025-12-15 |
| JP Morgan | Maintain | Overweight | 2025-11-25 |
| Wells Fargo | Maintain | Overweight | 2025-11-25 |
| B of A Securities | Maintain | Neutral | 2025-11-25 |
| UBS | Maintain | Buy | 2025-11-25 |
| Barclays | Maintain | Equal Weight | 2025-11-25 |
| Citigroup | Maintain | Buy | 2025-11-25 |
| Baird | Maintain | Outperform | 2025-11-25 |
| TD Cowen | Maintain | Buy | 2025-10-14 |
Agilent shows mostly stable to improving grades, with recent upgrades and several firms maintaining buy or outperform ratings.
Charles River Laboratories International, Inc. Grades
The table summarizes recent grades and rating actions by major grading companies for Charles River Laboratories International, Inc.:
| Grading Company | Action | New Grade | Date |
|---|---|---|---|
| Mizuho | Maintain | Neutral | 2025-12-18 |
| JP Morgan | Maintain | Neutral | 2025-12-15 |
| Barclays | Maintain | Overweight | 2025-12-15 |
| Morgan Stanley | Maintain | Equal Weight | 2025-11-11 |
| TD Cowen | Maintain | Buy | 2025-11-10 |
| Baird | Upgrade | Outperform | 2025-11-06 |
| Barclays | Maintain | Overweight | 2025-11-06 |
| JP Morgan | Maintain | Neutral | 2025-11-06 |
| Mizuho | Maintain | Neutral | 2025-10-17 |
| William Blair | Upgrade | Outperform | 2025-10-06 |
Charles River Laboratories holds mostly stable ratings with some upgrades to outperform and a mix of neutral and overweight ratings.
Which company has the best grades?
Both companies have a consensus rating of “Buy,” but Agilent Technologies has more consistent upgrades and higher frequency of outperform and buy ratings. This suggests a stronger positive sentiment among analysts, potentially affecting investor confidence differently compared to Charles River Laboratories.
Strengths and Weaknesses
Below is a comparative overview of key strengths and weaknesses of Agilent Technologies, Inc. (A) and Charles River Laboratories International, Inc. (CRL) based on the latest available data.
| Criterion | Agilent Technologies, Inc. (A) | Charles River Laboratories International, Inc. (CRL) |
|---|---|---|
| Diversification | High diversification with strong segments in Life Sciences, Diagnostics, and Applied Markets; revenue exceeds $6B across segments in 2025. | Moderate diversification primarily in Discovery and Safety Assessment, Manufacturing Support, and Research Models; total revenue around $4B in 2024. |
| Profitability | Favorable profitability metrics: net margin 18.75%, ROE 19.33%, ROIC 12.57%; consistent value creation with ROIC > WACC. | Very low profitability: net margin 0.25%, ROE 0.3%, ROIC 0.95%; company is shedding value with ROIC below WACC. |
| Innovation | Strong innovation indicated by favorable fixed asset turnover (3.43) and continued investment in diagnostics and genomics. | Innovation appears weaker with neutral fixed asset turnover (2.01) and declining profitability. |
| Global presence | Significant global presence supported by broad product lines and markets, with stable current and quick ratios indicating good liquidity. | Global presence exists but is less robust; liquidity ratios are neutral to favorable but with weaker interest coverage. |
| Market Share | Strong market position in analytical instruments and life sciences markets; consistent revenue growth in key segments. | Market share is challenged due to weak profitability and shrinking returns; revenue growth slower and less diversified. |
Key takeaways: Agilent demonstrates solid profitability, diversification, and innovation with a slightly declining ROIC trend but remains a value creator. Charles River Laboratories struggles with profitability and value destruction, facing challenges that warrant cautious consideration before investment.
Risk Analysis
Below is a comparative table outlining key risks for Agilent Technologies, Inc. (A) and Charles River Laboratories International, Inc. (CRL) based on their most recent financial and operational data.
| Metric | Agilent Technologies, Inc. (A) | Charles River Laboratories International, Inc. (CRL) |
|---|---|---|
| Market Risk | Beta 1.29 indicates moderate volatility; stable demand in diagnostics and research markets | Beta 1.62 suggests higher volatility; exposed to drug development cycles and contract research demand fluctuations |
| Debt level | Debt-to-Equity 0.5 (favorable); Interest coverage 13.8 (strong ability to service debt) | Debt-to-Equity 0.79 (neutral); Interest coverage 1.74 (weak, risk of stress under downturn) |
| Regulatory Risk | High, due to healthcare and diagnostics sector compliance requirements | High, given extensive global operations in drug safety and regulatory testing |
| Operational Risk | Moderate; complexity in product lines and global supply chains | Moderate to high; reliance on specialized contract services and lab operations |
| Environmental Risk | Moderate; manufacturing and chemical handling with sustainability initiatives | Moderate; animal research and lab waste management under scrutiny |
| Geopolitical Risk | Moderate; global sales with some exposure to trade tensions | Moderate to high; international operations in sensitive regulatory environments |
The most impactful and likely risks differ: Agilent demonstrates strong debt management and operational resilience but faces regulatory and market volatility risks. Charles River has a higher financial leverage risk with weaker interest coverage and is more exposed to geopolitical and operational challenges, which could affect its stability in uncertain global conditions. Investors should weigh Agilent’s favorable financial health against Charles River’s operational risks and market sensitivity.
Which Stock to Choose?
Agilent Technologies, Inc. (A) shows a generally favorable income evolution with solid profitability metrics including a net margin of 18.75% and a return on equity of 19.33%. Its debt ratios are healthy with net debt to EBITDA at 0.85 and interest coverage strong at 13.81, supporting a very favorable B+ rating.
Charles River Laboratories International, Inc. (CRL) presents a challenging income profile marked by a very low net margin of 0.25% and weak profitability ratios such as ROE at 0.3%. Higher leverage with net debt to EBITDA at 4.35 and modest interest coverage of 1.74 contribute to a lower C rating, reflecting financial stress.
Considering the ratings and comprehensive evaluations, Agilent (A) might appear more favorable for investors prioritizing stability and quality investing, given its strong financial health and value creation. Conversely, Charles River (CRL) could be more relevant for risk-tolerant investors focused on potential growth turnaround despite current challenges.
Disclaimer: Investment carries a risk of loss of initial capital. The past performance is not a reliable indicator of future results. Be sure to understand risks before making an investment decision.
Go Further
I encourage you to read the complete analyses of Agilent Technologies, Inc. and Charles River Laboratories International, Inc. to enhance your investment decisions: