Home > Comparison > Financial Services > AFL vs PRU
The strategic rivalry between Aflac Incorporated and Prudential Financial defines the current trajectory of the life insurance sector. Aflac operates as a focused supplemental health and life insurer with strong niche exposure in Japan and the U.S. Prudential functions as a diversified financial services powerhouse, spanning insurance, investment management, and retirement solutions globally. This analysis explores which business model offers superior risk-adjusted returns amid evolving industry dynamics, guiding investors toward optimal portfolio positioning.

Table of contents
Companies Overview
Aflac Incorporated and Prudential Financial, Inc. stand as influential players in the life insurance sector.
Aflac Incorporated: Supplemental Health Insurance Specialist
Aflac dominates the supplemental health and life insurance niche. Its core revenue stems from tailored insurance products, including cancer, medical, and nursing care coverage in Japan and the U.S. In 2026, the company prioritizes expanding its diversified insurance portfolio across these markets, leveraging a focused sales network of associates and agencies. The supplemental insurance focus defines its competitive edge.
Prudential Financial, Inc.: Diversified Financial Services Powerhouse
Prudential operates across insurance and investment management, generating revenue through varied segments like PGIM and Retirement. It offers complex products including annuities, life insurance, and asset management to institutional and retail clients. In 2026, Prudential emphasizes broadening its multi-asset class solutions and digital distribution channels. Its diversified financial services model drives scale and market reach.
Strategic Collision: Similarities & Divergences
Both firms pursue life insurance but diverge sharply in scope and strategy. Aflac relies on a focused supplemental insurance portfolio and direct sales, while Prudential pursues an integrated financial services approach with global asset management and varied insurance lines. Their battle unfolds in the U.S. insurance market, with Prudential targeting scale and complexity, Aflac emphasizing niche specialization. This contrast shapes distinctly different investment profiles—focused versus diversified exposure.
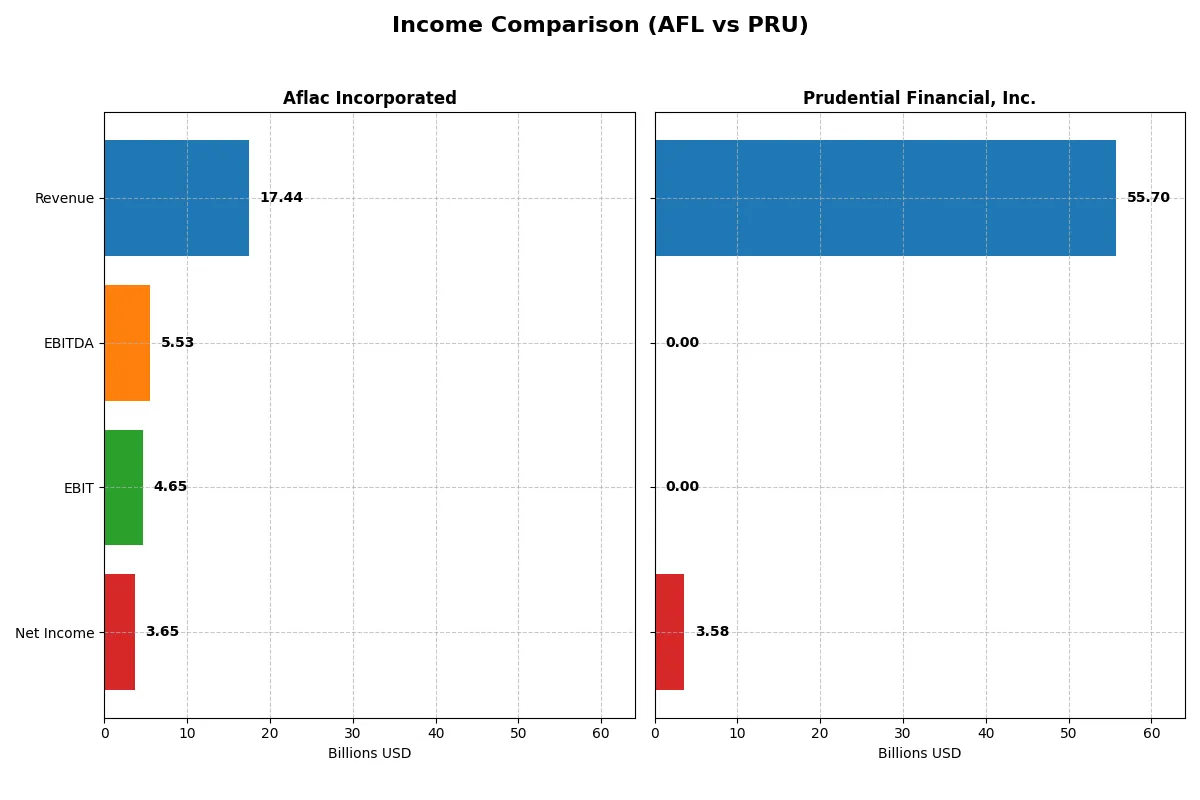
Income Statement Comparison
This data dissects the core profitability and scalability of both corporate engines to reveal who dominates the bottom line:
| Metric | Aflac Incorporated (AFL) | Prudential Financial, Inc. (PRU) |
|---|---|---|
| Revenue | 17.4B | 55.7B |
| Cost of Revenue | 10.7B | 0 |
| Operating Expenses | 2.1B | 6.8B |
| Gross Profit | 6.8B | 55.7B |
| EBITDA | 5.5B | 0 |
| EBIT | 4.7B | 0 |
| Interest Expense | 220M | 2.1B |
| Net Income | 3.6B | 3.6B |
| EPS | 6.86 | 10.16 |
| Fiscal Year | 2025 | 2025 |
Income Statement Analysis: The Bottom-Line Duel
This income statement comparison reveals which company transforms revenue into profit more efficiently amid market challenges.
Aflac Incorporated Analysis
Aflac’s revenue declined from 21.5B in 2021 to 17.4B in 2025, reflecting a 19% drop over five years. Despite this, Aflac maintains a strong net margin near 21% in 2025, showcasing resilient profitability. Its EBIT margin at 26.7% signals solid operational efficiency, though recent declines in revenue and net income point to waning momentum.
Prudential Financial, Inc. Analysis
Prudential’s revenue also slid sharply by 21.7% from 71.1B in 2021 to 55.7B in 2025. The firm recorded a 6.4% net margin in 2025, significantly lower than Aflac’s, reflecting pressure on bottom-line profitability. Despite a dramatic gross profit rebound in 2025, Prudential’s EBIT margin dropped to zero, indicating operational strain and volatile earnings quality.
Margin Power vs. Revenue Scale
Aflac delivers superior margin control and steadier net income despite shrinking revenue, while Prudential leverages scale but struggles with operational profitability. Aflac’s profile fits investors favoring consistent margin strength. Prudential’s volatile earnings call for caution, appealing more to those seeking cyclical recovery potential.
Financial Ratios Comparison
These vital ratios act as a diagnostic tool to expose the underlying fiscal health, valuation premiums, and capital efficiency of the companies compared below:
| Ratios | Aflac Incorporated (AFL) | Prudential Financial, Inc. (PRU) |
|---|---|---|
| ROE | 20.9% | 11.0% |
| ROIC | N/A | 0.7% |
| P/E | 10.6x | 11.1x |
| P/B | 2.21x | 1.22x |
| Current Ratio | 0 | 0 |
| Quick Ratio | 0 | 0 |
| D/E (Debt-to-Equity) | 0.29x | 0.63x |
| Debt-to-Assets | 6.4% | 2.6% |
| Interest Coverage | 32.6x | 3.15x |
| Asset Turnover | 0.16 | 0.07 |
| Fixed Asset Turnover | 49.4 | 0 |
| Payout Ratio | 20.0% | 53.1% |
| Dividend Yield | 1.88% | 4.78% |
| Fiscal Year | 2024 | 2025 |
Efficiency & Valuation Duel: The Vital Signs
Financial ratios act as a company’s DNA, uncovering hidden risks and operational excellence that shape investment decisions.
Aflac Incorporated
Aflac delivers strong profitability with a 20.9% ROE and a robust 28.5% net margin, signaling operational efficiency. Its P/E of 10.6 suggests the stock trades at a favorable valuation, aligned with solid fundamentals. Shareholders benefit from a modest 1.9% dividend yield, reflecting a balanced approach between income and reinvestment.
Prudential Financial, Inc.
Prudential shows moderate profitability, with an 11.0% ROE and a 6.4% net margin, indicating less efficiency than peers. Despite a slightly higher P/E of 11.1, the valuation remains reasonable. The company rewards investors with a healthy 4.8% dividend yield, prioritizing income distribution over aggressive growth investment.
Operational Strength vs. Income Focus
Aflac offers superior profitability and a more favorable valuation, reflecting operational strength and balanced capital allocation. Prudential’s higher dividend yield suits income-focused investors but carries greater risk from weaker efficiency metrics. Investors seeking growth and stability may lean toward Aflac, while income seekers might prefer Prudential’s yield profile.
Which one offers the Superior Shareholder Reward?
I compare Aflac Incorporated (AFL) and Prudential Financial, Inc. (PRU) on dividends, payout ratios, and buybacks. AFL yields ~1.9% with a sustainable 20% payout, backed by strong free cash flow of 4.9/share and consistent buybacks. PRU offers a higher yield near 4.7% but with a risky 53% payout ratio and uneven cash flow coverage. AFL’s balanced dividend and buyback strategy suggests more durable value creation. PRU’s elevated leverage and payout pressure raise sustainability concerns. I conclude AFL delivers a superior total shareholder return profile for 2026 risk-conscious investors.
Comparative Score Analysis: The Strategic Profile
The radar chart reveals the fundamental DNA and trade-offs of Aflac Incorporated and Prudential Financial, Inc.:
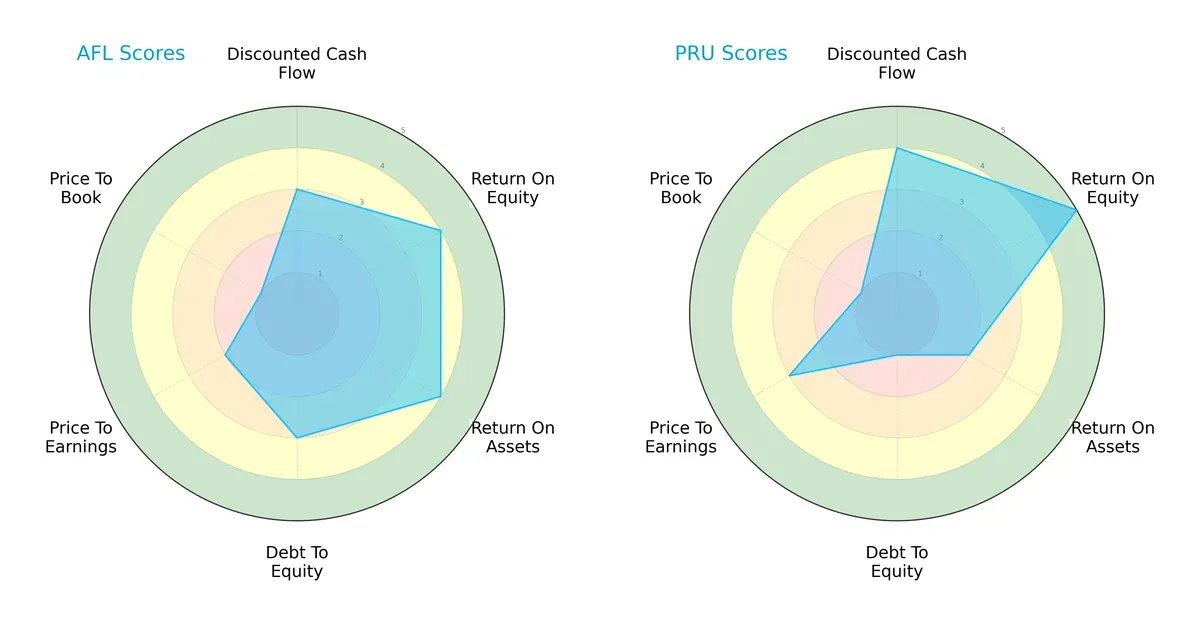
Aflac shows balanced strength in ROE (4) and ROA (4), with moderate DCF (3) and debt-to-equity (3) scores but weak valuation metrics (P/E 2, P/B 1). Prudential excels in ROE (5) and DCF (4) but suffers from a poor debt-to-equity score (1) and weaker ROA (2). Aflac offers a more balanced profile, while Prudential relies heavily on equity returns but carries higher leverage risk.
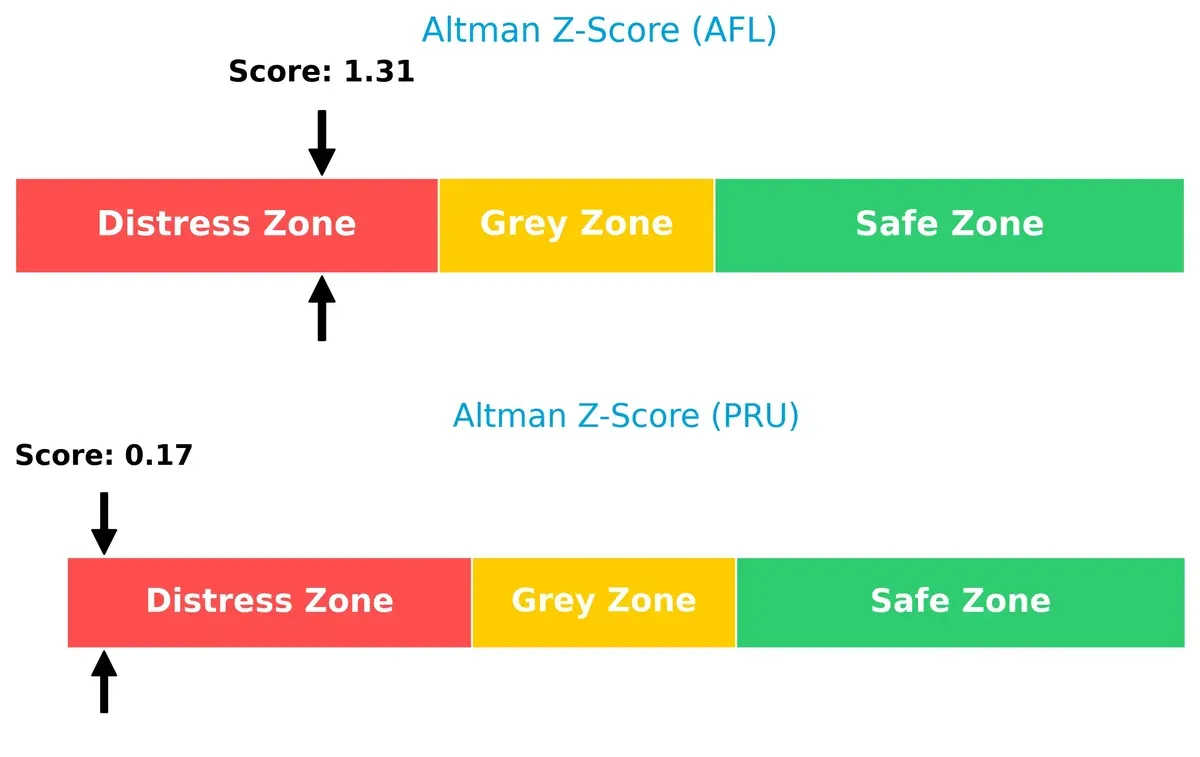
Bankruptcy Risk: Solvency Showdown
Prudential’s Altman Z-Score (0.17) trails Aflac’s (1.31), placing both in distress zones but highlighting Prudential’s greater bankruptcy risk in this cycle:
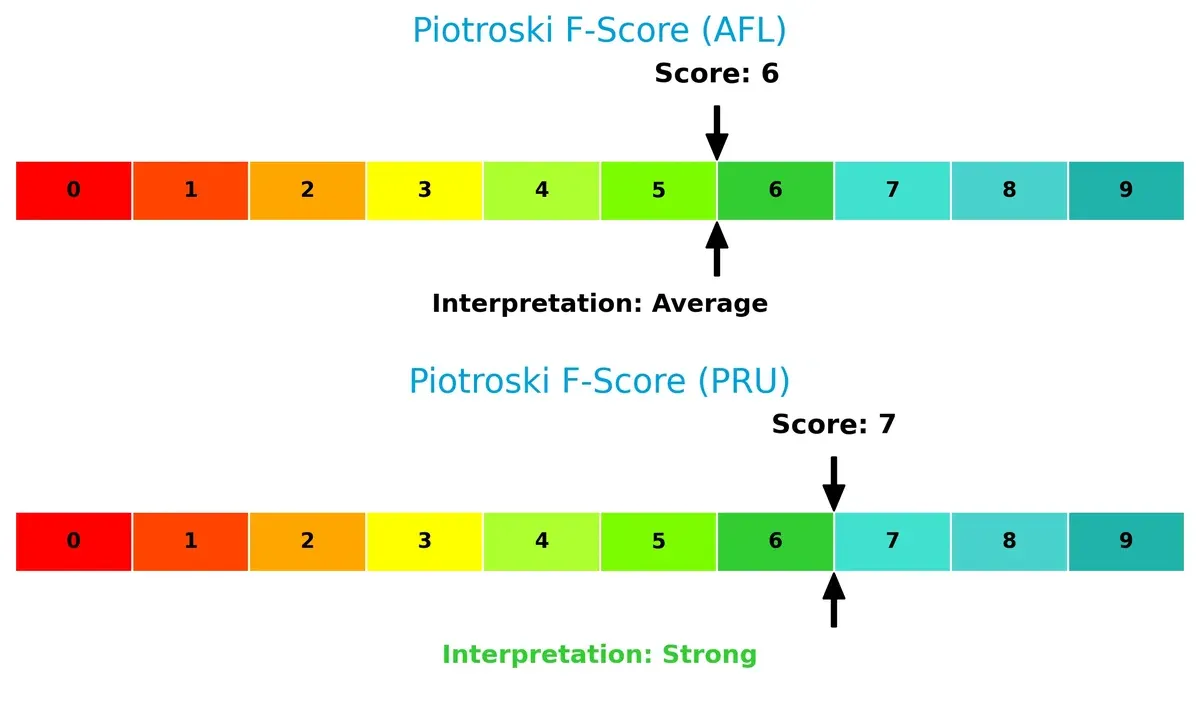
Financial Health: Quality of Operations
Prudential’s Piotroski F-Score (7) edges out Aflac’s (6), signaling stronger internal financial health and operational quality. Both avoid red flags, but Prudential shows a firmer footing:
How are the two companies positioned?
This section dissects the operational DNA of AFL and PRU by comparing their revenue distribution and internal dynamics. The goal is to confront their economic moats to determine which model offers the most resilient, sustainable competitive advantage today.
Revenue Segmentation: The Strategic Mix
This comparison dissects how Aflac and Prudential diversify their income streams and reveals where each places its primary sector bets:
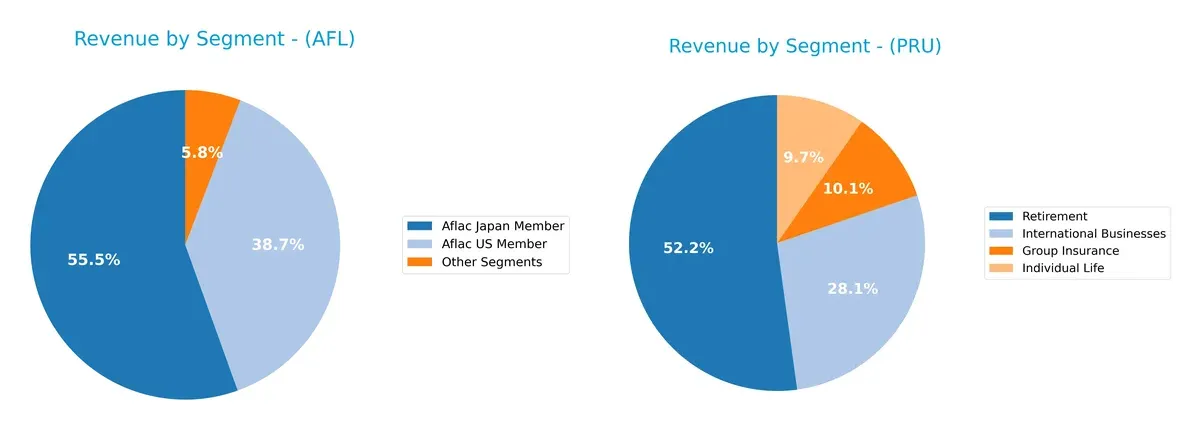
Aflac leans heavily on its Japan Member segment with $9.66B in 2024, anchoring its revenue, while the US Member segment contributes $6.74B. Prudential displays a broader spread, with Retirement dominating at $33.3B, followed by International Businesses at $17.9B, Group Insurance $6.43B, and Individual Life $6.2B. Aflac’s reliance on a geographic stronghold signals concentration risk, whereas Prudential’s diversified portfolio mitigates volatility and taps multiple growth avenues.
Strengths and Weaknesses Comparison
This table compares the strengths and weaknesses of Aflac Incorporated and Prudential Financial, Inc.:
Aflac Strengths
- Strong profitability with 28.46% net margin and 20.86% ROE
- Favorable WACC at 6.45% supporting efficient capital use
- Low debt to assets ratio at 6.38% indicating conservative leverage
- Diverse revenue streams from Japan, US, and other segments
Prudential Strengths
- Diversified revenue across International, Retirement, Group Insurance, and Life segments
- Favorable P/E at 11.1 and P/B at 1.22 suggesting market confidence
- Strong dividend yield at 4.78% appealing to income investors
- Lower debt to assets ratio at 2.62% implies modest leverage
Aflac Weaknesses
- Zero current and quick ratios highlight potential liquidity concerns
- Unfavorable ROIC at 0% questions capital efficiency
- Asset turnover low at 0.16 suggests less asset utilization
- Neutral dividend yield limits income appeal
Prudential Weaknesses
- Unfavorable interest coverage ratio at 0 signals risk in servicing debt
- Low net margin of 6.42% and ROE of 11.02% indicate moderate profitability
- Unfavorable fixed asset turnover at 0 shows asset inefficiency
- Higher debt to equity at 0.63 may increase financial risk
Aflac’s strengths lie in profitability and conservative leverage but face liquidity and capital efficiency challenges. Prudential shows diversification and income appeal but grapples with profitability and debt servicing risks. Both companies exhibit contrasting operational efficiencies and financial structures influencing their strategic priorities.
The Moat Duel: Analyzing Competitive Defensibility
A structural moat is the only true shield protecting a firm’s long-term profits from relentless competitive erosion:
Aflac Incorporated: Intangible Assets and Brand Loyalty
Aflac’s primary moat is its strong brand and trusted insurance products, reflected in consistent margin stability around 20%. However, declining ROIC signals weakening efficiency. Expanding supplemental insurance in Japan and the U.S. could deepen this moat if executed well in 2026.
Prudential Financial, Inc.: Diversified Product Ecosystem
Prudential relies on a broad financial product ecosystem and global distribution, unlike Aflac’s niche focus. Its varied revenue streams support resilience, yet a sharply declining ROIC warns of eroding capital efficiency. Growth in international markets may revive its competitive edge in 2026.
Brand Loyalty vs. Diversified Ecosystem: The Moat Standoff
Both firms face severe ROIC declines, indicating value destruction despite their moats. Aflac’s focused brand moat is narrower but financially steadier. Prudential’s broader ecosystem offers more expansion paths but struggles with capital inefficiency. Aflac appears better positioned to defend market share in a tightening landscape.
Which stock offers better returns?
Aflac Incorporated and Prudential Financial, Inc. show contrasting price movements over the past year, with Aflac posting strong gains and Prudential experiencing declines.
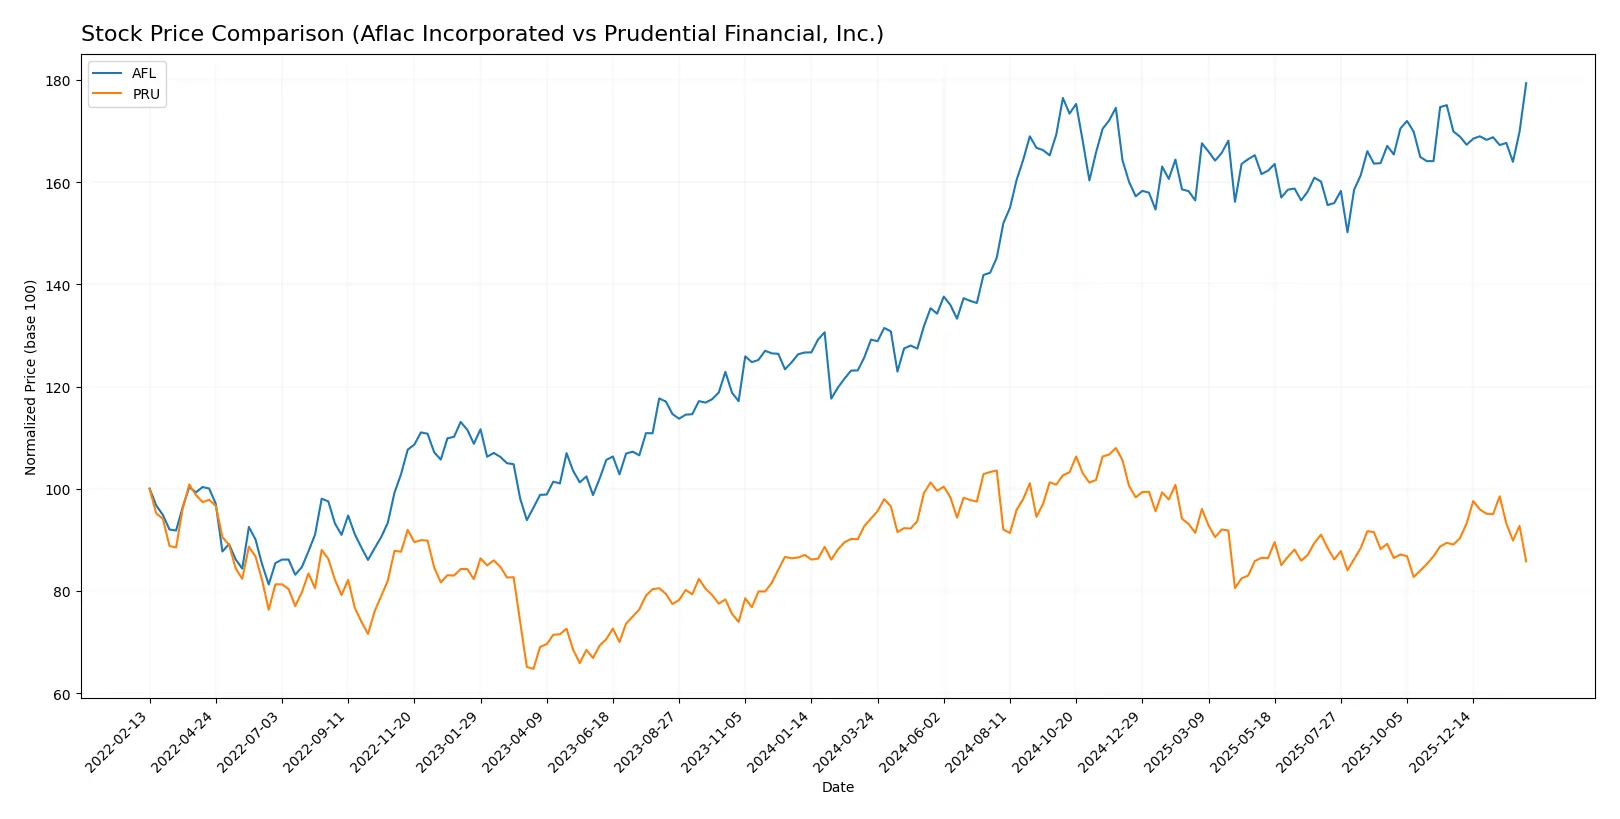
Trend Comparison
Aflac’s stock rose 38.85% over the past 12 months, marking a bullish trend with decelerating momentum and a high of 117.15. The recent three-month trend remains positive, up 5.56%.
Prudential’s stock fell 8.9% over the last year, indicating a bearish trend with deceleration and a peak price of 129.41. The recent quarter also shows continued decline, down 3.7%.
Aflac outperformed Prudential significantly, delivering the highest market returns over the past year with sustained buyer dominance and increasing volume trends.
Target Prices
Analysts present a confident target price range for both Aflac Incorporated and Prudential Financial, Inc.
| Company | Target Low | Target High | Consensus |
|---|---|---|---|
| Aflac Incorporated | 101 | 125 | 115.2 |
| Prudential Financial, Inc. | 110 | 126 | 118.43 |
The consensus targets for Aflac and Prudential sit slightly above current prices, signaling moderate upside potential. This aligns with steady sector fundamentals but calls for vigilance on valuation risks.

Don’t Let Luck Decide Your Entry Point
Optimize your entry points with our advanced ProRealTime indicators. You’ll get efficient buy signals with precise price targets for maximum performance. Start outperforming now!
How do institutions grade them?
The following tables summarize recent grades assigned to Aflac Incorporated and Prudential Financial, Inc.:
Aflac Incorporated Grades
This table shows the latest institutional grades for Aflac Incorporated from established firms.
| Grading Company | Action | New Grade | Date |
|---|---|---|---|
| Barclays | Maintain | Underweight | 2026-01-08 |
| JP Morgan | Maintain | Neutral | 2026-01-05 |
| Raymond James | Maintain | Outperform | 2025-12-30 |
| TD Cowen | Maintain | Hold | 2025-12-22 |
| Morgan Stanley | Maintain | Equal Weight | 2025-11-17 |
| Wells Fargo | Maintain | Equal Weight | 2025-11-07 |
| Evercore ISI Group | Maintain | Underperform | 2025-11-07 |
| Barclays | Maintain | Underweight | 2025-11-05 |
| JP Morgan | Maintain | Neutral | 2025-11-05 |
| Keefe, Bruyette & Woods | Maintain | Market Perform | 2025-10-09 |
Prudential Financial, Inc. Grades
The table below presents recent institutional grades for Prudential Financial, Inc.
| Grading Company | Action | New Grade | Date |
|---|---|---|---|
| Evercore ISI Group | Maintain | In Line | 2026-02-05 |
| JP Morgan | Maintain | Neutral | 2026-02-04 |
| Wells Fargo | Maintain | Equal Weight | 2026-01-13 |
| UBS | Maintain | Neutral | 2026-01-08 |
| Piper Sandler | Maintain | Neutral | 2025-12-23 |
| Keefe, Bruyette & Woods | Maintain | Market Perform | 2025-11-03 |
| Evercore ISI Group | Maintain | In Line | 2025-10-30 |
| Barclays | Maintain | Equal Weight | 2025-10-08 |
| Morgan Stanley | Maintain | Equal Weight | 2025-10-07 |
| Morgan Stanley | Maintain | Equal Weight | 2025-08-18 |
Which company has the best grades?
Aflac’s ratings range from Underperform to Outperform, showing more variation. Prudential’s grades consistently cluster around Neutral and Equal Weight. Investors might interpret Aflac’s Outperform rating as a stronger upside potential, while Prudential’s steadier grades suggest more moderate expectations.
Risks specific to each company
The following categories identify critical pressure points and systemic threats facing Aflac Incorporated and Prudential Financial, Inc. in the 2026 market environment:
1. Market & Competition
Aflac Incorporated
- Strong niche in supplemental insurance; faces intense competition in Japan and U.S. markets.
Prudential Financial, Inc.
- Broad product range with global reach; competitive pressure from diversified financial services firms.
2. Capital Structure & Debt
Aflac Incorporated
- Low debt-to-equity (0.29), strong interest coverage (21.14) signals solid financial stability.
Prudential Financial, Inc.
- Higher debt-to-equity (0.63), weak interest coverage raises concerns about leverage risk.
3. Stock Volatility
Aflac Incorporated
- Lower beta (0.662) suggests less stock price volatility and defensive characteristics.
Prudential Financial, Inc.
- Higher beta (0.951) indicates greater market sensitivity and volatility risk.
4. Regulatory & Legal
Aflac Incorporated
- Exposed to insurance regulation in Japan and the U.S., with potential compliance costs.
Prudential Financial, Inc.
- Faces complex regulatory regimes globally, increasing legal and compliance risks.
5. Supply Chain & Operations
Aflac Incorporated
- Operations concentrated in insurance underwriting; supply chain risks minimal but operational efficiency vital.
Prudential Financial, Inc.
- Diverse operations increase operational complexity and exposure to systemic risks.
6. ESG & Climate Transition
Aflac Incorporated
- Moderate ESG focus; climate risks in underwriting and investment portfolios require ongoing management.
Prudential Financial, Inc.
- Stronger ESG integration needed; climate-related risks could impact investment and insurance segments.
7. Geopolitical Exposure
Aflac Incorporated
- Significant exposure to Japanese market; geopolitical tensions in Asia may disrupt growth.
Prudential Financial, Inc.
- Global footprint exposes Prudential to geopolitical instability across multiple regions.
Which company shows a better risk-adjusted profile?
Aflac’s strongest risk lies in geopolitical exposure to Japan, a single market vulnerable to regional tensions. Prudential’s most impactful risk is its high leverage and weak interest coverage, signaling financial strain. Aflac’s lower stock volatility and stronger capital structure deliver a better risk-adjusted profile. Recent data shows Prudential’s interest coverage at zero, a red flag for debt servicing ability under stress.
Final Verdict: Which stock to choose?
Aflac Incorporated’s superpower lies in its robust profitability and efficient capital structure, making it a dependable cash generator. Its main point of vigilance is the declining revenue trend, which could pressure future growth. AFL suits portfolios targeting steady income with moderate risk tolerance.
Prudential Financial’s strategic moat centers on its disciplined capital allocation and attractive dividend yield, offering income stability. Relative to AFL, it presents a more cautious risk profile but faces challenges in operational efficiency. PRU fits well with investors seeking Growth at a Reasonable Price (GARP) with income focus.
If you prioritize strong profitability and resilient cash flow generation, Aflac outshines due to its operational efficiency and capital discipline. However, if you seek a safer income stream with moderate growth potential, Prudential offers better stability despite its operational headwinds. Both require attention to their value-creating capacity, which currently appears constrained.
Disclaimer: Investment carries a risk of loss of initial capital. The past performance is not a reliable indicator of future results. Be sure to understand risks before making an investment decision.
Go Further
I encourage you to read the complete analyses of Aflac Incorporated and Prudential Financial, Inc. to enhance your investment decisions: