Home > Comparison > Financial Services > AFL vs MET
The strategic rivalry between Aflac Incorporated and MetLife, Inc. shapes the landscape of the life insurance sector. Aflac relies on a focused supplemental health and life insurance model, primarily in Japan and the U.S. MetLife operates a diversified global financial services platform, spanning insurance, annuities, and asset management. This analysis aims to identify which company’s business model offers superior risk-adjusted returns for a diversified portfolio in today’s evolving insurance market.

Table of contents
Companies Overview
Aflac and MetLife stand as heavyweight insurers shaping the global life insurance landscape.
Aflac Incorporated: Supplemental Insurance Specialist
Aflac focuses primarily on supplemental health and life insurance. Its revenues stem from products sold in Japan and the U.S., including cancer, medical, and disability insurance. In 2026, Aflac emphasizes expanding its supplemental insurance footprint through diverse channels like brokers and affiliated agencies, leveraging its stronghold in Japan and the U.S. markets.
MetLife, Inc.: Global Life and Employee Benefits Leader
MetLife operates as a broad financial services provider with life insurance, annuities, and employee benefits worldwide. It generates revenue across five geographic segments, offering a wide product range from disability to pension risk transfers. The company’s 2026 strategy centers on global diversification and expanding asset management alongside insurance solutions.
Strategic Collision: Similarities & Divergences
Both firms anchor their strength in life insurance but diverge sharply in approach. Aflac champions a focused supplemental insurance niche, while MetLife pursues a diversified global portfolio blending insurance and asset management. The battleground for market share lies in balancing specialization versus breadth. Their distinct profiles cater to investors seeking either targeted supplemental exposure or broad financial services diversification.
Income Statement Comparison
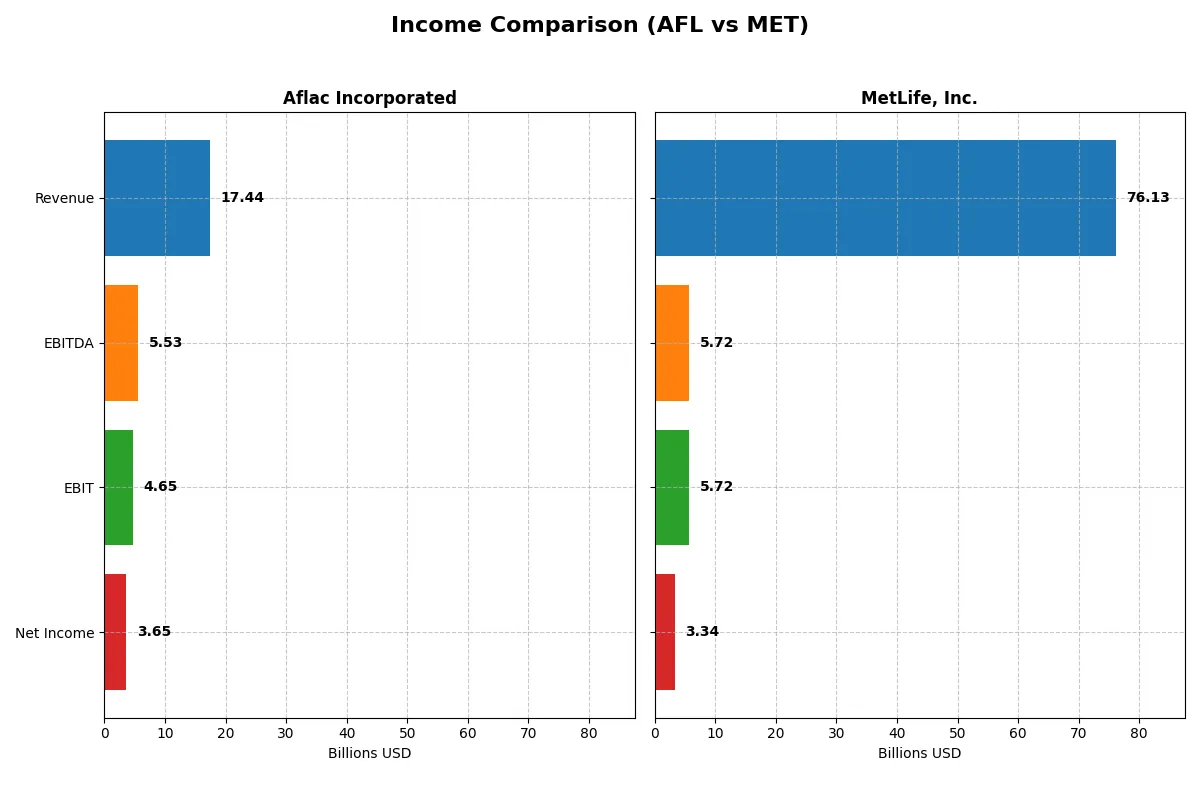
The following data dissects the core profitability and scalability of both corporate engines to reveal who dominates the bottom line:
| Metric | Aflac Incorporated (AFL) | MetLife, Inc. (MET) |
|---|---|---|
| Revenue | 17.4B | 76.1B |
| Cost of Revenue | 10.7B | 58.8B |
| Operating Expenses | 2.1B | 12.4B |
| Gross Profit | 6.8B | 17.3B |
| EBITDA | 5.5B | 5.7B |
| EBIT | 4.7B | 5.7B |
| Interest Expense | 220M | 1.1B |
| Net Income | 3.6B | 3.3B |
| EPS | 6.86 | 4.73 |
| Fiscal Year | 2025 | 2025 |
Income Statement Analysis: The Bottom-Line Duel
This income statement comparison reveals how each company’s operational efficiency and profitability have evolved, exposing the true strength of their business models.
Aflac Incorporated Analysis
Aflac’s revenue declined from 21.5B in 2021 to 17.4B in 2025, reflecting a 19% drop over five years. Net income followed a similar trend, falling from 4.2B to 3.6B. Despite this, Aflac maintains strong margins with a gross margin near 39% and a 21% net margin in 2025. The decline in EBIT and EPS signals a loss of momentum and operational headwinds.
MetLife, Inc. Analysis
MetLife expanded revenue steadily from 63.4B in 2021 to 76.1B in 2025, marking 20% growth over the period. However, net income shrank sharply, dropping from 6.7B to just 3.2B. Margins are thinner; gross margin stands at 23% and net margin at 4.4% in 2025. The company’s revenue growth contrasts with deteriorating profitability and shrinking EPS, highlighting margin pressure.
Scale Growth vs. Margin Resilience
Aflac delivers superior margin resilience despite shrinking top-line and bottom-line figures, sustaining operational efficiency with a strong 21% net margin. MetLife boasts impressive revenue expansion but struggles with profitability, halving its net income over five years. Investors seeking stable margin power may favor Aflac’s consistent profitability profile over MetLife’s growth-at-a-cost scenario.
Financial Ratios Comparison
These vital ratios act as a diagnostic tool to expose the underlying fiscal health, valuation premiums, and capital efficiency of each company:
| Ratios | Aflac Incorporated (AFL) | MetLife, Inc. (MET) |
|---|---|---|
| ROE | 20.9% (2024) | 16.1% (2024) |
| ROIC | N/A | 6.3% (2024) |
| P/E | 10.6 (2024) | 12.8 (2024) |
| P/B | 2.21 (2024) | 2.06 (2024) |
| Current Ratio | 0 | 0 |
| Quick Ratio | 0 | 0 |
| D/E | 0.29 (2024) | 0.68 (2024) |
| Debt-to-Assets | 6.4% (2024) | 2.8% (2024) |
| Interest Coverage | 32.6 (2024) | 5.42 (2024) |
| Asset Turnover | 0.16 (2024) | 0.10 (2024) |
| Fixed Asset Turnover | 49.4 (2024) | 37.8 (2024) |
| Payout ratio | 20.0% (2024) | 39.0% (2024) |
| Dividend yield | 1.88% (2024) | 3.06% (2024) |
| Fiscal Year | 2024 | 2024 |
Efficiency & Valuation Duel: The Vital Signs
Financial ratios act as a company’s DNA, exposing hidden risks and operational strengths crucial for investment insights.
Aflac Incorporated
Aflac posts a robust 20.9% ROE and a strong 28.5% net margin, reflecting solid profitability. Its P/E of 10.6 signals a reasonably priced stock versus sector averages. The firm returns capital moderately with a 1.88% dividend yield, balancing shareholder paybacks and reinvestment for stable growth.
MetLife, Inc.
MetLife shows a weak profitability profile with a 4.4% net margin and no reported ROE. The stock trades at a neutral P/E of 15.7, implying a stretched valuation relative to earnings quality. A 2.85% dividend yield highlights a shareholder focus on income amid limited operational efficiency.
Balanced Profitability vs. Yield Focus
Aflac delivers superior profitability and a fair valuation, offering a healthier risk-reward balance. MetLife’s higher dividend yield suits income seekers but comes with operational challenges and valuation risks. Investors prioritizing efficiency lean toward Aflac, while income-focused profiles may consider MetLife.
Which one offers the Superior Shareholder Reward?
I see Aflac Incorporated (AFL) maintains a disciplined dividend payout near 20%, yielding around 1.9% with strong free cash flow coverage. AFL couples dividends with steady buybacks, supporting shareholder value sustainably. MetLife, Inc. (MET) offers a higher dividend yield near 3%, but with a payout ratio close to 40%, risking sustainability. MET’s buyback intensity is less clear, and leverage ratios signal higher risk. Historically, AFL’s balanced distributions and conservative leverage provide a more reliable total return in 2026. I favor AFL for superior long-term shareholder rewards.
Comparative Score Analysis: The Strategic Profile
The radar chart reveals the fundamental DNA and trade-offs of Aflac Incorporated and MetLife, Inc., highlighting their respective financial strengths and valuation challenges:
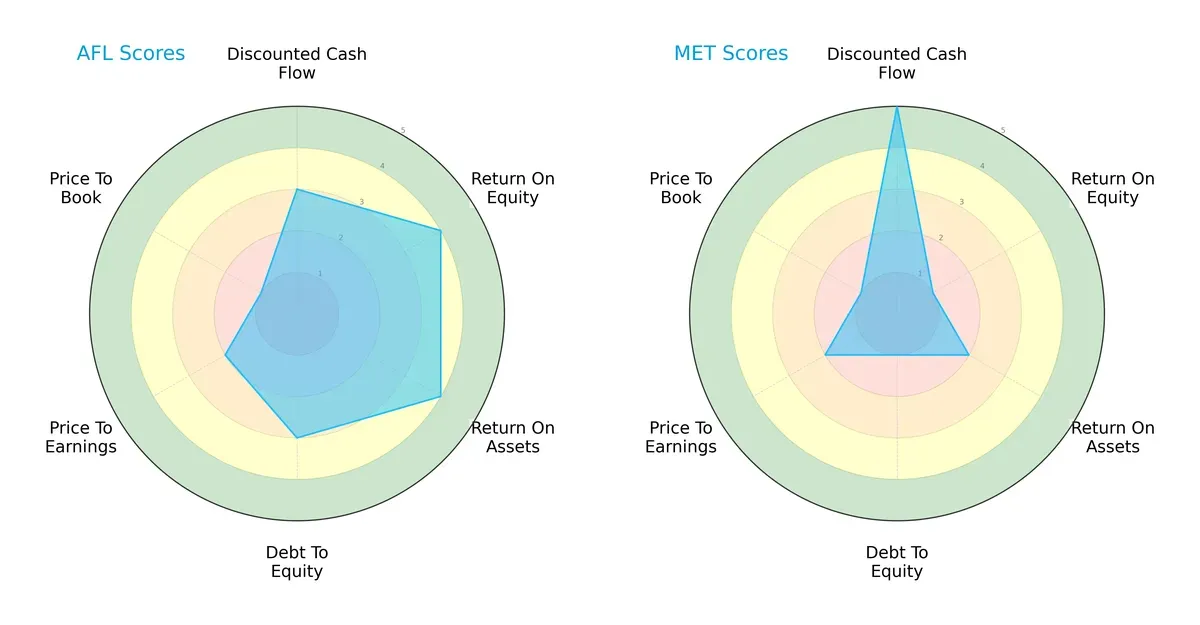
Aflac displays a balanced profile with solid ROE (4) and ROA (4) scores, and moderate debt management (3). In contrast, MetLife relies heavily on a top-tier DCF score (5) but struggles with weak profitability (ROE 1, ROA 2) and high leverage (debt/equity 1). Aflac’s diversified financial metrics suggest steadier operational efficiency, while MetLife’s edge lies in valuation optimism despite financial risks.
Bankruptcy Risk: Solvency Showdown
Aflac’s Altman Z-Score of 1.31 places it in the distress zone, signaling elevated bankruptcy risk amid current market pressures, while MetLife’s score is unavailable for comparison:

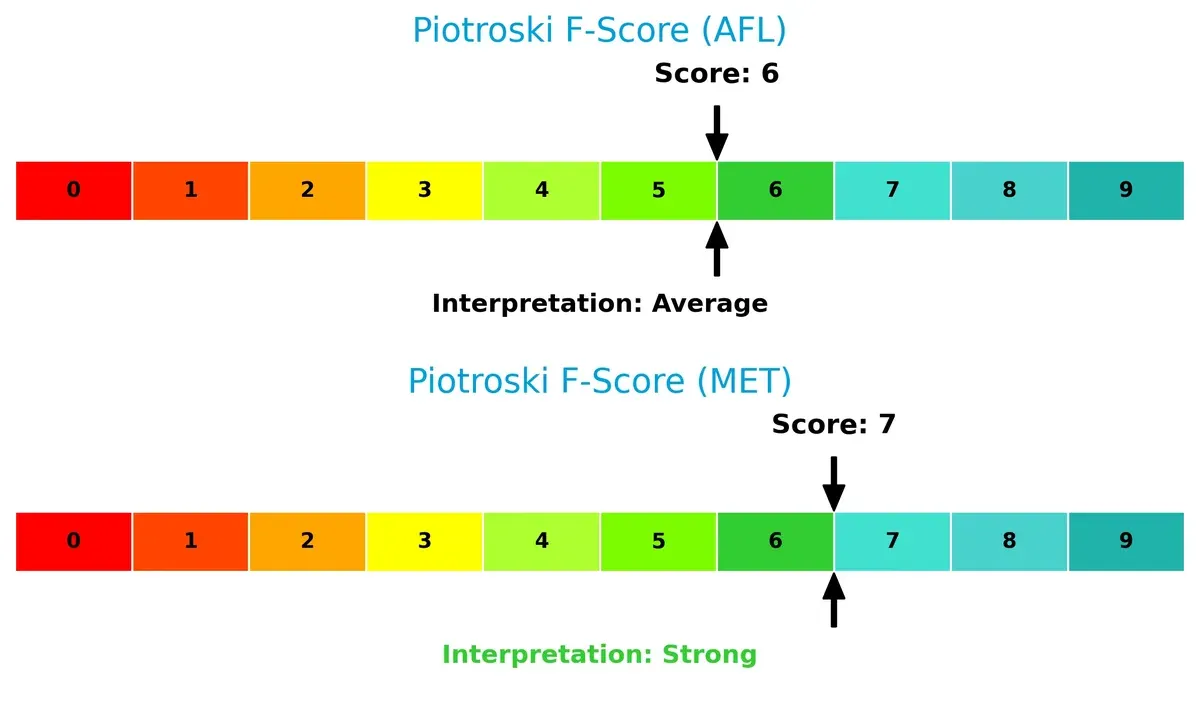
Financial Health: Quality of Operations
MetLife scores a 7 on the Piotroski F-Score, indicating strong financial health. Aflac’s 6 denotes average health, suggesting some caution in internal metrics but no immediate red flags:
How are the two companies positioned?
This section dissects the operational DNA of AFL and MET by comparing their revenue distribution and internal dynamics. The goal is to confront their economic moats to identify which model offers the most resilient competitive advantage today.
Revenue Segmentation: The Strategic Mix
This visual comparison dissects how Aflac Incorporated and MetLife, Inc. diversify their income streams and where their primary sector bets lie:
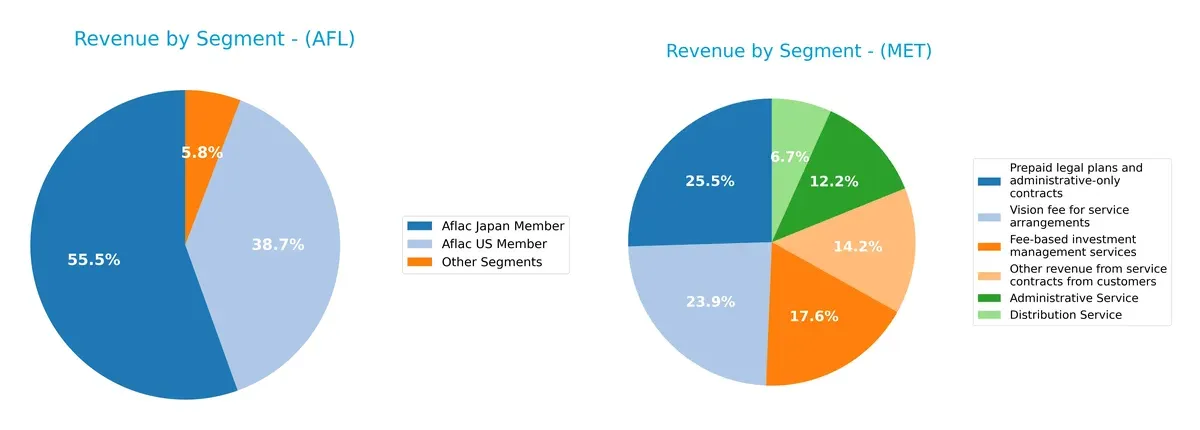
Aflac’s revenue pivots heavily on its Japan Member segment at $9.66B, anchoring its income with a smaller U.S. Member contribution of $6.74B. This concentration suggests a strong regional moat but also concentration risk. MetLife displays a more diversified mix with significant contributions across U.S. ($45.8B), Asia ($11.4B), and MetLife Holdings ($9.2B). MetLife’s broad geographic and product base reduces risk and supports ecosystem dominance globally.
Strengths and Weaknesses Comparison
This table compares the Strengths and Weaknesses of Aflac and MetLife based on key financial and business metrics:
Aflac Strengths
- High net margin (28.46%) and ROE (20.86%) indicate strong profitability
- Favorable debt-to-assets (6.38%) and interest coverage (21.14) ratios
- Diversified revenue streams across Japan and US segments
MetLife Strengths
- Favorable price-to-book ratio indicating undervaluation
- Solid interest coverage (5.39) supports debt servicing
- Broad geographic diversification including US, Asia, Latin America, and EMEA
Aflac Weaknesses
- Zero current and quick ratios signal liquidity concerns
- Unfavorable ROIC (0%) and low asset turnover (0.16)
- Limited geographic diversification focused on Japan and US
MetLife Weaknesses
- Low net margin (4.39%) and zero ROE and ROIC indicate weak profitability
- Unavailable WACC metric reduces valuation clarity
- Unfavorable asset and fixed asset turnover ratios
Aflac demonstrates strong profitability and capital structure discipline but faces liquidity and operational efficiency challenges. MetLife offers wider geographic reach and reasonable debt metrics but struggles with profitability and asset utilization. These contrasts highlight differing strategic focuses in financial management and market presence.
The Moat Duel: Analyzing Competitive Defensibility
A structural moat is the sole barrier protecting long-term profits from relentless competition erosion. Let’s dissect the moats at play:
Aflac Incorporated: Intangible Assets and Brand Trust
Aflac’s moat stems from strong brand recognition and trusted supplemental insurance products, reflected in stable margins near 21%. Yet, declining ROIC signals weakening capital efficiency in 2026.
MetLife, Inc.: Scale and Diversified Geographic Reach
MetLife’s competitive advantage lies in its broad global footprint and product diversity, driving revenue growth over 20% since 2021. However, a dropping ROIC trend casts doubt on future profitability sustainability.
Geographic Diversification vs. Brand Loyalty in Life Insurance
Aflac relies on intangible assets with stable margins but deteriorating capital returns. MetLife leverages scale and geography but faces profitability challenges. Neither currently sustains a durable moat; Aflac’s brand trust edges ahead in defending market share.
Which stock offers better returns?
Over the past 12 months, Aflac Incorporated surged 38.85%, showing a strong but decelerating bullish trend. MetLife, Inc. gained 5.51%, also bullish but less pronounced. Trading volumes reveal diverging buyer dynamics.
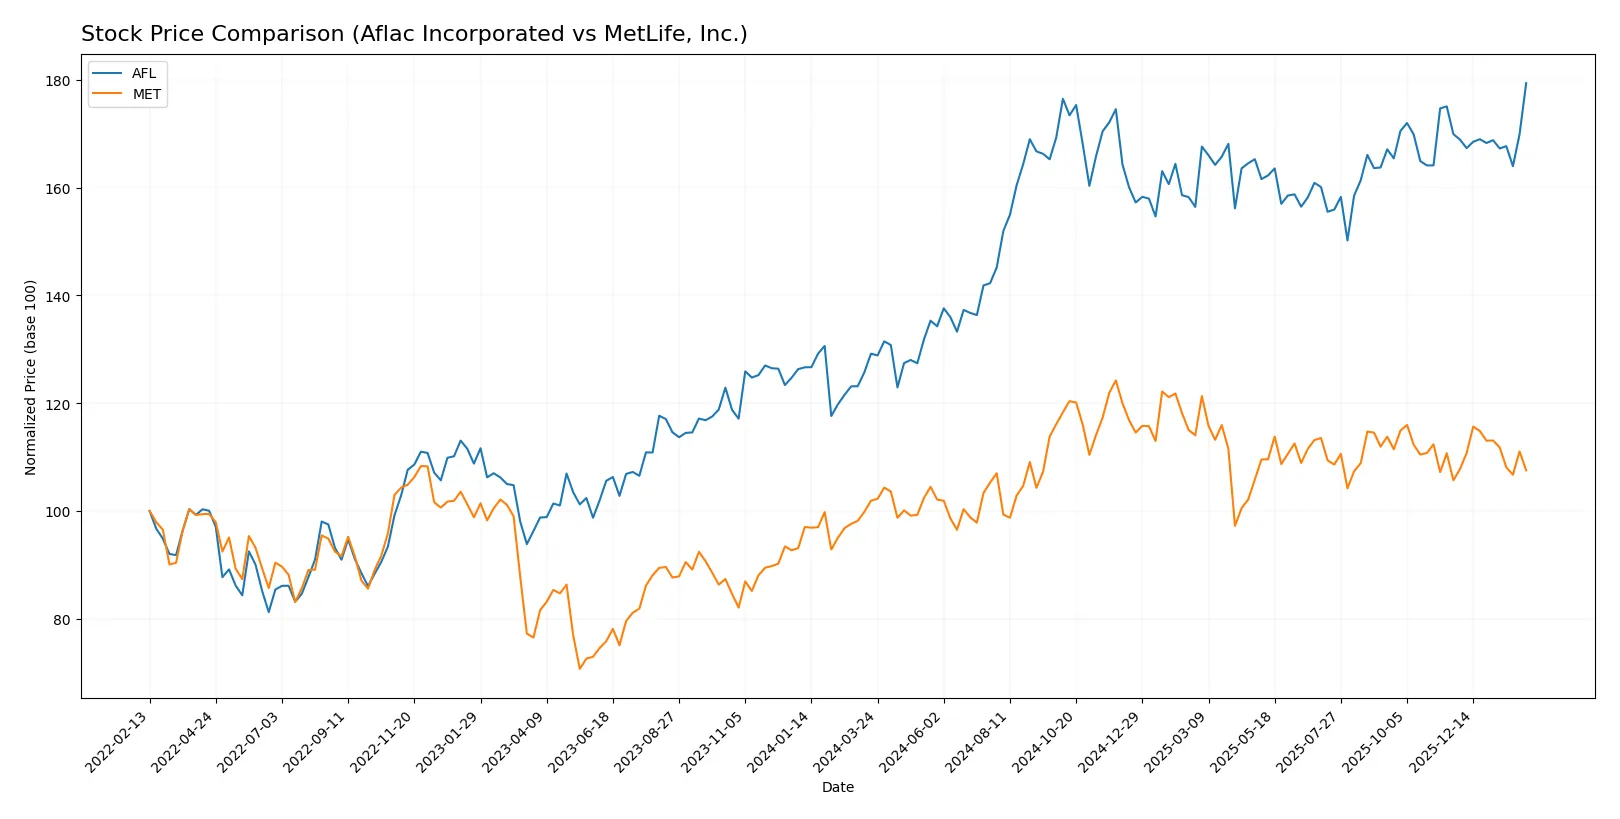
Trend Comparison
Aflac’s stock rose 38.85% over the last year, confirming a bullish trend with decelerating momentum. The price fluctuated between 80.28 and 117.15, showing healthy volatility (8.88 std deviation).
MetLife’s stock increased 5.51% in the same period, marking a mild bullish trend with deceleration. The price range was 68.55 to 88.23, exhibiting moderate volatility (4.73 std deviation).
Aflac outperformed MetLife substantially, delivering the highest market returns with stronger buyer volume and sustained upward price movement.
Target Prices
Analysts present a modest upside potential for Aflac Incorporated and MetLife, Inc., reflecting cautious optimism in the life insurance sector.
| Company | Target Low | Target High | Consensus |
|---|---|---|---|
| Aflac Incorporated | 101 | 125 | 115.2 |
| MetLife, Inc. | 84 | 102 | 95.5 |
The consensus target for Aflac sits slightly below its current price of 117.15, suggesting limited near-term appreciation. MetLife’s target consensus at 95.5 indicates a potential 25% upside from its current 76.38, highlighting stronger growth expectations.

Don’t Let Luck Decide Your Entry Point
Optimize your entry points with our advanced ProRealTime indicators. You’ll get efficient buy signals with precise price targets for maximum performance. Start outperforming now!
How do institutions grade them?
The following tables summarize recent grades assigned to Aflac Incorporated and MetLife, Inc. by major financial institutions:
Aflac Incorporated Grades
This table shows the latest rating actions from reputable grading firms for Aflac Incorporated.
| Grading Company | Action | New Grade | Date |
|---|---|---|---|
| Barclays | Maintain | Underweight | 2026-01-08 |
| JP Morgan | Maintain | Neutral | 2026-01-05 |
| Raymond James | Maintain | Outperform | 2025-12-30 |
| TD Cowen | Maintain | Hold | 2025-12-22 |
| Morgan Stanley | Maintain | Equal Weight | 2025-11-17 |
| Wells Fargo | Maintain | Equal Weight | 2025-11-07 |
| Evercore ISI Group | Maintain | Underperform | 2025-11-07 |
| Barclays | Maintain | Underweight | 2025-11-05 |
| JP Morgan | Maintain | Neutral | 2025-11-05 |
| Keefe, Bruyette & Woods | Maintain | Market Perform | 2025-10-09 |
MetLife, Inc. Grades
Below are recent grades from prominent firms evaluating MetLife, Inc.
| Grading Company | Action | New Grade | Date |
|---|---|---|---|
| UBS | Maintain | Buy | 2026-02-05 |
| Wells Fargo | Maintain | Overweight | 2026-01-13 |
| UBS | Maintain | Buy | 2026-01-08 |
| Wells Fargo | Maintain | Overweight | 2025-12-23 |
| Keefe, Bruyette & Woods | Maintain | Outperform | 2025-11-11 |
| Wells Fargo | Maintain | Overweight | 2025-11-07 |
| B of A Securities | Maintain | Buy | 2025-11-06 |
| UBS | Maintain | Buy | 2025-11-06 |
| B of A Securities | Maintain | Buy | 2025-10-13 |
| Wells Fargo | Maintain | Overweight | 2025-10-08 |
Which company has the best grades?
MetLife, Inc. consistently receives Buy and Overweight ratings from leading institutions, signaling stronger confidence. Aflac’s grades range from Underweight to Outperform, indicating more mixed views. Investors may interpret MetLife’s superior grades as a sign of favorable analyst sentiment and potential resilience.
Risks specific to each company
The following categories identify the critical pressure points and systemic threats facing both firms in the 2026 market environment:
1. Market & Competition
Aflac Incorporated
- Focuses on supplemental health and life insurance, strong niche in Japan and US markets.
MetLife, Inc.
- Operates globally with diverse insurance and asset management products, facing broader competitive pressures.
2. Capital Structure & Debt
Aflac Incorporated
- Maintains a low debt-to-equity ratio (0.29), indicating prudent leverage and strong financial stability.
MetLife, Inc.
- Reported zero debt-to-equity ratio, possibly underreporting or unusual structure; interest coverage at 5.39 is weaker than Aflac.
3. Stock Volatility
Aflac Incorporated
- Beta of 0.662 suggests lower volatility than market average, providing stability for investors.
MetLife, Inc.
- Beta of 0.738 indicates moderate volatility, slightly higher risk compared to Aflac.
4. Regulatory & Legal
Aflac Incorporated
- Faces regulatory scrutiny mainly in Japan and US insurance markets, relatively stable frameworks.
MetLife, Inc.
- Exposure to multiple international jurisdictions increases regulatory complexity and potential legal risks.
5. Supply Chain & Operations
Aflac Incorporated
- Operates through multiple sales channels with strong presence in Japan; operational efficiency critical.
MetLife, Inc.
- Large global footprint with 45K employees implies complex operations and higher operational risk.
6. ESG & Climate Transition
Aflac Incorporated
- Limited data on ESG metrics; evolving climate transition policies in Japan and US may pose challenges.
MetLife, Inc.
- Increasing ESG requirements globally require substantial adaptation; corporate sustainability initiatives needed.
7. Geopolitical Exposure
Aflac Incorporated
- Significant exposure to Japan-US relations; geopolitical stability moderately favorable.
MetLife, Inc.
- Operates across Asia, Latin America, Europe, and Middle East; geopolitical risks are more diverse and complex.
Which company shows a better risk-adjusted profile?
Aflac’s strongest risk is its liquidity concerns reflected by unfavorable current and quick ratios, raising operational red flags. MetLife’s critical risk lies in weak profitability and financial leverage metrics, signaling potential distress. Given Aflac’s lower beta and stronger debt metrics, I find its risk-adjusted profile superior. Notably, Aflac’s Altman Z-Score places it in the distress zone, demanding caution despite its favorable leverage. Meanwhile, MetLife’s diverse geopolitical footprint heightens its exposure to systemic shocks, underlining the need for vigilant risk management.
Final Verdict: Which stock to choose?
Aflac Incorporated’s superpower lies in its consistent profitability and strong return on equity. It operates as a cash-generating machine with solid interest coverage and manageable debt levels. However, its declining revenue and negative ROIC trend remain points of vigilance. AFL suits investors targeting aggressive growth with a tolerance for operational headwinds.
MetLife, Inc. builds its moat on recurring revenue streams and robust free cash flow yield, offering a safer harbor amid volatility. Though its margins and returns lag behind AFL, MetLife’s lower leverage and stronger Piotroski score provide relative stability. MET fits well in GARP portfolios seeking steady income with moderate growth prospects.
If you prioritize high current profitability and efficient capital use, Aflac outshines due to its superior net margins and equity returns. However, if you seek better financial stability and a stronger safety profile, MetLife offers a more conservative choice with durable cash flow. Both present distinct analytical scenarios depending on your risk appetite and growth expectations.
Disclaimer: Investment carries a risk of loss of initial capital. The past performance is not a reliable indicator of future results. Be sure to understand risks before making an investment decision.
Go Further
I encourage you to read the complete analyses of Aflac Incorporated and MetLife, Inc. to enhance your investment decisions: