Home > Comparison > Financial Services > AFL vs GL
The competitive dynamic between Aflac Incorporated and Globe Life Inc. shapes the evolution of the life insurance sector. Aflac operates as a diversified insurer with a strong international presence, while Globe Life targets the U.S. middle-income market with focused life and health insurance products. This head-to-head pits broad diversification against niche specialization. This analysis will reveal which strategy offers superior risk-adjusted returns for a balanced investment portfolio.
Table of contents
Companies Overview
Aflac Incorporated and Globe Life Inc. stand as formidable players in the U.S. life insurance market, shaping coverage for diverse demographic segments.
Aflac Incorporated: Supplemental Insurance Leader
Aflac dominates the supplemental health and life insurance niche, generating revenue through its two main segments: Aflac Japan and Aflac U.S. The company focuses on cancer, medical, disability, and life insurance products. Its strategic emphasis in 2026 remains expanding its portfolio in supplemental insurance, leveraging a broad distribution network of sales associates and brokers to sustain its competitive edge.
Globe Life Inc.: Middle-Income Life Insurance Specialist
Globe Life targets lower to middle-income U.S. households with life and supplemental health insurance products, alongside annuities. Its core revenue drivers include term and whole life insurance plus Medicare supplement plans. In 2026, Globe Life prioritizes deepening market penetration through tailored insurance offerings and annuity products, optimizing its service delivery within its four operating segments.
Strategic Collision: Similarities & Divergences
Both companies focus on life and supplemental health insurance, but Aflac embraces a global footprint with a significant Japan segment, while Globe Life centers exclusively on U.S. middle-income markets. Their primary battleground is supplemental health insurance, where distribution strategies differ markedly. Aflac’s larger scale and diversified geographic presence contrast with Globe Life’s leaner operation and niche market focus, defining distinct risk and growth profiles for investors.
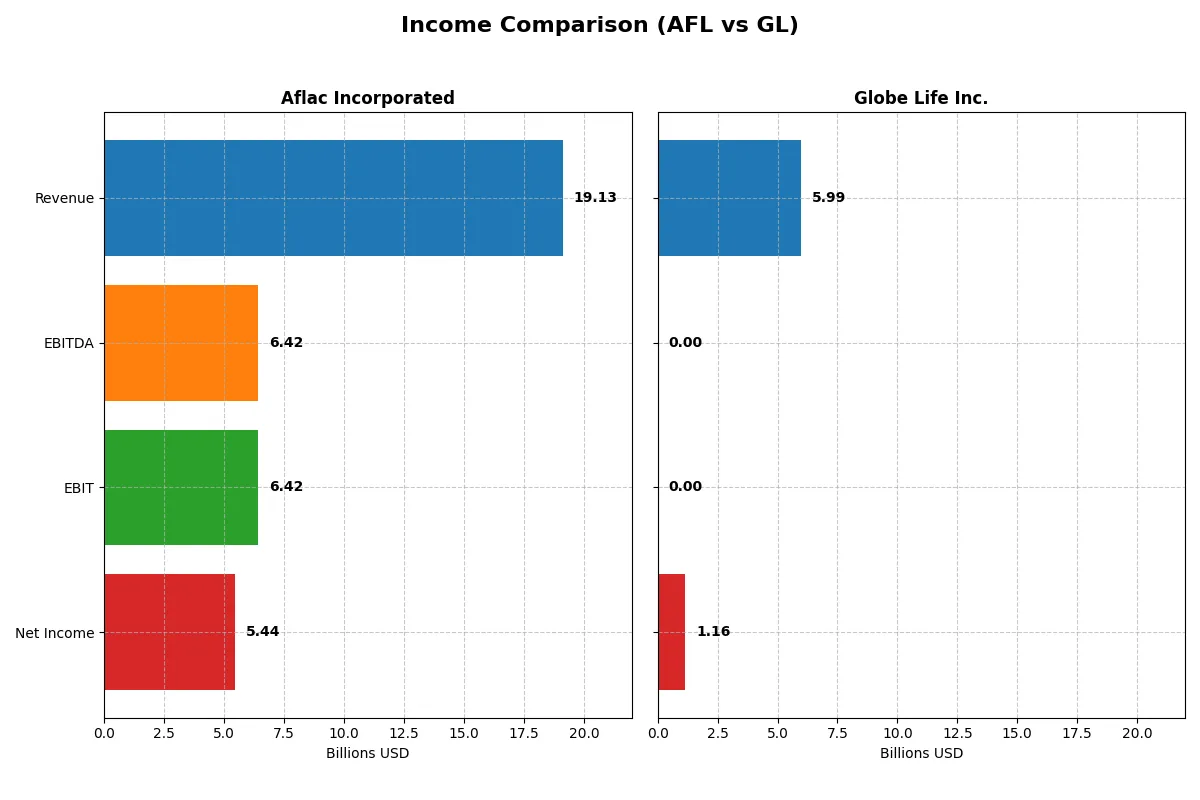
Income Statement Comparison
This data dissects the core profitability and scalability of both corporate engines to reveal who dominates the bottom line:
| Metric | Aflac Incorporated (AFL) | Globe Life Inc. (GL) |
|---|---|---|
| Revenue | 19.13B | 5.78B |
| Cost of Revenue | 12.31B | 3.91B |
| Operating Expenses | 398M | 544M |
| Gross Profit | 6.82B | 1.87B |
| EBITDA | 6.42B | 1.45B |
| EBIT | 6.42B | 1.45B |
| Interest Expense | 197M | 127M |
| Net Income | 5.44B | 1.07B |
| EPS | 9.68 | 11.99 |
| Fiscal Year | 2024 | 2024 |
Income Statement Analysis: The Bottom-Line Duel
This income statement comparison reveals which company operates its financial engine with greater efficiency and momentum.
Aflac Incorporated Analysis
Aflac’s revenue declined modestly to 19.1B in 2024 from 21.5B in 2021, yet net income rose steadily to 5.4B. Its gross margin held firm at 35.6%, while net margin expanded to 28.5%, reflecting disciplined cost control. The 2024 surge in EBIT by 22% shows strong operational momentum despite top-line pressures.
Globe Life Inc. Analysis
Globe Life grew revenue steadily to 5.99B in 2025 from 5.12B in 2021, with net income rising to 1.16B. However, gross and EBIT margins collapsed to zero in 2025 due to accounting classifications, though net margin remained healthy at 19.4%. EPS growth near 95% over five years signals strong shareholder returns despite margin volatility.
Margin Discipline vs. Growth Trajectory
Aflac dominates in margin quality and operating efficiency, showing consistent profitability even amid modest revenue contraction. Globe Life impresses with solid revenue growth and exceptional EPS expansion but struggles with margin stability. Investors seeking stable, margin-driven earnings may favor Aflac, while those prioritizing growth and strong EPS momentum should consider Globe Life’s profile.
Financial Ratios Comparison
These vital ratios act as a diagnostic tool to expose the underlying fiscal health, valuation premiums, and capital efficiency of the companies compared below:
| Ratios | Aflac Incorporated (AFL) | Globe Life Inc. (GL) |
|---|---|---|
| ROE | 20.86% | 20.18% |
| ROIC | N/A | 14.35% |
| P/E | 10.60 | 8.74 |
| P/B | 2.21 | 1.76 |
| Current Ratio | 0 | 0.80 |
| Quick Ratio | 0 | 0.80 |
| D/E | 0.29 | 0.52 |
| Debt-to-Assets | 6.38% | 9.42% |
| Interest Coverage | 32.57 | 10.44 |
| Asset Turnover | 0.16 | 0.20 |
| Fixed Asset Turnover | 49.43 | 20.27 |
| Payout Ratio | 19.97% | 7.98% |
| Dividend Yield | 1.88% | 0.91% |
| Fiscal Year | 2024 | 2024 |
Efficiency & Valuation Duel: The Vital Signs
Financial ratios serve as a company’s DNA, unveiling hidden risks and operational strengths that numbers alone cannot reveal.
Aflac Incorporated
Aflac delivers strong profitability with a 20.9% ROE and a robust 28.5% net margin, indicating operational efficiency. The stock trades at a reasonable P/E of 10.6, suggesting it is attractively valued. Aflac offers a modest 1.9% dividend yield, balancing shareholder returns with reinvestment in core operations.
Globe Life Inc.
Globe Life shows a favorable 19.4% net margin but lacks a reported ROE, complicating profitability assessment. Its valuation metrics are incomplete, with no P/E or P/B available. The company pays no dividends and shows several unfavorable liquidity and coverage ratios, signaling elevated financial risks.
Earnings Strength vs. Financial Stability: Aflac Leads the Pack
Aflac presents a clearer, more favorable ratio profile with solid returns and reasonable valuation. Globe Life’s incomplete and weaker ratios imply higher risk. Investors seeking operational efficiency and consistent returns may find Aflac’s profile better aligned with their goals.
Which one offers the Superior Shareholder Reward?
I see Aflac Incorporated (AFL) offers a more balanced shareholder reward than Globe Life Inc. (GL). AFL pays a higher dividend yield of 1.88% versus GL’s 0.91% in 2024, with a sustainable payout ratio near 20%. AFL’s free cash flow comfortably covers dividends, ensuring reliability. Both companies engage in buybacks, but AFL’s consistent capital return combined with a 21.3 price-to-free-cash-flow ratio signals disciplined capital allocation. GL opts for a lower payout ratio around 8%, focusing more on reinvestment, but its higher leverage and lower dividend yield make it less attractive for income-focused investors. I conclude AFL delivers the superior total return profile for 2026 investors seeking stability and cash returns.
Comparative Score Analysis: The Strategic Profile
The radar chart reveals the fundamental DNA and trade-offs of both firms in valuation, profitability, and leverage metrics:
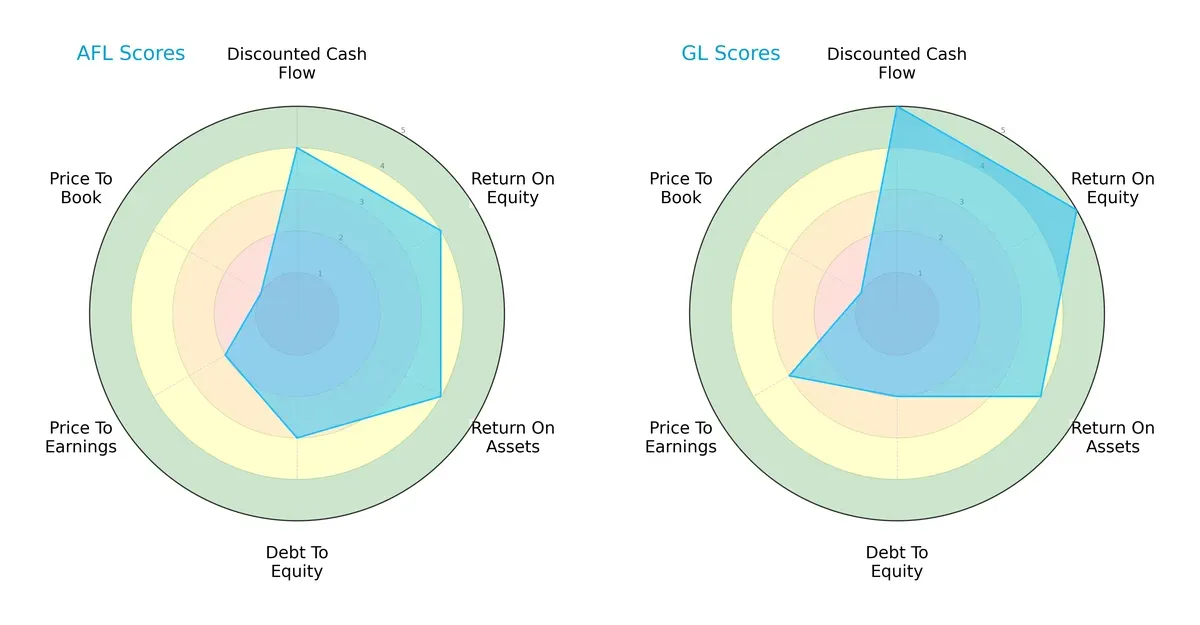
Globe Life (GL) leads with a stronger overall score (4 vs. 3), excelling in discounted cash flow (5 vs. 4) and return on equity (5 vs. 4). Aflac (AFL) matches GL in return on assets (4) but holds a more conservative debt-to-equity position (3 vs. 2 for GL). Both companies struggle with price-to-book valuation (score 1), signaling market skepticism. GL shows a more balanced strength in growth and profitability, while AFL leans on stable asset returns and moderate leverage.
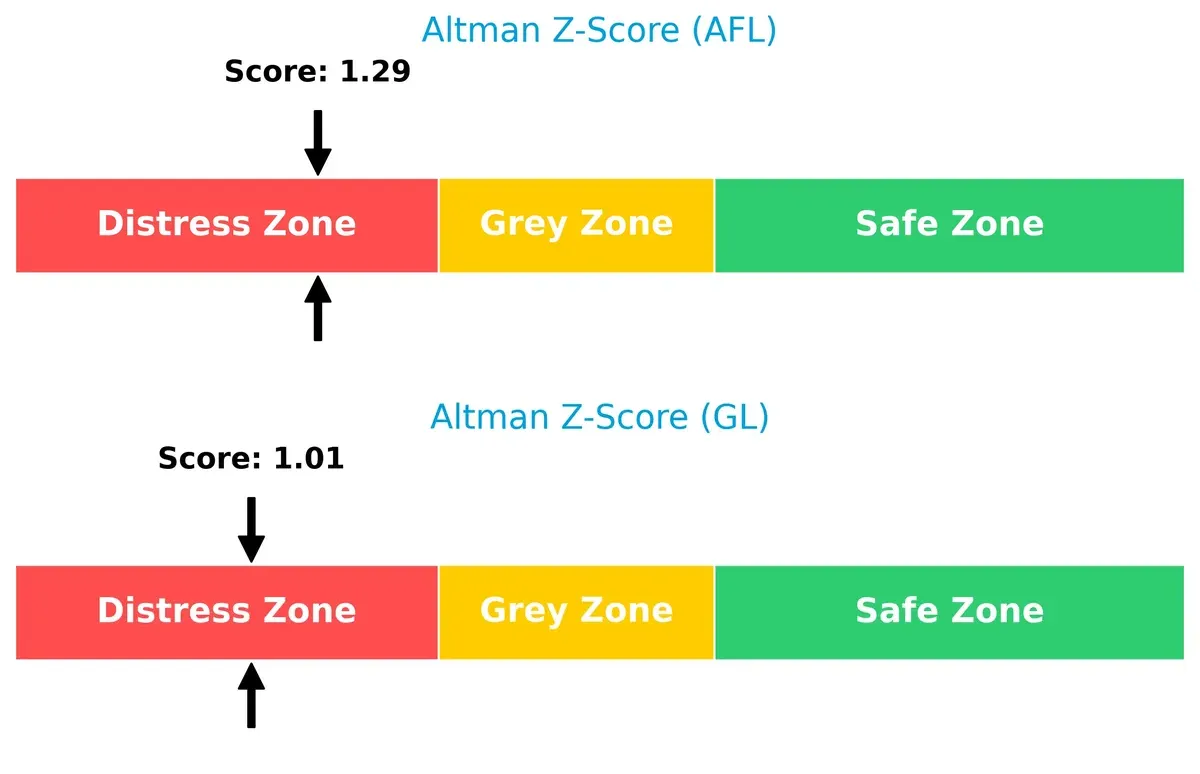
Bankruptcy Risk: Solvency Showdown
The Altman Z-Scores for both AFL (1.29) and GL (1.01) place them in the distress zone, signaling heightened bankruptcy risk in this cycle:
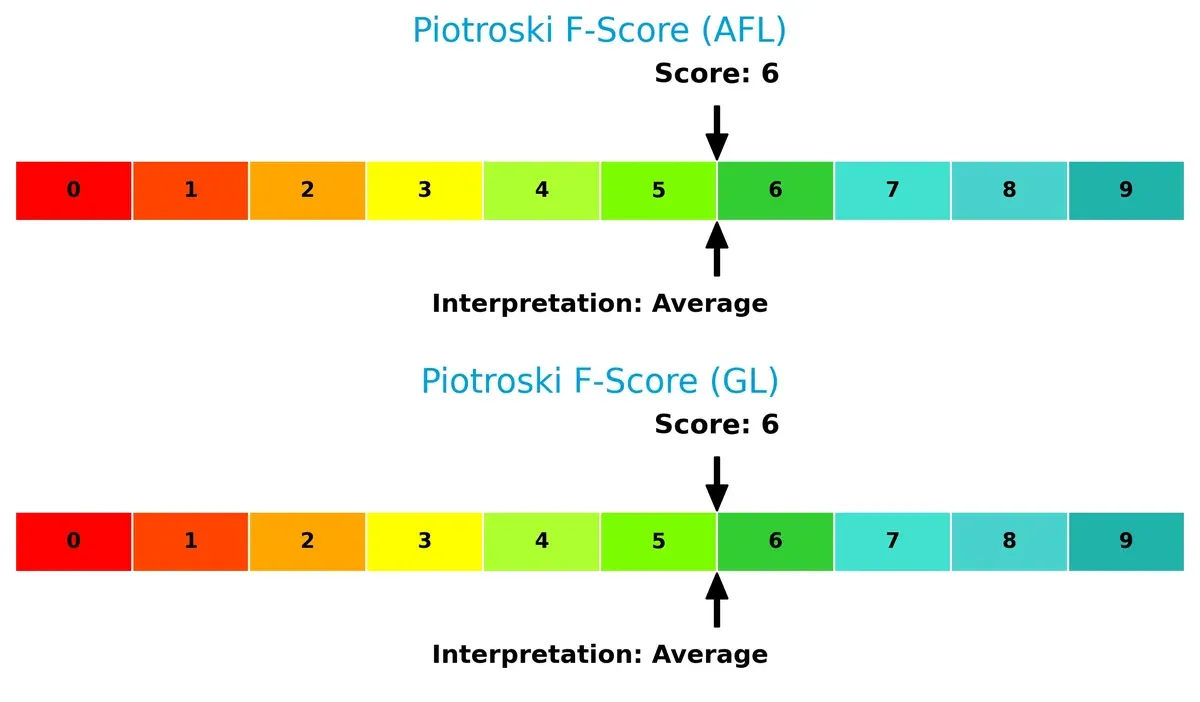
Financial Health: Quality of Operations
Both AFL and GL score a 6 on the Piotroski F-Score, indicating average financial health with no immediate red flags, but also no signs of peak operational strength:
How are the two companies positioned?
This section dissects AFL and GL’s operational DNA by analyzing revenue distribution and internal dynamics. The goal: confront their economic moats to reveal which offers the most resilient competitive advantage today.
Revenue Segmentation: The Strategic Mix
This visual comparison dissects how Aflac Incorporated and Globe Life Inc. diversify their income streams and where their primary sector bets lie:
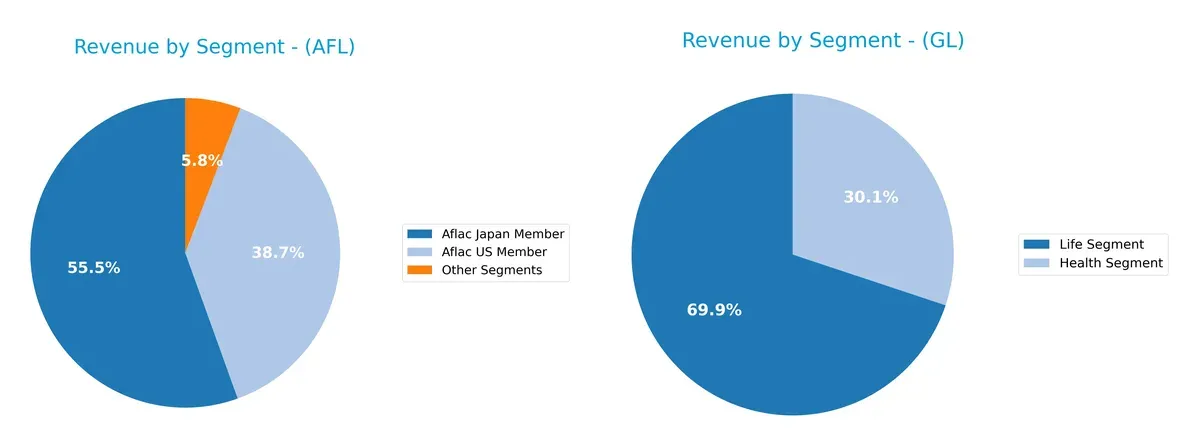
Aflac leans heavily on its Japan Member segment, generating $9.66B in 2024, dwarfing its US Member revenue of $6.74B. Globe Life displays a more balanced mix, with Life segment revenue at $3.26B and Health segment at $1.40B. Aflac’s concentration risks hinge on the Japan market, while Globe Life’s diversification across Life and Health segments anchors resilience and reduces single-market dependence.
Strengths and Weaknesses Comparison
This table compares the Strengths and Weaknesses of Aflac Incorporated and Globe Life Inc.:
Aflac Incorporated Strengths
- Strong profitability with 28.46% net margin
- High ROE at 20.86%
- Favorable debt-to-assets ratio of 6.38%
- Solid interest coverage of 32.57
- Diversified revenue from US and Japan segments
- Favorable PE ratio of 10.6
Globe Life Inc. Strengths
- Favorable net margin of 19.37%
- Positive valuation metrics with PE and PB ratios favorable
- Low debt levels indicated by favorable debt-to-assets ratio
- Diversified segments including health, life, investment, and annuity
- Established presence in multiple insurance product lines
Aflac Incorporated Weaknesses
- Unfavorable ROIC at 0% compared to WACC of 6.58%
- Poor liquidity with zero current and quick ratios
- Low asset turnover of 0.16 indicates inefficient asset use
- Neutral dividend yield at 1.88%
- Limited innovation metrics available
Globe Life Inc. Weaknesses
- Unfavorable ROE and ROIC at 0%
- Unavailable WACC data limits cost of capital assessment
- Zero current and quick ratios signal liquidity risks
- Very low interest coverage at 0
- Unfavorable asset and fixed asset turnover
- No dividend yield reported
Aflac shows robust profitability and financial leverage management but faces liquidity and asset efficiency challenges. Globe Life benefits from diversification and valuation strength but struggles with profitability returns and liquidity metrics, posing strategic considerations in capital allocation and operational efficiency.
The Moat Duel: Analyzing Competitive Defensibility
A structural moat is the only true shield protecting long-term profits from relentless competition erosion. Let’s dissect the moats of two life insurers:
Aflac Incorporated: Intangible Assets Powerhouse
Aflac’s moat stems from strong brand recognition and trusted supplemental insurance products. Its high net margin (28.5%) signals pricing power and margin stability. Yet, declining ROIC warns of weakening capital efficiency heading into 2026.
Globe Life Inc.: Efficient Capital Allocation
Globe Life’s competitive edge lies in disciplined capital use and focused market targeting of middle-income households. Its improving ROIC trend indicates rising profitability potential, contrasting Aflac’s deteriorating returns. Expansion in annuities offers growth avenues.
Moat Resilience: Intangible Brand vs. Capital Efficiency
I see Aflac’s intangible asset moat as historically wider but currently compromised by falling ROIC. Globe Life’s growing ROIC trend suggests a deepening moat driven by operational gains. Globe Life is better positioned to defend and expand market share in the evolving insurance landscape.
Which stock offers better returns?
The past year shows strong bullish trends for both stocks, with Aflac’s growth slowing and Globe Life’s momentum accelerating, highlighting distinct trading dynamics and price movements.
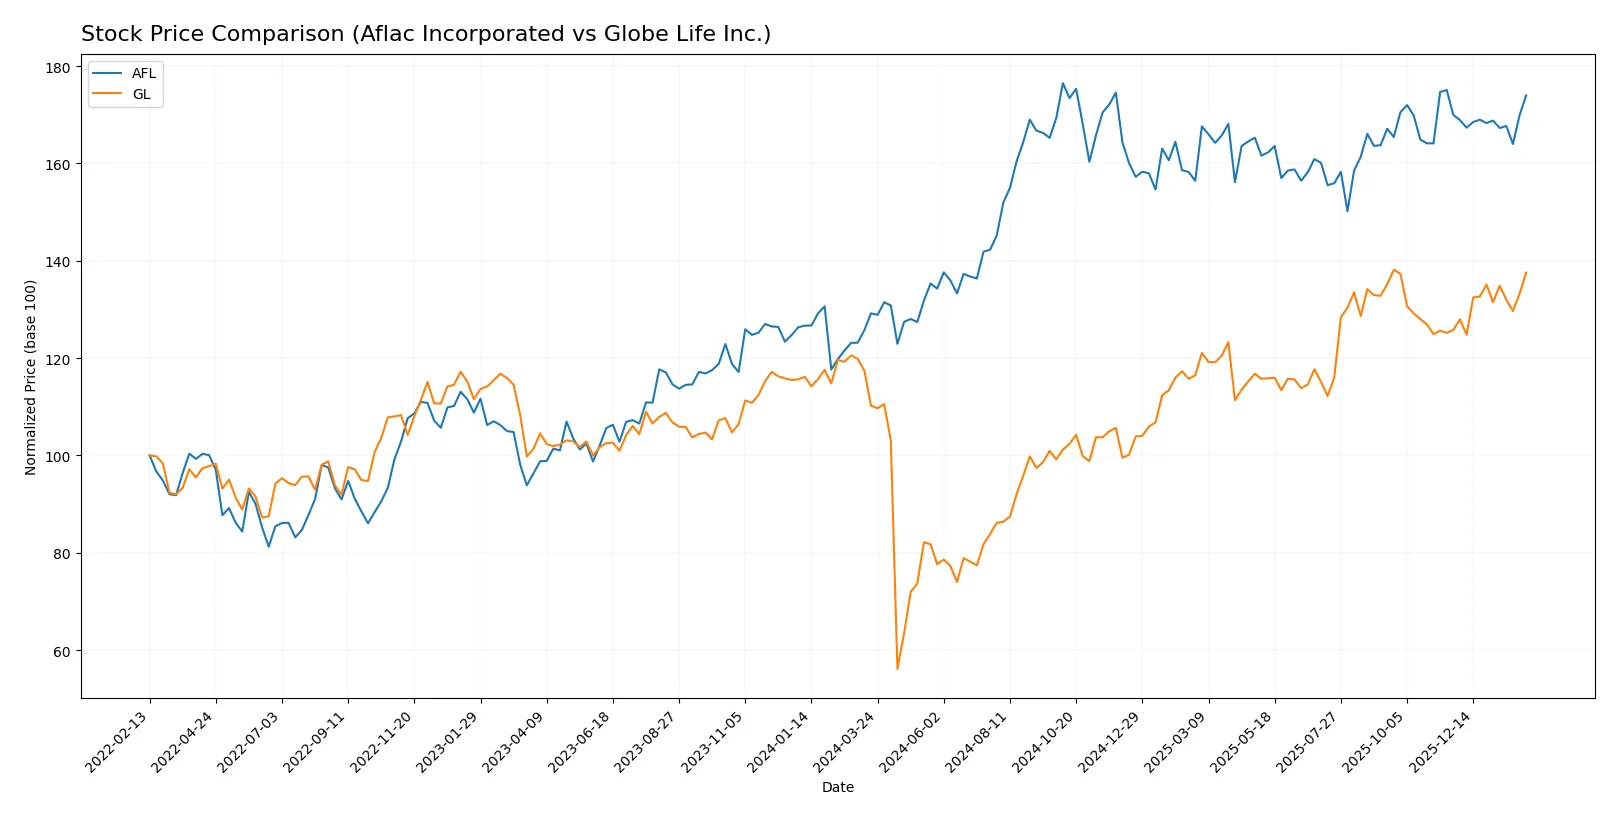
Trend Comparison
Aflac Incorporated’s stock rose 34.67% over the past year, signaling a bullish trend with decelerating momentum and moderate volatility (8.83 std deviation). The price peaked at 115.26 and bottomed at 80.28.
Globe Life Inc.’s stock increased 24.81% in the same period, showing a bullish trend with accelerating momentum and higher volatility (20.08 std deviation). The price ranged from 59.09 to 145.43.
Comparing both, Aflac delivered the highest market performance with stronger overall gains despite slower recent growth, while Globe Life showed accelerating price appreciation.
Target Prices
Analysts present a confident target price range for both Aflac Incorporated and Globe Life Inc., indicating steady growth expectations.
| Company | Target Low | Target High | Consensus |
|---|---|---|---|
| Aflac Incorporated | 101 | 125 | 115.2 |
| Globe Life Inc. | 158 | 176 | 167 |
The consensus target for Aflac at 115.2 slightly exceeds its current price of 113.62, suggesting modest upside. Globe Life’s target consensus of 167 is well above its current 144.82, reflecting stronger analyst optimism.

Don’t Let Luck Decide Your Entry Point
Optimize your entry points with our advanced ProRealTime indicators. You’ll get efficient buy signals with precise price targets for maximum performance. Start outperforming now!
How do institutions grade them?
Aflac Incorporated Grades
The following table summarizes recent institutional grades for Aflac Incorporated.
| Grading Company | Action | New Grade | Date |
|---|---|---|---|
| Barclays | Maintain | Underweight | 2026-01-08 |
| JP Morgan | Maintain | Neutral | 2026-01-05 |
| Raymond James | Maintain | Outperform | 2025-12-30 |
| TD Cowen | Maintain | Hold | 2025-12-22 |
| Morgan Stanley | Maintain | Equal Weight | 2025-11-17 |
| Wells Fargo | Maintain | Equal Weight | 2025-11-07 |
| Evercore ISI Group | Maintain | Underperform | 2025-11-07 |
| Barclays | Maintain | Underweight | 2025-11-05 |
| JP Morgan | Maintain | Neutral | 2025-11-05 |
| Keefe, Bruyette & Woods | Maintain | Market Perform | 2025-10-09 |
Globe Life Inc. Grades
The following table summarizes recent institutional grades for Globe Life Inc.
| Grading Company | Action | New Grade | Date |
|---|---|---|---|
| TD Cowen | Maintain | Buy | 2025-12-11 |
| Morgan Stanley | Maintain | Overweight | 2025-11-17 |
| Keefe, Bruyette & Woods | Maintain | Outperform | 2025-10-28 |
| Truist Securities | Maintain | Buy | 2025-10-24 |
| Wells Fargo | Maintain | Overweight | 2025-10-24 |
| Wells Fargo | Maintain | Overweight | 2025-10-08 |
| Morgan Stanley | Maintain | Overweight | 2025-08-18 |
| Morgan Stanley | Upgrade | Overweight | 2025-08-05 |
| BMO Capital | Maintain | Market Perform | 2025-07-30 |
| Keefe, Bruyette & Woods | Maintain | Outperform | 2025-07-29 |
Which company has the best grades?
Globe Life Inc. consistently earns stronger ratings, including multiple Buy and Overweight grades. Aflac’s grades cluster around Neutral to Underweight. Investors may interpret Globe Life’s ratings as reflecting higher confidence from analysts.
Risks specific to each company
In the challenging 2026 market environment, these categories highlight the critical pressure points and systemic threats confronting both Aflac Incorporated and Globe Life Inc.:
1. Market & Competition
Aflac Incorporated
- Operates in mature supplemental health and life insurance markets facing intensifying competition in Japan and U.S.
Globe Life Inc.
- Targets lower-middle income U.S. households, facing pricing pressure and aggressive competitors in niche segments.
2. Capital Structure & Debt
Aflac Incorporated
- Maintains conservative leverage (D/E 0.29) and strong interest coverage (32.57x), supporting financial stability.
Globe Life Inc.
- Virtually no debt but has zero interest coverage metrics, indicating minimal leverage but potentially underutilized capital structure.
3. Stock Volatility
Aflac Incorporated
- Beta at 0.662 implies moderate sensitivity to market swings, below S&P 500 average volatility.
Globe Life Inc.
- Lower beta (0.464) suggests less stock price volatility, offering defensive positioning in turbulent markets.
4. Regulatory & Legal
Aflac Incorporated
- Exposure to regulatory shifts in U.S. and Japanese insurance laws could impact underwriting and claims practices.
Globe Life Inc.
- U.S.-centric regulatory environment with evolving Medicare supplement rules poses compliance risks.
5. Supply Chain & Operations
Aflac Incorporated
- Complex operations across two countries increase operational risk but benefit from diversified revenue streams.
Globe Life Inc.
- More concentrated U.S. operations simplify supply chain but raise vulnerability to domestic disruptions.
6. ESG & Climate Transition
Aflac Incorporated
- Increasing pressure to integrate ESG in underwriting and investment strategies amid rising investor scrutiny.
Globe Life Inc.
- ESG initiatives less transparent; lagging behind peers on climate risk disclosures.
7. Geopolitical Exposure
Aflac Incorporated
- Significant revenue from Japan exposes AFL to geopolitical tensions and currency fluctuations.
Globe Life Inc.
- Focused on U.S. market, limiting international geopolitical risks but increasing domestic policy sensitivity.
Which company shows a better risk-adjusted profile?
Aflac’s principal risk is its geopolitical exposure and operational complexity in Japan, adding currency and regulatory uncertainty. Globe Life faces the biggest risk in its limited diversification and weaker financial metrics, notably zero interest coverage and unfavorable liquidity ratios. Despite Aflac’s complexity risks, it exhibits a stronger capital structure and broader diversification. Globe Life’s lower volatility is offset by financial fragility and concentrated market exposure. Recent data showing Aflac’s favorable debt metrics and interest coverage reinforce my confidence in its risk-adjusted profile over Globe Life’s.
Final Verdict: Which stock to choose?
Aflac Incorporated’s superpower lies in its robust profitability and disciplined capital structure, delivering consistent returns despite a challenging macro environment. Its declining ROIC signals a need for caution, highlighting a potential value erosion risk. This company suits investors with an appetite for steady income and value recovery potential in a core insurance portfolio.
Globe Life Inc. boasts a strategic moat through improving operational returns and a growing ROIC trend, signaling enhanced capital efficiency. While it carries more financial risk and less liquidity than Aflac, its accelerating price momentum and favorable ratings suggest it fits well in portfolios targeting growth with moderate risk tolerance.
If you prioritize stable profitability and income generation, Aflac is the compelling choice due to its strong net margins and conservative leverage. However, if you seek growth through improving capital efficiency and are comfortable with higher volatility, Globe Life offers better momentum and a developing moat. Both present distinct risk profiles warranting close monitoring.
Disclaimer: Investment carries a risk of loss of initial capital. The past performance is not a reliable indicator of future results. Be sure to understand risks before making an investment decision.
Go Further
I encourage you to read the complete analyses of Aflac Incorporated and Globe Life Inc. to enhance your investment decisions: