Home > Comparison > Technology > AMD vs TSEM
The strategic rivalry between Advanced Micro Devices, Inc. (AMD) and Tower Semiconductor Ltd. shapes the semiconductor sector’s evolution. AMD operates as an integrated chip designer with a strong focus on high-performance computing and graphics solutions. Tower Semiconductor serves as a specialized foundry offering analog and mixed-signal wafer fabrication services. This analysis pits AMD’s growth-driven innovation against Tower’s niche manufacturing edge to identify the superior risk-adjusted opportunity for a diversified portfolio in 2026.
Table of contents
Companies Overview
Advanced Micro Devices, Inc. and Tower Semiconductor Ltd. stand as pivotal players in the semiconductor industry with distinct market roles.
Advanced Micro Devices, Inc.: Leading Innovator in High-Performance Computing
Advanced Micro Devices dominates as a global semiconductor powerhouse focused on microprocessors and GPUs. Its revenue stems chiefly from chips powering desktops, servers, and gaming consoles. In 2026, AMD strategically prioritizes expanding its data center and professional graphics segments to capture growing cloud and AI workloads.
Tower Semiconductor Ltd.: Specialist Foundry for Analog and Mixed-Signal Chips
Tower Semiconductor operates as an independent foundry specializing in analog-intensive mixed-signal semiconductor manufacturing. It generates revenue through wafer fabrication and bespoke process technologies for diverse industries like automotive and medical devices. The company’s 2026 strategy emphasizes increasing capacity and enhancing design enablement services for fabless clients.
Strategic Collision: Similarities & Divergences
AMD and Tower Semiconductor diverge sharply in business philosophy; AMD integrates design with high-performance computing chips, while Tower offers an open foundry model focused on analog processes. They compete in the broader semiconductor ecosystem, with AMD targeting end-user processors and Tower enabling specialized chip production. Their investment profiles contrast: AMD’s scale and innovation leadership versus Tower’s niche manufacturing expertise.
Income Statement Comparison
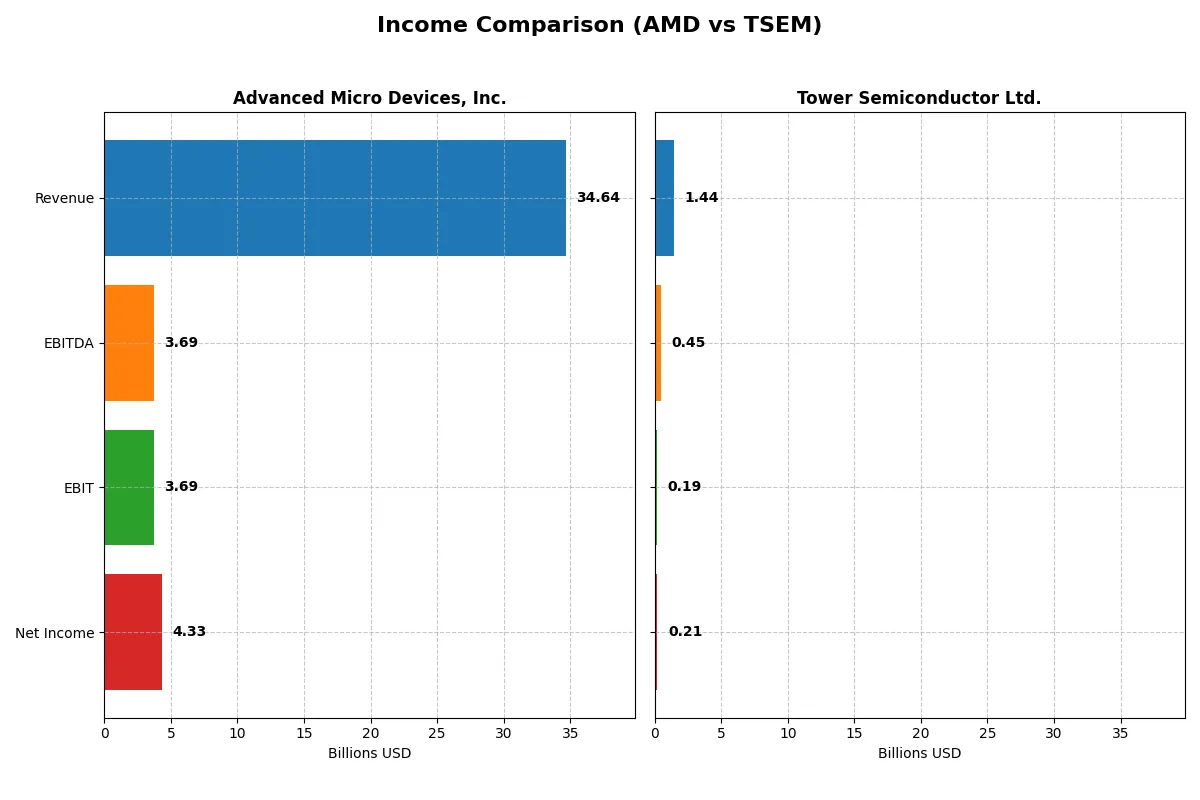
This data dissects the core profitability and scalability of both corporate engines to reveal who dominates the bottom line:
| Metric | Advanced Micro Devices, Inc. (AMD) | Tower Semiconductor Ltd. (TSEM) |
|---|---|---|
| Revenue | 34.6B | 1.44B |
| Cost of Revenue | 17.5B | 1.10B |
| Operating Expenses | 13.5B | 148M |
| Gross Profit | 17.2B | 339M |
| EBITDA | 3.69B | 451M |
| EBIT | 3.69B | 185M |
| Interest Expense | 131M | 5.86M |
| Net Income | 4.34B | 208M |
| EPS | 2.67 | 1.87 |
| Fiscal Year | 2025 | 2024 |
Income Statement Analysis: The Bottom-Line Duel
This income statement comparison reveals which company converts revenue into profit more efficiently and sustains growth momentum.
Advanced Micro Devices, Inc. Analysis
AMD’s revenue surged from $16.4B in 2021 to $34.6B in 2025, more than doubling in four years. Net income rose from $3.16B to $4.33B, reflecting strong operational execution. Its gross margin holds near 50%, while net margin improved to 12.5%, signaling excellent cost management and expanding profitability in 2025.
Tower Semiconductor Ltd. Analysis
TSEM’s revenue grew modestly to $1.44B in 2024 from $1.27B in 2020, a 13.5% rise over five years. Net income increased sharply to $208M in 2024 from $82M in 2020, despite a recent net margin decline to 14.5%. The company’s EBIT margin remains solid at 12.9%, but recent year growth stalled, indicating margin pressure.
Margin Strength vs. Growth Scale
AMD dominates with robust revenue growth and expanding net margins, reflecting scalable profitability. TSEM boasts attractive net margin levels but struggles with recent growth and margin contraction. For investors, AMD’s profile offers a compelling blend of scale and efficiency, while TSEM suits those prioritizing margin stability over rapid growth.
Financial Ratios Comparison
These vital ratios act as a diagnostic tool to expose the underlying fiscal health, valuation premiums, and capital efficiency of the companies compared below:
| Ratios | Advanced Micro Devices, Inc. (AMD) | Tower Semiconductor Ltd. (TSEM) |
|---|---|---|
| ROE | 2.85% (2024) | 7.83% (2024) |
| ROIC | 2.49% (2024) | 6.41% (2024) |
| P/E | 124x (2024) | 28x (2024) |
| P/B | 3.52x (2024) | 2.16x (2024) |
| Current Ratio | 2.62 (2024) | 6.18 (2024) |
| Quick Ratio | 1.83 (2024) | 5.23 (2024) |
| D/E | 3.8% (2024) | 6.8% (2024) |
| Debt-to-Assets | 3.2% (2024) | 5.9% (2024) |
| Interest Coverage | 20.7x (2024) | 32.6x (2024) |
| Asset Turnover | 0.37 (2024) | 0.47 (2024) |
| Fixed Asset Turnover | 10.63 (2024) | 1.11 (2024) |
| Payout ratio | 0% (2024) | 0% (2024) |
| Dividend yield | 0% (2024) | 0% (2024) |
| Fiscal Year | 2024 | 2024 |
Efficiency & Valuation Duel: The Vital Signs
Financial ratios act as a company’s DNA, unveiling hidden risks and operational prowess that shape investor confidence and portfolio decisions.
Advanced Micro Devices, Inc.
AMD’s profitability reveals mixed signals: a strong net margin of 12.51% contrasts sharply with zero reported ROE and ROIC, signaling efficiency concerns. Its P/E ratio at 80.54 marks the stock as expensive compared to peers. With no dividends, AMD prioritizes aggressive reinvestment into R&D, allocating 25% of revenue to sustain growth and innovation.
Tower Semiconductor Ltd.
Tower Semiconductor delivers a favorable net margin of 14.47%, with a moderate ROE of 7.83% and neutral ROIC at 6.41%, suggesting operational steadiness. The P/E ratio at 27.54 is elevated but less stretched than AMD’s. Despite no dividend yield, Tower retains strong liquidity (current ratio 6.18) and focuses on measured reinvestment, balancing capital discipline and growth.
Premium Valuation vs. Operational Stability
AMD’s high valuation and reinvestment strategy contrast with Tower Semiconductor’s balanced profitability and liquidity. Tower offers a more stable risk-reward profile, while AMD suits investors seeking aggressive growth exposure despite operational uncertainties.
Which one offers the Superior Shareholder Reward?
I see both AMD and Tower Semiconductor (TSEM) avoid dividends, focusing on reinvestment and buybacks to reward shareholders. AMD’s payout ratio remains zero with no dividends, but it sustains strong free cash flow of 3.4B and has an intense buyback program. TSEM also pays no dividends, yet its free cash flow is minimal at 0.11B, reflecting heavy capex of 3.9B that limits buyback capacity. AMD’s robust free cash flow coverage and capital efficiency suggest a more sustainable distribution model. I conclude AMD offers the superior total shareholder return profile in 2026.
Comparative Score Analysis: The Strategic Profile
The radar chart below reveals the fundamental DNA and trade-offs of Advanced Micro Devices, Inc. (AMD) and Tower Semiconductor Ltd. (TSEM), highlighting their financial strengths and weaknesses:
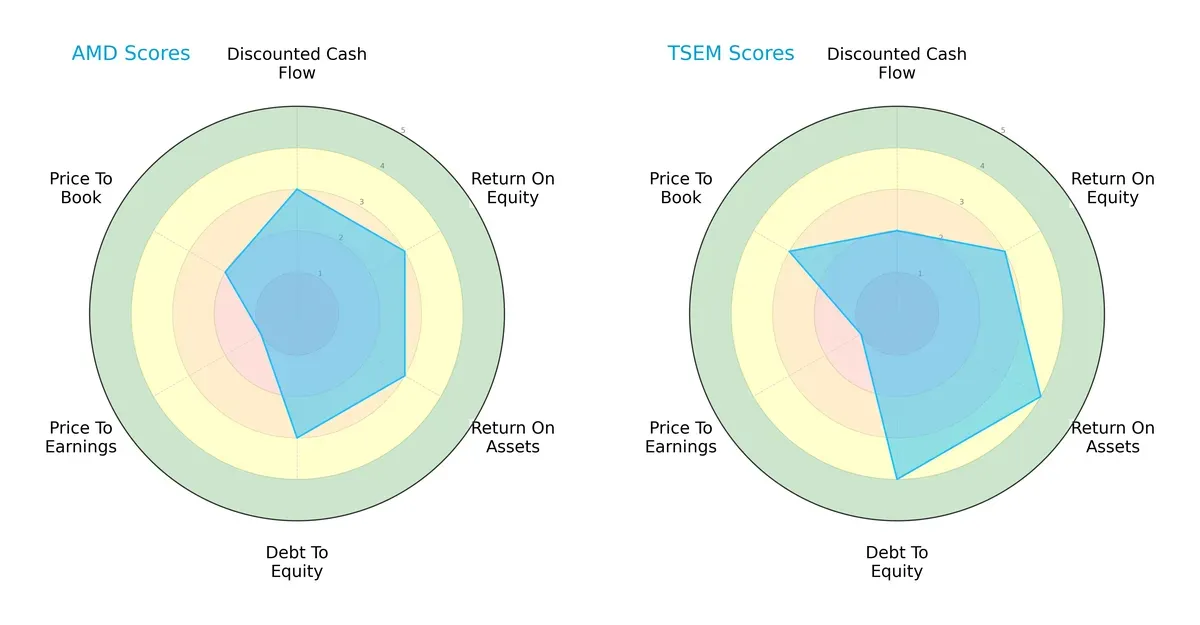
AMD and TSEM share a similar overall score of 3, indicating moderate financial health. AMD excels in discounted cash flow and balanced return ratios (ROE and ROA at 3 each), but its valuation metrics lag, especially the very unfavorable P/E score of 1. TSEM shows more strength in asset utilization and debt management, scoring 4 in ROA and debt-to-equity, suggesting a more resilient balance sheet. However, TSEM’s slightly lower DCF score (2) shows less optimism on cash flow valuation. Overall, TSEM presents a more balanced profile, while AMD leans on operational efficiency but suffers from valuation concerns.
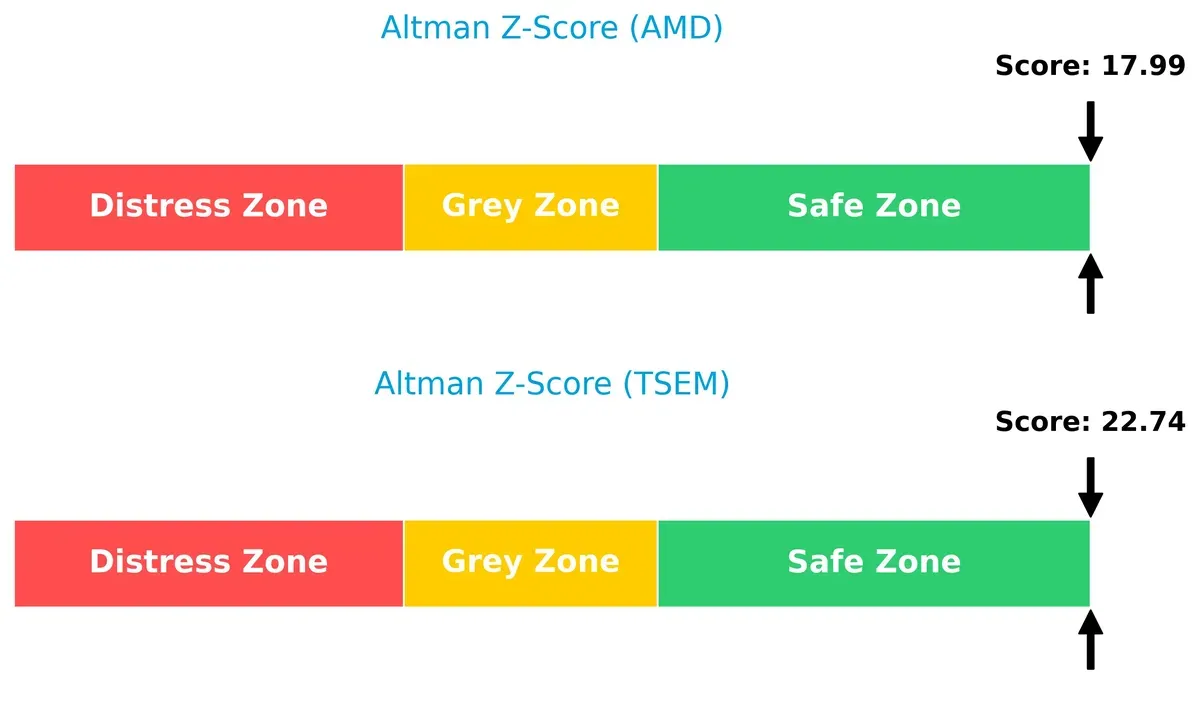
Bankruptcy Risk: Solvency Showdown
The Altman Z-Scores indicate both firms stand firmly in the safe zone, with TSEM scoring 22.7 and AMD at 18.0. This wide margin signals exceptional solvency and low bankruptcy risk for both, but TSEM’s higher score implies it is even more insulated from financial distress in this cycle:
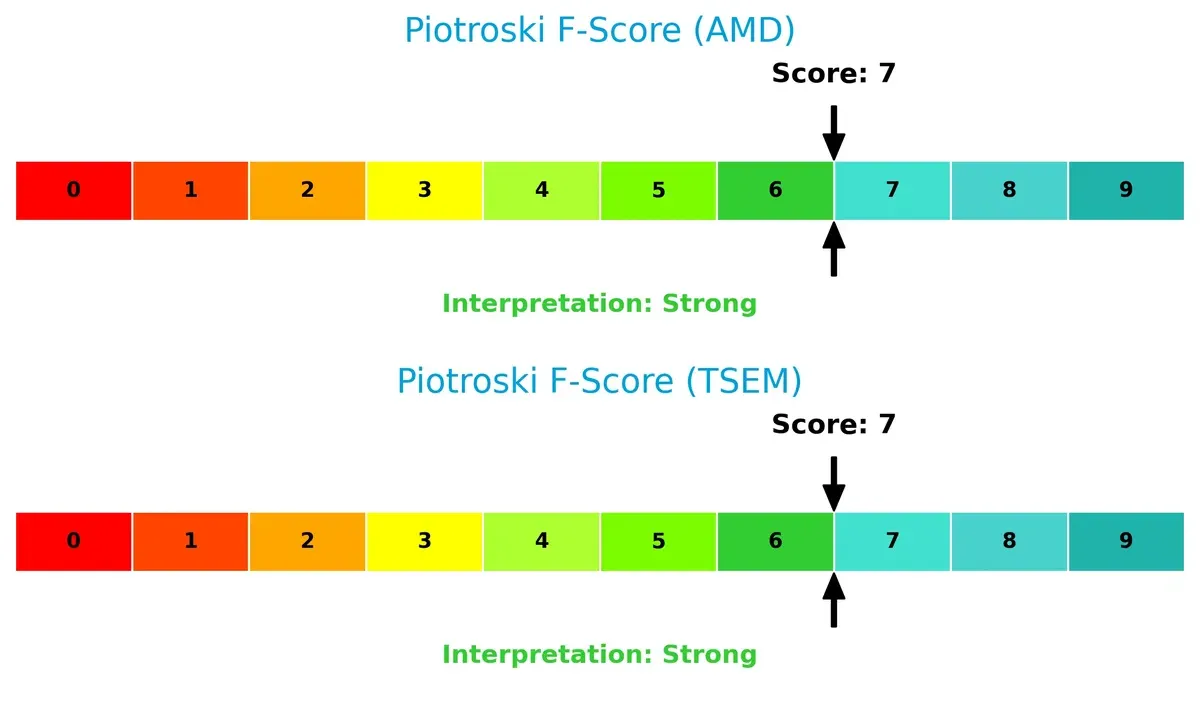
Financial Health: Quality of Operations
Both AMD and TSEM score a strong 7 on the Piotroski F-Score, reflecting robust financial health and operational efficiency. Neither shows red flags, suggesting solid profitability, liquidity, and leverage metrics across the board:
How are the two companies positioned?
This section dissects AMD and TSEM’s operational DNA by comparing their revenue distribution and internal dynamics. The goal is to confront their economic moats and identify which model offers the most resilient, sustainable competitive advantage today.
Revenue Segmentation: The Strategic Mix
This comparison dissects how Advanced Micro Devices, Inc. (AMD) and Tower Semiconductor Ltd. diversify their income streams and where their primary sector bets lie:
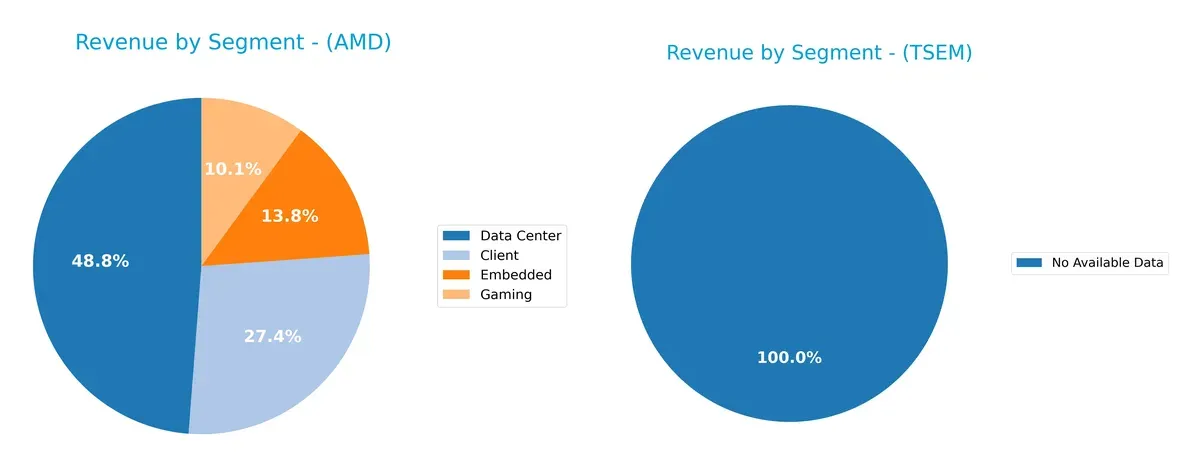
AMD’s revenue shows clear diversification across Client ($7.1B), Data Center ($12.6B), Embedded ($3.6B), and Gaming ($2.6B). Tower Semiconductor lacks available segment data for 2024, preventing direct comparison. AMD’s heavy reliance on Data Center revenue anchors its growth, leveraging infrastructure dominance and ecosystem lock-in. The broad mix reduces concentration risk and signals strategic agility in volatile tech cycles.
Strengths and Weaknesses Comparison
This table compares the strengths and weaknesses of AMD and TSEM:
AMD Strengths
- Diversified revenue across Client, Data Center, Embedded, and Gaming segments
- Strong global presence including US, China, Singapore, and Taiwan
- Favorable net margin of 12.51%
- Low debt-to-equity and strong interest coverage ratio
TSEM Strengths
- Favorable net margin of 14.47%
- Low debt-to-equity ratio with strong interest coverage
- Favorable weighted average cost of capital (7.98%)
- Good quick ratio of 5.23 indicating liquidity
AMD Weaknesses
- Unfavorable ROE and ROIC at 0% indicating weak capital efficiency
- High PE ratio of 80.54 suggests overvaluation risk
- Unfavorable current and quick ratios indicate liquidity concerns
- Poor asset and fixed asset turnover ratios
- No dividend yield
TSEM Weaknesses
- Unfavorable ROE of 7.83% below ideal benchmarks
- Unfavorable current ratio of 6.18 signals potential short-term asset management issues
- PE ratio of 27.54 considered high relative to earnings
- No dividend yield
Both companies show strong profitability through net margins and controlled debt levels. AMD’s diversified product and geographic mix contrasts with TSEM’s healthier liquidity and WACC metrics. However, both face challenges in capital efficiency and valuation, critical factors for long-term strategic positioning.
The Moat Duel: Analyzing Competitive Defensibility
A structural moat is the only reliable shield protecting long-term profits from relentless competitive erosion in dynamic markets like semiconductors:
Advanced Micro Devices, Inc. (AMD): Innovation-Driven Product Ecosystem
AMD’s moat stems from cutting-edge chip design and brand strength, reflected in strong revenue growth and margin stability. Yet, declining ROIC signals looming efficiency risks in 2026 amid intensifying competition.
Tower Semiconductor Ltd. (TSEM): Specialized Manufacturing Expertise
TSEM’s moat lies in its analog mixed-signal foundry capabilities, a niche unlike AMD’s broad product portfolio. Despite recent margin pressure, improving ROIC suggests strengthening operational focus and potential to capture analog market share.
Innovation Scale vs. Niche Mastery: The Moat Showdown
AMD boasts a wider moat through scale and innovation, but its eroding capital returns raise caution. TSEM’s narrower moat gains depth with rising profitability, positioning it as better suited to defend its specialized market niche.
Which stock offers better returns?
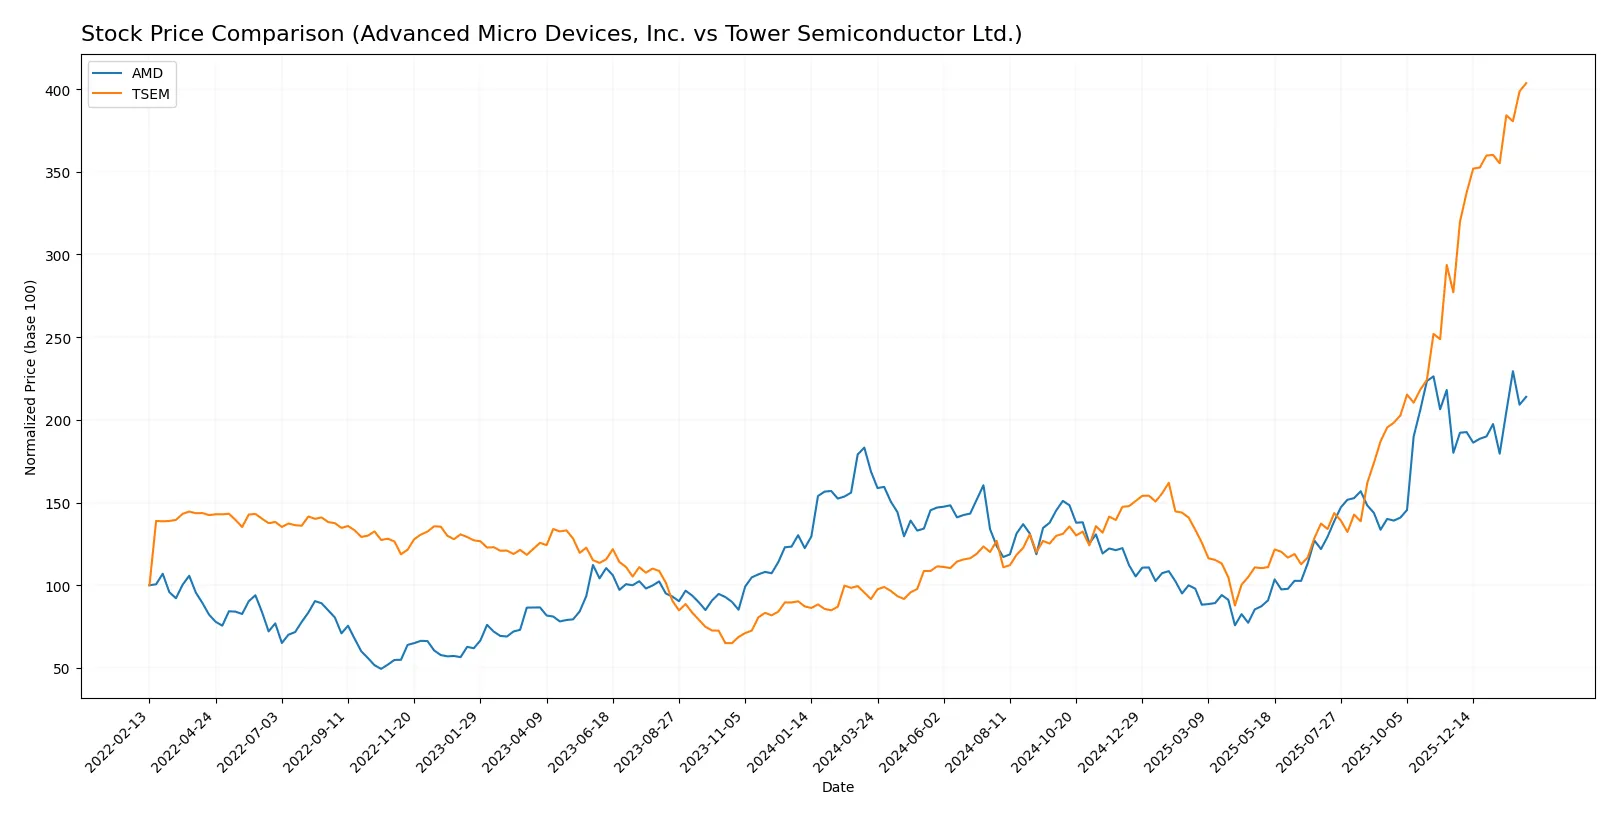
Both Advanced Micro Devices, Inc. (AMD) and Tower Semiconductor Ltd. (TSEM) exhibit strong bullish trends over the past 12 months, with TSEM showing notably higher price appreciation and accelerating momentum.
Trend Comparison
Advanced Micro Devices, Inc. (AMD) shows a 26.72% price increase over the past year, signaling a bullish trend with accelerating momentum and a high volatility level (41.61 std dev). The stock’s price ranged from $85.76 to $259.68.
Tower Semiconductor Ltd. (TSEM) displays a remarkable 340.28% gain over the same period, also bullish with acceleration but lower volatility (27.33 std dev). Its price fluctuated between $29.65 and $136.40.
TSEM outperformed AMD with a substantially higher total return, despite both stocks accelerating upward. TSEM’s price appreciation clearly leads the market performance comparison.
Target Prices
Analysts provide a bullish consensus for both Advanced Micro Devices, Inc. (AMD) and Tower Semiconductor Ltd. (TSEM).
| Company | Target Low | Target High | Consensus |
|---|---|---|---|
| Advanced Micro Devices, Inc. | 225 | 380 | 291.56 |
| Tower Semiconductor Ltd. | 66 | 125 | 96 |
AMD’s consensus target of $291.56 implies a 20% upside from the current $242.11 price, signaling strong growth expectations. TSEM’s $96 consensus target is well below its $136.40 price, suggesting potential downside or overvaluation risk.

Don’t Let Luck Decide Your Entry Point
Optimize your entry points with our advanced ProRealTime indicators. You’ll get efficient buy signals with precise price targets for maximum performance. Start outperforming now!
How do institutions grade them?
Advanced Micro Devices, Inc. Grades
The table below summarizes recent institutional grades for Advanced Micro Devices, Inc.
| Grading Company | Action | New Grade | Date |
|---|---|---|---|
| Wells Fargo | Maintain | Overweight | 2026-01-30 |
| Piper Sandler | Maintain | Overweight | 2026-01-26 |
| UBS | Maintain | Buy | 2026-01-26 |
| Bernstein | Maintain | Market Perform | 2026-01-21 |
| Keybanc | Upgrade | Overweight | 2026-01-13 |
| Truist Securities | Maintain | Buy | 2025-12-19 |
| Cantor Fitzgerald | Maintain | Overweight | 2025-12-16 |
| Morgan Stanley | Maintain | Equal Weight | 2025-11-12 |
| Wedbush | Maintain | Outperform | 2025-11-12 |
| Rosenblatt | Maintain | Buy | 2025-11-12 |
Tower Semiconductor Ltd. Grades
Below is a summary of recent institutional grades for Tower Semiconductor Ltd.
| Grading Company | Action | New Grade | Date |
|---|---|---|---|
| Benchmark | Maintain | Buy | 2026-01-09 |
| Wedbush | Downgrade | Neutral | 2025-12-31 |
| Benchmark | Maintain | Buy | 2025-11-11 |
| Susquehanna | Maintain | Positive | 2025-11-11 |
| Wedbush | Maintain | Outperform | 2025-11-11 |
| Barclays | Maintain | Equal Weight | 2025-11-11 |
| Benchmark | Maintain | Buy | 2025-09-08 |
| Susquehanna | Maintain | Positive | 2025-08-05 |
| Benchmark | Maintain | Buy | 2025-08-05 |
| Benchmark | Maintain | Buy | 2025-08-04 |
Which company has the best grades?
Advanced Micro Devices, Inc. holds generally stronger grades, including multiple “Buy” and “Overweight” ratings. Tower Semiconductor shows consistent “Buy” but includes a recent downgrade to “Neutral.” This divergence may influence investor confidence differently.
Risks specific to each company
The following categories identify the critical pressure points and systemic threats facing both firms in the 2026 market environment:
1. Market & Competition
Advanced Micro Devices, Inc. (AMD)
- Faces intense rivalry from established giants like Intel and Nvidia, risking margin pressure and market share loss.
Tower Semiconductor Ltd. (TSEM)
- Competes in niche analog and mixed-signal foundry market with fewer, more specialized competitors, offering more defensible positioning.
2. Capital Structure & Debt
Advanced Micro Devices, Inc. (AMD)
- Maintains a conservative debt profile with strong interest coverage, reducing financial risk despite some liquidity ratio concerns.
Tower Semiconductor Ltd. (TSEM)
- Exhibits low leverage and excellent interest coverage, signaling robust financial stability and low default risk.
3. Stock Volatility
Advanced Micro Devices, Inc. (AMD)
- High beta (1.95) indicates elevated stock price volatility, increasing investment risk in turbulent markets.
Tower Semiconductor Ltd. (TSEM)
- Low beta (0.89) suggests more stable stock price movements, appealing to risk-averse investors.
4. Regulatory & Legal
Advanced Micro Devices, Inc. (AMD)
- Must navigate complex US and global semiconductor regulations, including export controls and IP litigation risks.
Tower Semiconductor Ltd. (TSEM)
- Faces regulatory scrutiny in multiple jurisdictions but benefits from less exposure to US-China trade tensions.
5. Supply Chain & Operations
Advanced Micro Devices, Inc. (AMD)
- Relies heavily on third-party foundries; supply chain disruptions could delay product launches and impact revenues.
Tower Semiconductor Ltd. (TSEM)
- Operates own foundry facilities, reducing dependency yet exposing it to operational risks and capital expenditures.
6. ESG & Climate Transition
Advanced Micro Devices, Inc. (AMD)
- Faces pressure to reduce carbon footprint amid growing investor focus on sustainability in tech manufacturing.
Tower Semiconductor Ltd. (TSEM)
- Emerging ESG policies, but smaller scale limits both risk and capacity to invest heavily in climate initiatives.
7. Geopolitical Exposure
Advanced Micro Devices, Inc. (AMD)
- High exposure to US-China tensions impacting supply chains and market access, increasing geopolitical risk.
Tower Semiconductor Ltd. (TSEM)
- Israeli base provides some geopolitical insulation but also regional instability risks that could disrupt operations.
Which company shows a better risk-adjusted profile?
AMD’s main risk is its elevated stock volatility and competitive pressure from tech giants. TSEM’s largest risk lies in operational capital intensity and geopolitical exposure. I find TSEM’s lower volatility, stronger balance sheet, and safer Altman Z-Score offer a superior risk-adjusted profile. Notably, TSEM’s debt-to-equity ratio remains impressively low at 0.07, underscoring financial prudence amid a complex geopolitical landscape.
Final Verdict: Which stock to choose?
Advanced Micro Devices, Inc. (AMD) wields a superpower in rapid innovation and robust revenue growth, driving strong cash flow despite a challenging capital efficiency profile. Its declining ROIC is a point of vigilance, signaling caution on sustainable value creation. AMD fits an aggressive growth portfolio willing to tolerate volatility for potential market disruption.
Tower Semiconductor Ltd. (TSEM) benefits from a strategic moat rooted in steady manufacturing expertise, coupled with improving profitability and a resilient balance sheet. Its financial stability surpasses AMD’s, though growth momentum is less explosive. TSEM suits a GARP (Growth at a Reasonable Price) portfolio focused on measured expansion and risk control.
If you prioritize aggressive growth and market share capture, AMD is the compelling choice due to its innovation-driven cash machine and bullish price acceleration. However, if you seek better stability with improving profitability and a more consistent financial foundation, TSEM offers superior risk management and a promising upward ROIC trend. Both present distinct analytical scenarios aligned with different investor risk appetites and strategy preferences.
Disclaimer: Investment carries a risk of loss of initial capital. The past performance is not a reliable indicator of future results. Be sure to understand risks before making an investment decision.
Go Further
I encourage you to read the complete analyses of Advanced Micro Devices, Inc. and Tower Semiconductor Ltd. to enhance your investment decisions: