Home > Comparison > Technology > AMD vs TXN
The strategic rivalry between Advanced Micro Devices, Inc. (AMD) and Texas Instruments Incorporated (TXN) defines the current trajectory of the semiconductor industry. AMD drives innovation with a focus on high-performance computing and graphics solutions, while TXN excels as a diversified analog and embedded processing leader. This analysis aims to reveal which company’s business model offers superior risk-adjusted returns for a diversified portfolio navigating technology sector volatility.
Table of contents
Companies Overview
Advanced Micro Devices and Texas Instruments both command significant influence in the semiconductor industry, shaping technology’s backbone globally.
Advanced Micro Devices, Inc.: Innovator in High-Performance Computing
AMD operates primarily as a semiconductor designer and manufacturer, generating revenue through its Computing and Graphics, and Enterprise segments. Its portfolio includes x86 microprocessors, GPUs, and semi-custom SoC products for PCs, servers, and gaming consoles. In 2026, AMD focuses strategically on expanding its data center presence and accelerating GPU innovation to capture growth in cloud and AI workloads.
Texas Instruments Incorporated: Leader in Analog and Embedded Solutions
Texas Instruments specializes in analog and embedded processing semiconductors, selling power management products, microcontrollers, and digital signal processors. Its revenue streams stem from diversified end markets such as industrial, automotive, and personal electronics. In 2026, TI prioritizes optimizing its analog product lines while enhancing embedded processing capabilities to serve evolving industrial and automotive demands.
Strategic Collision: Similarities & Divergences
Both companies excel in semiconductors but pursue distinct philosophies: AMD champions high-performance, integrated computing platforms, while TI emphasizes broad analog and embedded versatility. Their primary battleground is in specialized chips for evolving technology sectors like AI and automotive electronics. Investors face contrasting profiles: AMD’s growth-driven, innovation-heavy model versus TI’s stable, cash-generative analog dominance.
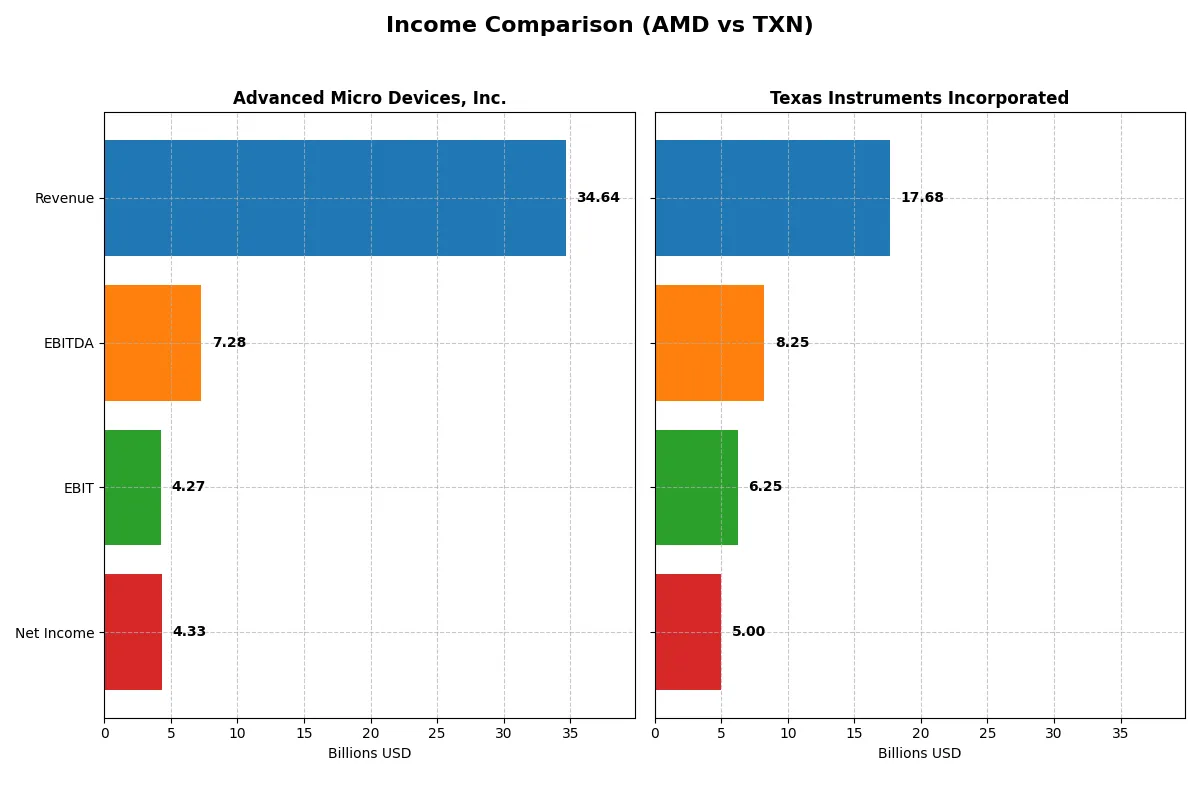
Income Statement Comparison
The following data dissects the core profitability and scalability of both corporate engines to reveal who dominates the bottom line:
| Metric | Advanced Micro Devices, Inc. (AMD) | Texas Instruments Incorporated (TXN) |
|---|---|---|
| Revenue | 34.6B | 17.7B |
| Cost of Revenue | 17.5B | 7.6B |
| Operating Expenses | 13.5B | 4.1B |
| Gross Profit | 17.2B | 10.1B |
| EBITDA | 7.3B | 8.3B |
| EBIT | 4.3B | 6.3B |
| Interest Expense | 131M | 543M |
| Net Income | 4.3B | 5.0B |
| EPS | 2.67 | 5.45 |
| Fiscal Year | 2025 | 2025 |
Income Statement Analysis: The Bottom-Line Duel
This income statement comparison reveals which company converts sales into profit more efficiently, exposing each firm’s operational strength and momentum.
Advanced Micro Devices, Inc. Analysis
AMD’s revenue surged from $16.4B in 2021 to $34.6B in 2025, reflecting a strong growth trajectory. Net income jumped from $3.16B to $4.34B, underpinning expanding profitability. Gross margin stands at a healthy 49.5%, while net margin improved to 12.5%. The latest year shows robust momentum with net income nearly tripling and EBIT more than doubling.
Texas Instruments Incorporated Analysis
Texas Instruments posted revenues fluctuating around $18B-$20B, ending at $17.7B in 2025, reflecting a mild decline over five years. Net income dropped from $7.73B in 2021 to $4.97B in 2025. Despite a strong gross margin of 57%, net margin remains notably higher than AMD’s at 28.3%. However, net margin declined recently, indicating margin pressure despite steady EBIT levels.
Growth Momentum vs. Margin Strength
AMD outpaces TXN in revenue and net income growth, driven by aggressive expansion and improving margins. Conversely, TXN maintains superior margin quality but faces declining profitability and revenue contraction. For investors prioritizing growth and earnings acceleration, AMD’s profile appears more compelling. TXN suits those valuing stable, high-margin cash flow despite slower growth.
Financial Ratios Comparison
These vital ratios act as a diagnostic tool to expose the underlying fiscal health, valuation premiums, and capital efficiency of these companies:
| Ratios | Advanced Micro Devices, Inc. (AMD) | Texas Instruments Incorporated (TXN) |
|---|---|---|
| ROE | 6.88% | 30.73% |
| ROIC | 5.40% | 16.52% |
| P/E | 80.5 | 31.5 |
| P/B | 5.54 | 9.69 |
| Current Ratio | 2.85 | 4.35 |
| Quick Ratio | 2.01 | 2.83 |
| D/E | 0.061 | 0.863 |
| Debt-to-Assets | 5.00% | 40.62% |
| Interest Coverage | 28.2 | 11.1 |
| Asset Turnover | 0.45 | 0.51 |
| Fixed Asset Turnover | 14.98 | 1.44 |
| Payout ratio | 0% | 99.96% |
| Dividend yield | 0% | 3.17% |
| Fiscal Year | 2025 | 2025 |
Efficiency & Valuation Duel: The Vital Signs
Financial ratios serve as a company’s DNA, uncovering hidden risks and revealing operational excellence in a straightforward, quantifiable way.
Advanced Micro Devices, Inc.
AMD shows a modest 6.9% ROE and a 12.5% net margin, signaling controlled profitability but below sector averages. The stock trades at a stretched P/E of 80.5 and a P/B of 5.54, reflecting high investor expectations. AMD reinvests heavily in R&D (23% of revenue), foregoing dividends to fuel growth.
Texas Instruments Incorporated
TXN delivers robust profitability with a 30.7% ROE and a 28.3% net margin, outpacing AMD considerably. Its P/E of 31.5 is expensive but more reasonable relative to earnings quality. TXN balances shareholder returns with a 3.17% dividend yield, supported by solid free cash flow and moderate leverage.
Premium Valuation vs. Operational Safety
AMD’s valuation appears stretched given its low ROE and high P/E, while TXN offers stronger returns but at a still elevated price. TXN strikes a better balance of profitability and shareholder rewards. Growth-oriented investors may prefer AMD’s reinvestment profile; income-focused investors might favor TXN’s dividend stability.
Which one offers the Superior Shareholder Reward?
I observe that AMD pays no dividends, reinvesting aggressively in R&D and growth, sustaining a 0% payout ratio and strong free cash flow (4.1/share in 2025). TXN delivers a 3.17% dividend yield with nearly 100% payout, complemented by buybacks, though free cash flow coverage is less robust (0.36). AMD’s buyback program is less visible but its zero dividend payout enhances reinvestment sustainability. TXN’s high payout and steady dividends suit income investors but risk cash flow strain. For 2026, I favor AMD’s model for total return potential, balancing capital gains and sustainable reinvestment over TXN’s yield-dependent approach.
Comparative Score Analysis: The Strategic Profile
The radar chart reveals the fundamental DNA and trade-offs of Advanced Micro Devices, Inc. and Texas Instruments Incorporated, highlighting their distinct financial strengths and weaknesses:
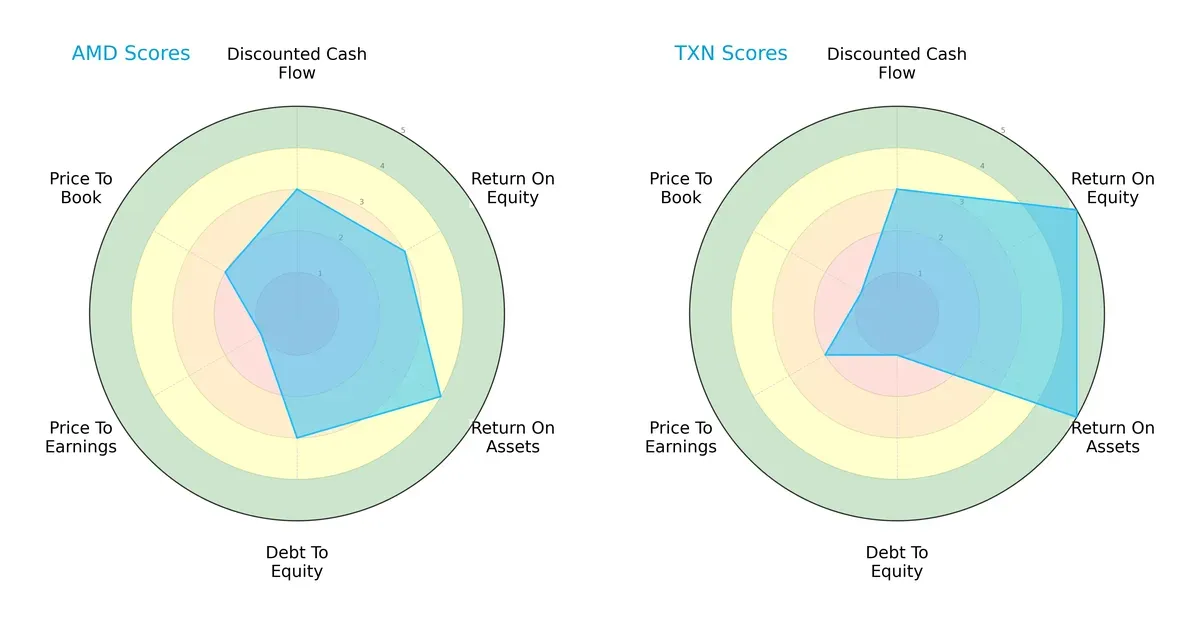
Texas Instruments excels with superior return on equity (5 vs. 3) and return on assets (5 vs. 4), signaling more efficient capital and asset use. However, its debt-to-equity score (1) flags higher leverage risk compared to AMD’s moderate 3. AMD offers a more balanced valuation profile, despite its weaker price-to-earnings (1 vs. 2) and price-to-book scores (2 vs. 1), indicating potential undervaluation risks. Overall, Texas Instruments leverages operational efficiency as its edge, while AMD maintains a steadier risk posture.
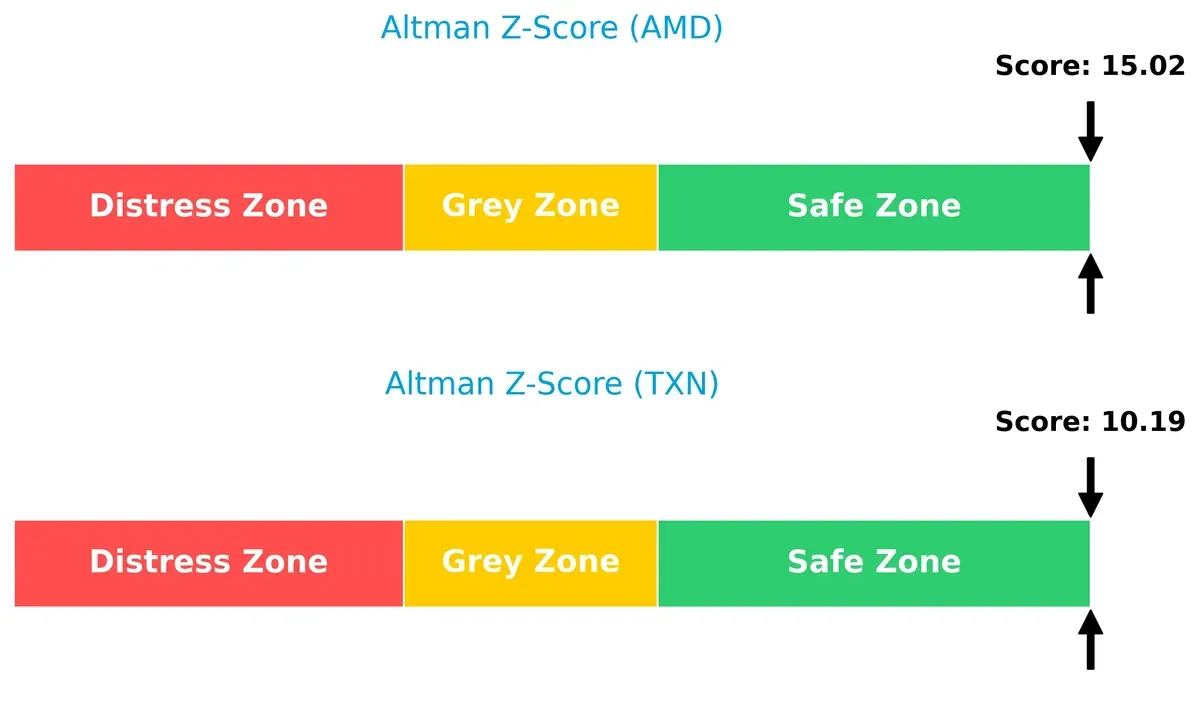
Bankruptcy Risk: Solvency Showdown
The Altman Z-Scores show both firms reside safely above distress thresholds, but AMD’s higher score (15.0 vs. 10.2) implies stronger financial resilience and lower bankruptcy risk in this cycle:
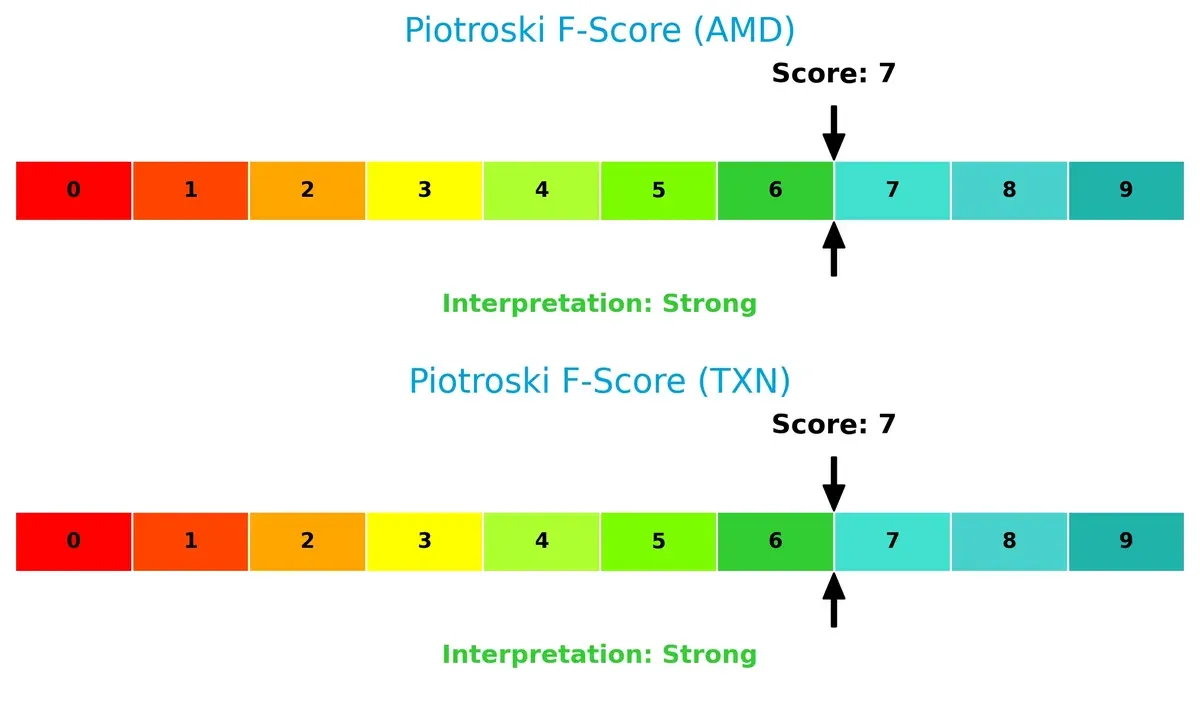
Financial Health: Quality of Operations
Both AMD and Texas Instruments post a Piotroski F-Score of 7, reflecting strong financial health. Neither shows red flags, but this parity suggests similarly robust internal metrics and operational quality:
How are the two companies positioned?
This section dissects AMD and TXN’s operational DNA by comparing their revenue distribution and internal dynamics, including strengths and weaknesses. The goal is to confront their economic moats and identify which business model offers the most resilient competitive advantage today.
Revenue Segmentation: The Strategic Mix
This visual comparison dissects how Advanced Micro Devices, Inc. and Texas Instruments Incorporated diversify their income streams and reveals their primary sector bets:
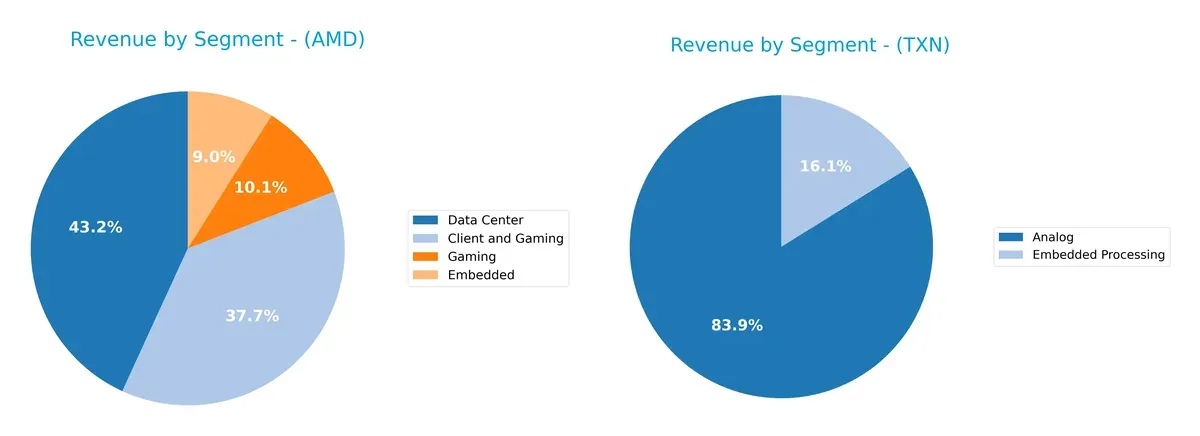
AMD’s revenue pivots around Data Center at $16.6B and Client and Gaming segments totaling $18.5B, showing a moderately diversified mix. Texas Instruments leans heavily on Analog at $14B, with Embedded Processing at $2.7B, reflecting higher concentration risk. AMD’s broader portfolio supports ecosystem lock-in, while Texas Instruments’ dominance in Analog underscores infrastructure strength but exposes it to market cyclicality.
Strengths and Weaknesses Comparison
This table compares the strengths and weaknesses of Advanced Micro Devices, Inc. (AMD) and Texas Instruments Incorporated (TXN):
AMD Strengths
- Diverse revenue from Client, Data Center, Embedded, and Gaming segments
- Favorable net margin of 12.5%
- Strong liquidity with current ratio 2.85 and quick ratio 2.01
- Low debt levels with debt-to-assets at 5%
- Global presence including US, China, Taiwan, Singapore
TXN Strengths
- Higher net margin at 28.3% and ROE 30.7% indicating strong profitability
- Solid ROIC at 16.5% vs WACC neutral at 8.1%
- Favorable quick ratio 2.83 and interest coverage 11.5
- Dividend yield 3.17% supports shareholder returns
- Diverse geographical presence including US, China, EMEA, and Asia
AMD Weaknesses
- ROE 6.9% and ROIC 5.4% below WACC 12.8%, indicating limited capital efficiency
- High P/E 80.5 and P/B 5.5 suggest expensive valuation
- Asset turnover low at 0.45, below industry norms
- No dividend yield
- Moderate market share concentration in specific segments
TXN Weaknesses
- Current ratio high at 4.35, possibly inefficient asset use
- Elevated P/B 9.7 and unfavorable P/E 31.5 valuations
- Debt-to-assets at 40.6% neutral, indicating leverage risk
- Asset turnover and fixed asset turnover neutral, showing average operational efficiency
Both companies show slightly favorable overall financial profiles but differ in capital efficiency and valuation metrics. AMD’s strengths lie in diversification and liquidity, whereas TXN excels in profitability and shareholder returns. Each faces valuation and efficiency challenges that will influence strategic priorities moving forward.
The Moat Duel: Analyzing Competitive Defensibility
A structural moat is the only true shield preserving long-term profits from relentless competitive pressure. Here’s how AMD and Texas Instruments defend their turf:
Advanced Micro Devices, Inc. (AMD): Innovation-Driven Technology Moat
AMD’s primary moat lies in its cutting-edge product development and rapid innovation cycle, driving strong revenue growth and margin expansion. However, its declining ROIC signals weakening capital efficiency, posing risks as competition intensifies in 2026.
Texas Instruments Incorporated (TXN): Operational Excellence and Cost Advantage
Texas Instruments leverages a robust cost advantage through scale and analog specialization, reflected in superior gross and net margins. Despite a declining ROIC trend, TXN continues generating value with steady cash flow and niche market dominance, eyeing growth in industrial and automotive segments.
Innovation vs. Operational Mastery: Who Holds the Moat Edge?
AMD’s innovation moat fuels explosive growth but suffers from deteriorating capital returns. TXN’s cost advantage yields higher profitability and stable value creation despite slower growth. I see TXN’s moat as wider and more durable, better poised to defend market share amid industry headwinds.
Which stock offers better returns?
The past year shows notable price gains for both stocks, with Texas Instruments exhibiting stronger bullish momentum and accelerating performance compared to Advanced Micro Devices.
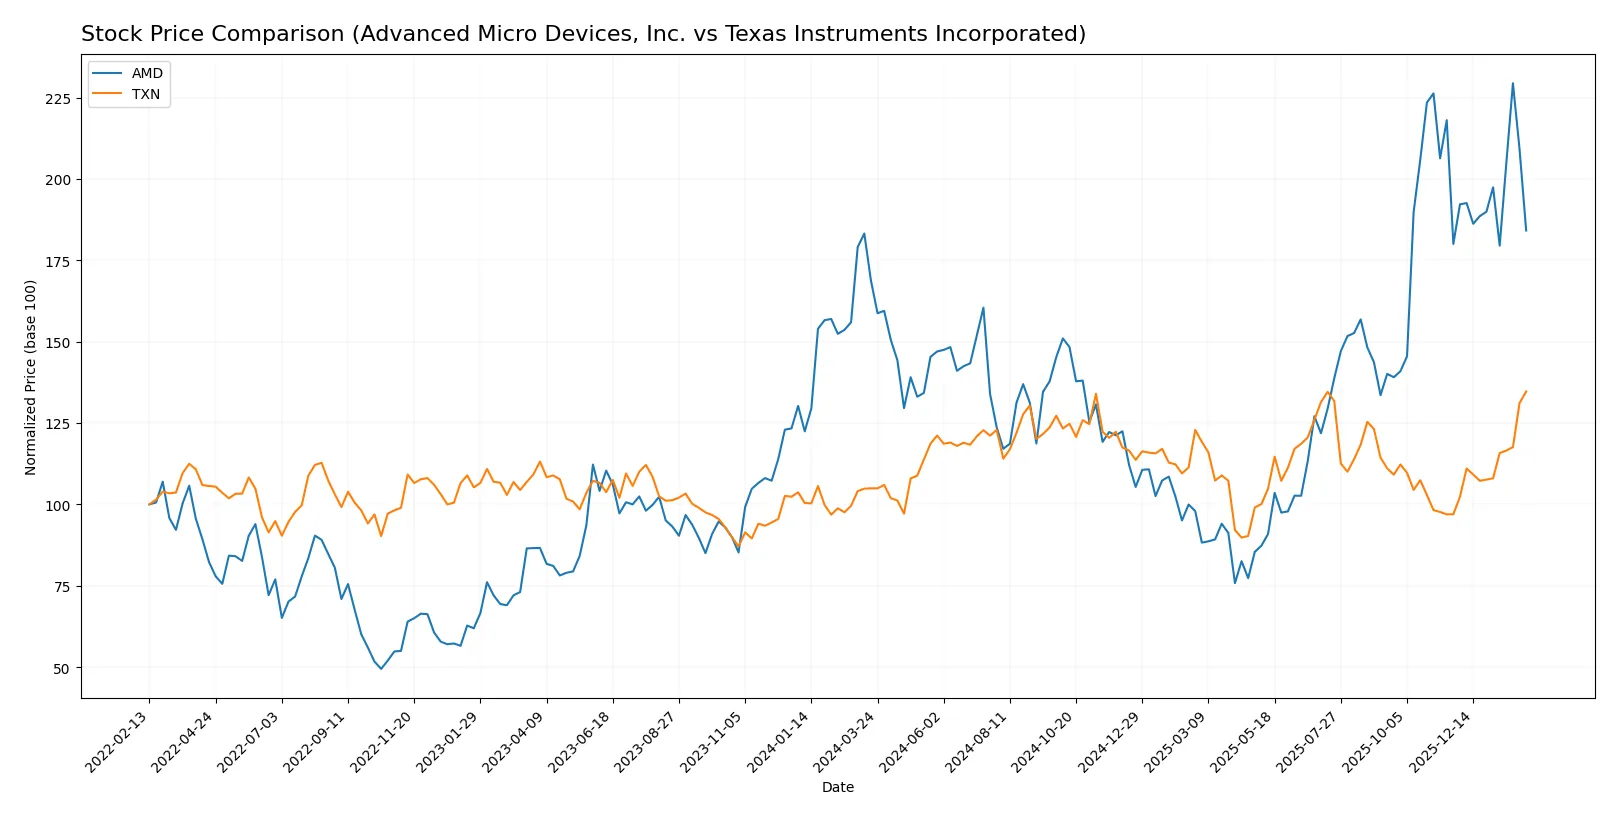
Trend Comparison
Advanced Micro Devices, Inc. stock gained 9.1% over the past year, showing a bullish trend with accelerating momentum and a high volatility level of 41.06%. The price fluctuated between $85.76 and $259.68.
Texas Instruments Incorporated stock rose 28.36% over the same period, also bullish with acceleration. It experienced moderate volatility at 16.2%, with prices ranging from $147.60 to $221.44.
Texas Instruments delivered the highest market performance, outperforming AMD with a stronger price increase and more consistent upward acceleration.
Target Prices
Analysts set a cautiously optimistic consensus on Advanced Micro Devices and Texas Instruments.
| Company | Target Low | Target High | Consensus |
|---|---|---|---|
| Advanced Micro Devices, Inc. | 230 | 380 | 291.2 |
| Texas Instruments Incorporated | 160 | 260 | 204.64 |
The consensus target for AMD at $291.2 suggests roughly 40% upside from the current $208.44 price. Texas Instruments’ target consensus of $204.64 slightly trails its current price of $221.44, indicating a more conservative outlook.

Don’t Let Luck Decide Your Entry Point
Optimize your entry points with our advanced ProRealTime indicators. You’ll get efficient buy signals with precise price targets for maximum performance. Start outperforming now!
How do institutions grade them?
Advanced Micro Devices, Inc. Grades
The following table shows recent grades from leading analysts on AMD:
| Grading Company | Action | New Grade | Date |
|---|---|---|---|
| Wedbush | Maintain | Outperform | 2026-02-04 |
| Benchmark | Maintain | Buy | 2026-02-04 |
| Evercore ISI Group | Maintain | Outperform | 2026-02-04 |
| Rosenblatt | Maintain | Buy | 2026-02-04 |
| Keybanc | Maintain | Overweight | 2026-02-04 |
| Morgan Stanley | Maintain | Equal Weight | 2026-02-04 |
| Wells Fargo | Maintain | Overweight | 2026-01-30 |
| Piper Sandler | Maintain | Overweight | 2026-01-26 |
| UBS | Maintain | Buy | 2026-01-26 |
| Bernstein | Maintain | Market Perform | 2026-01-21 |
Texas Instruments Incorporated Grades
Recent analyst grades for Texas Instruments are summarized below:
| Grading Company | Action | New Grade | Date |
|---|---|---|---|
| Rosenblatt | Maintain | Buy | 2026-02-05 |
| Rosenblatt | Maintain | Buy | 2026-01-28 |
| Goldman Sachs | Maintain | Sell | 2026-01-28 |
| Deutsche Bank | Maintain | Hold | 2026-01-28 |
| Keybanc | Maintain | Overweight | 2026-01-28 |
| Stifel | Maintain | Hold | 2026-01-28 |
| Benchmark | Maintain | Buy | 2026-01-28 |
| Jefferies | Maintain | Hold | 2026-01-28 |
| B of A Securities | Upgrade | Neutral | 2026-01-28 |
| Wells Fargo | Maintain | Equal Weight | 2026-01-28 |
Which company has the best grades?
AMD consistently receives positive grades like Buy and Outperform from multiple reputable firms. Texas Instruments shows a mixed picture, including Buy, Hold, and even Sell ratings. Investors may view AMD as favored by analysts, reflecting stronger confidence and potential momentum.
Risks specific to each company
The following categories identify critical pressure points and systemic threats facing Advanced Micro Devices, Inc. (AMD) and Texas Instruments Incorporated (TXN) in the 2026 market environment:
1. Market & Competition
Advanced Micro Devices, Inc. (AMD)
- Faces intense competition in high-performance CPUs and GPUs from Intel and Nvidia, requiring constant innovation to maintain market share.
Texas Instruments Incorporated (TXN)
- Dominates in analog and embedded processing with steady demand, but competition from smaller specialized chipmakers pressures margins.
2. Capital Structure & Debt
Advanced Micro Devices, Inc. (AMD)
- Maintains a very conservative debt profile with a low debt-to-equity ratio of 0.06, minimizing financial risk.
Texas Instruments Incorporated (TXN)
- Carries significantly higher leverage, with a debt-to-equity ratio around 0.86, increasing vulnerability to interest rate hikes.
3. Stock Volatility
Advanced Micro Devices, Inc. (AMD)
- Exhibits high beta (1.94), indicating greater stock price swings and sensitivity to market cycles.
Texas Instruments Incorporated (TXN)
- Shows a beta near 1.0, reflecting more stable price movements aligned with the broader market.
4. Regulatory & Legal
Advanced Micro Devices, Inc. (AMD)
- Subject to global antitrust scrutiny and export controls, especially given geopolitical tensions involving semiconductor supply chains.
Texas Instruments Incorporated (TXN)
- Faces regulatory risks primarily related to environmental standards and export regulations in industrial markets.
5. Supply Chain & Operations
Advanced Micro Devices, Inc. (AMD)
- Relies heavily on foundry partners like TSMC, exposing it to capacity constraints and geopolitical risks in Asia.
Texas Instruments Incorporated (TXN)
- Operates more vertically integrated supply chains, reducing exposure but facing challenges in raw material cost inflation.
6. ESG & Climate Transition
Advanced Micro Devices, Inc. (AMD)
- Invests in sustainable manufacturing but must accelerate efforts to meet rising ESG standards in tech sector.
Texas Instruments Incorporated (TXN)
- Has a strong ESG track record with aggressive emissions reduction targets, appealing to ESG-focused investors.
7. Geopolitical Exposure
Advanced Micro Devices, Inc. (AMD)
- High exposure to US-China tensions due to manufacturing and sales in key Asian markets.
Texas Instruments Incorporated (TXN)
- Moderate geopolitical risk with diversified customer base but still impacted by trade policies and tariffs.
Which company shows a better risk-adjusted profile?
Texas Instruments’ main risk lies in its elevated leverage, which could strain financial flexibility amid rising rates. AMD’s primary concern is its high market volatility and geopolitical exposure tied to Asian supply chains. Despite AMD’s aggressive market position, TXN’s stable stock behavior and strong ESG stance offer a more balanced risk profile. However, TXN’s debt load remains a red flag. Overall, I see Texas Instruments as having a slightly better risk-adjusted profile due to its robust profitability and safer stock dynamics, though vigilance on its capital structure is essential.
Final Verdict: Which stock to choose?
Advanced Micro Devices, Inc. (AMD) excels as a high-innovation powerhouse, driving rapid revenue and earnings growth through relentless R&D investment. Its key vulnerability lies in returns below cost of capital, signaling caution on value creation. AMD suits aggressive growth portfolios willing to embrace cyclical volatility for potential market disruption.
Texas Instruments Incorporated (TXN) offers a resilient strategic moat with consistent free cash flow and robust return on invested capital well above its cost of capital. Its conservative balance sheet and dividend yield provide a safer harbor compared to AMD. TXN fits well within GARP portfolios prioritizing steady income and capital preservation.
If you prioritize high growth potential and innovation-driven market share gains, AMD is the compelling choice despite profitability headwinds. However, if you seek better stability, proven capital efficiency, and income generation, TXN offers superior financial defensibility and lower risk. Each presents an analytical scenario tailored to differing investor risk appetites.
Disclaimer: Investment carries a risk of loss of initial capital. The past performance is not a reliable indicator of future results. Be sure to understand risks before making an investment decision.
Go Further
I encourage you to read the complete analyses of Advanced Micro Devices, Inc. and Texas Instruments Incorporated to enhance your investment decisions: