Home > Comparison > Technology > AMD vs TER
The strategic rivalry between Advanced Micro Devices, Inc. (AMD) and Teradyne, Inc. shapes the semiconductor industry’s competitive landscape. AMD operates as a high-performance chipmaker focusing on computing and graphics processors. Teradyne specializes in automatic test equipment with diverse segments including industrial automation. This analysis dissects their contrasting growth models to identify which company offers a superior risk-adjusted return, crucial for investors seeking durable exposure in technology portfolios.
Table of contents
Companies Overview
Advanced Micro Devices and Teradyne stand as pivotal players in the global semiconductor landscape.
Advanced Micro Devices, Inc.: Innovator in High-Performance Computing
Advanced Micro Devices commands a leading position in semiconductors, specializing in x86 microprocessors and graphics processing units. Its revenue primarily stems from segments like Computing and Graphics, as well as Enterprise and Embedded solutions. In 2026, AMD’s strategic focus targets expanding its data center and professional GPU offerings, reinforcing its competitive edge in high-performance computing.
Teradyne, Inc.: Specialist in Automated Testing Solutions
Teradyne anchors its business on automatic test equipment for semiconductors, system testing, and industrial automation. Its core revenue arises from testing platforms that serve a broad spectrum of markets, including automotive and wireless devices. In 2026, Teradyne emphasizes enhancing its industrial automation robotics and wireless test technologies, aiming to capture growth in smart manufacturing and IoT device testing.
Strategic Collision: Similarities & Divergences
Both firms thrive in the semiconductor ecosystem but differ sharply: AMD pursues a product-driven innovation model, while Teradyne leans on precision testing and automation services. Their primary battleground lies in supporting semiconductor production cycles, with AMD pushing chip performance and Teradyne ensuring quality and reliability. This contrast defines their distinct investment profiles—AMD as a growth engine in silicon design, Teradyne as a specialized enabler of semiconductor manufacturing.
Income Statement Comparison
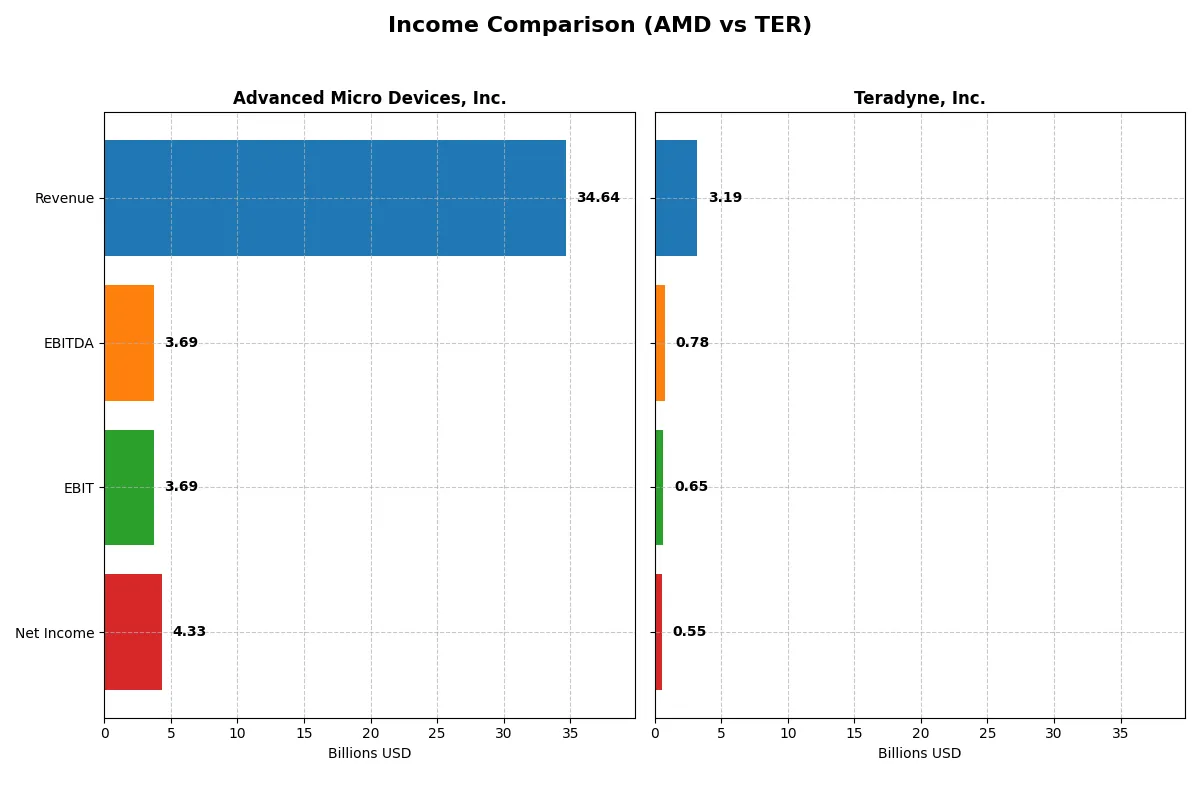
This data dissects the core profitability and scalability of both corporate engines to reveal who dominates the bottom line:
| Metric | Advanced Micro Devices, Inc. (AMD) | Teradyne, Inc. (TER) |
|---|---|---|
| Revenue | 34.6B | 3.19B |
| Cost of Revenue | 17.5B | 1.32B |
| Operating Expenses | 13.5B | 1.17B |
| Gross Profit | 17.2B | 1.87B |
| EBITDA | 3.69B | 780M |
| EBIT | 3.69B | 653M |
| Interest Expense | 131M | 8.02M |
| Net Income | 4.34B | 554M |
| EPS | 2.67 | 3.49 |
| Fiscal Year | 2025 | 2025 |
Income Statement Analysis: The Bottom-Line Duel
This income statement comparison reveals which company operates with superior efficiency and sustainable profitability in a competitive market.
Advanced Micro Devices, Inc. (AMD) Analysis
AMD’s revenue surged from 16.4B in 2021 to 34.6B in 2025, more than doubling over five years. Net income followed a strong upward path, reaching 4.3B in 2025. The company maintains healthy gross margins near 50% and net margins above 12%, reflecting operational leverage and disciplined cost control. In 2025, AMD accelerated EBIT growth by 77.5%, signaling robust momentum.
Teradyne, Inc. (TER) Analysis
Teradyne’s revenue declined modestly over five years, from 3.7B in 2021 to 3.2B in 2025, with a 13% dip overall. Net income dropped 45% to 554M, despite sustaining a solid 58.5% gross margin and a higher net margin of 17.4%. EBIT margin at 20.5% exceeds AMD’s, but recent net margin contraction by 9.7% indicates some margin pressure in 2025.
Growth Dominance vs. Margin Resilience
AMD outpaces Teradyne decisively in revenue and net income growth, showcasing superior scale expansion and margin improvement. Teradyne leads in margin percentages but suffers from declining top-line and bottom-line trends. For investors, AMD’s growth profile with expanding earnings momentum offers a more compelling growth story than Teradyne’s margin resilience amid shrinking sales.
Financial Ratios Comparison
These vital ratios act as a diagnostic tool to expose the underlying fiscal health, valuation premiums, and capital efficiency of the companies compared below:
| Ratios | Advanced Micro Devices, Inc. (AMD) | Teradyne, Inc. (TER) |
|---|---|---|
| ROE | 2.85% (2024) | 19.24% (2024) |
| ROIC | 2.49% (2024) | 17.25% (2024) |
| P/E | 124 (2024) | 37 (2024) |
| P/B | 3.52 (2024) | 7.11 (2024) |
| Current Ratio | 2.62 (2024) | 2.91 (2024) |
| Quick Ratio | 1.83 (2024) | 1.84 (2024) |
| D/E | 3.84% (2024) | 4.77% (2024) |
| Debt-to-Assets | 3.20% (2024) | 3.63% (2024) |
| Interest Coverage | 20.65 (2024) | 166 (2024) |
| Asset Turnover | 0.37 (2024) | 0.76 (2024) |
| Fixed Asset Turnover | 10.63 (2024) | 4.88 (2024) |
| Payout Ratio | 0% (2024) | 14.1% (2024) |
| Dividend Yield | 0% (2024) | 0.38% (2024) |
| Fiscal Year | 2024 | 2024 |
Efficiency & Valuation Duel: The Vital Signs
Financial ratios act as the company’s DNA, uncovering hidden risks and operational strengths that shape investor decisions.
Advanced Micro Devices, Inc.
AMD shows a modest net margin of 12.51% but suffers from zero return on equity and invested capital, signaling weak profitability. Its P/E ratio stands at 80.54, indicating an expensive valuation. AMD returns no dividend, instead reinvesting heavily in R&D, supporting long-term growth over immediate shareholder payouts.
Teradyne, Inc.
Teradyne posts a stronger net margin of 17.37%, yet lacks reported ROE and ROIC data, complicating profitability assessment. With a P/E ratio of 54.64, the stock appears expensive but less stretched than AMD. Teradyne offers a small dividend yield of 0.25%, balancing shareholder returns with growth investment.
Premium Valuation vs. Operational Safety
Both companies trade at premium multiples with unfavorable overall ratio profiles. Teradyne’s higher margin and dividend provide a slightly better risk-reward balance. Investors prioritizing income and margin resilience may lean toward Teradyne, while those favoring aggressive growth might consider AMD’s reinvestment strategy.
Which one offers the Superior Shareholder Reward?
I see that Advanced Micro Devices (AMD) pays no dividends, focusing on reinvesting free cash flow (3.4B in 2025) into growth and innovation. Teradyne (TER) balances a modest dividend yield (~0.25% in 2025) with steady buybacks, maintaining a payout ratio around 14%. TER’s free cash flow stands at 2.9B, enabling sustainable distributions. AMD’s zero payout ratio reflects a high-growth strategy, but its sky-high P/E (~80x) and price-to-free-cash-flow (63x) imply stretched valuation risk. TER’s more conservative valuation (P/E ~55x) and disciplined capital allocation via dividends and buybacks offer a more stable, sustainable shareholder return. In 2026, I favor TER for superior total shareholder reward due to its balanced distribution and value-oriented risk profile.
Comparative Score Analysis: The Strategic Profile
The radar chart reveals the fundamental DNA and trade-offs of Advanced Micro Devices, Inc. and Teradyne, Inc., highlighting their financial strengths and valuation contrasts:
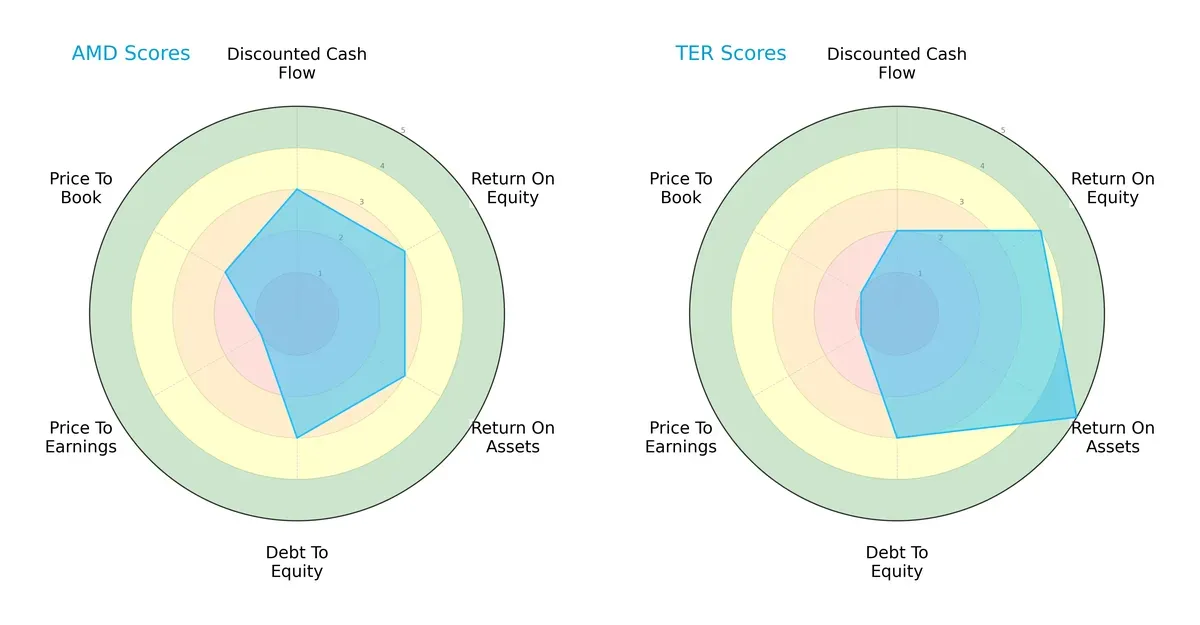
Teradyne excels in asset efficiency and profitability with top-tier ROE (4) and ROA (5) scores, while AMD maintains a balanced profile across DCF, ROE, ROA, and Debt/Equity at moderate levels (3). However, both firms share weaknesses in valuation metrics, with very unfavorable P/E scores (1) and Teradyne also scoring poorly on P/B (1). Teradyne leverages operational efficiency as a competitive edge, whereas AMD offers a steadier, more diversified financial stance.
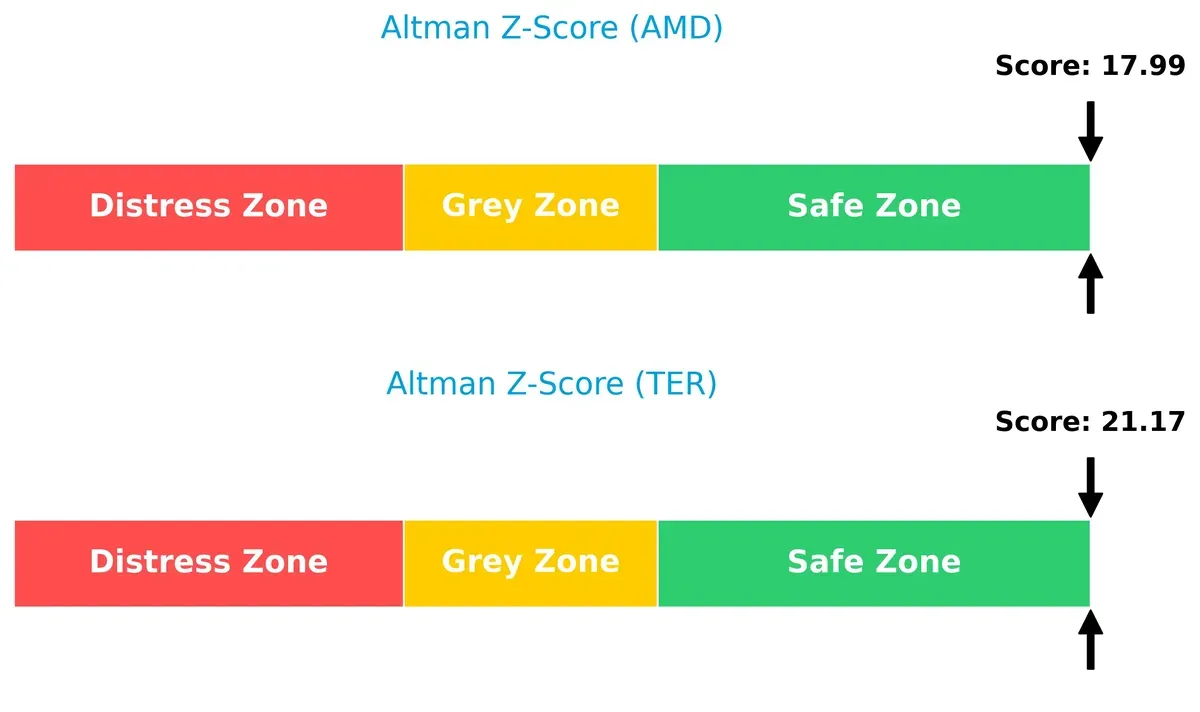
Bankruptcy Risk: Solvency Showdown
The Altman Z-Score gap favors Teradyne slightly, with both companies in the safe zone, underscoring robust solvency for long-term survival in this cycle:
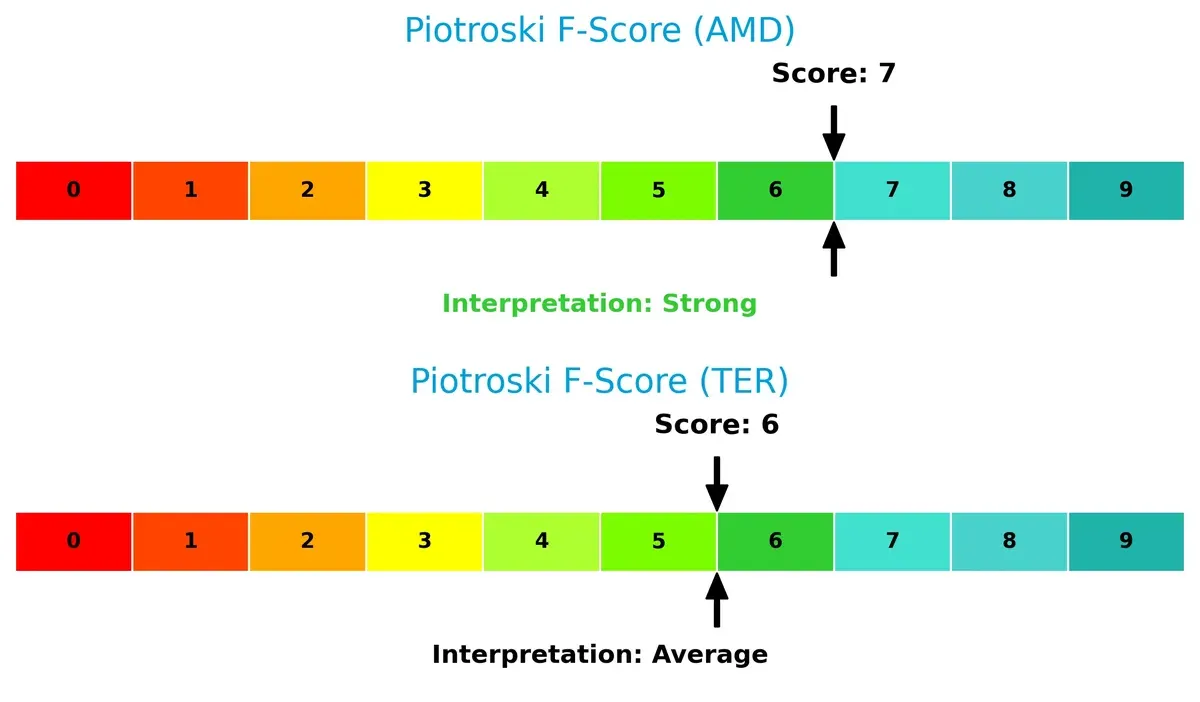
Financial Health: Quality of Operations
Advanced Micro Devices, Inc. demonstrates stronger internal financial health with a Piotroski F-Score of 7, indicating solid fundamentals. Teradyne’s score of 6 suggests average health and potential red flags in some operational metrics:
How are the two companies positioned?
This section dissects the operational DNA of AMD and TER by comparing their revenue distribution and internal strengths and weaknesses. The goal is to confront their economic moats and identify which model offers the most resilient competitive advantage today.
Revenue Segmentation: The Strategic Mix
This visual comparison dissects how Advanced Micro Devices, Inc. and Teradyne, Inc. diversify their income streams and where their primary sector bets lie:
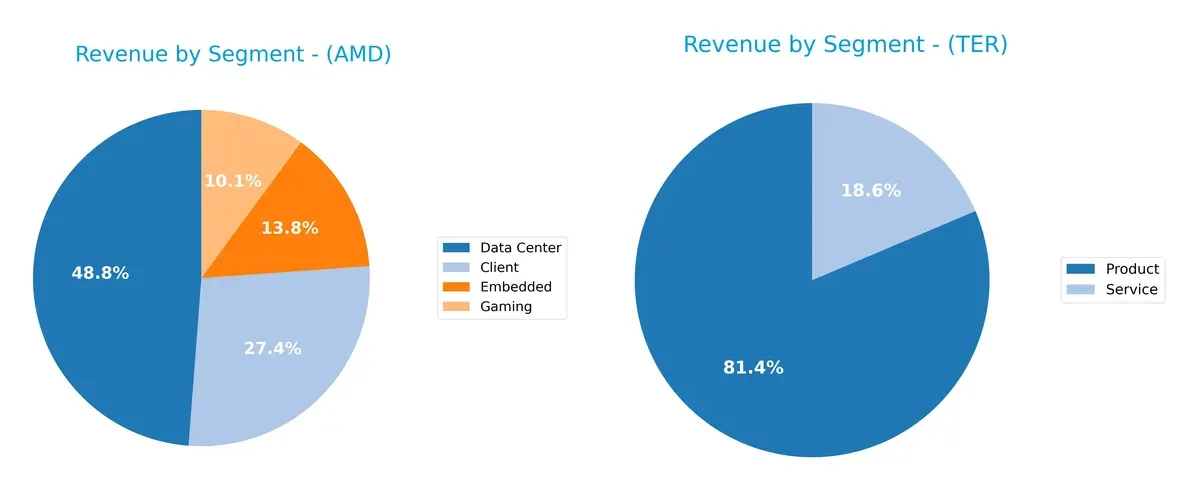
AMD anchors its revenue in Data Center with $12.6B, followed by Client at $7.1B, showing a moderately diversified portfolio. Teradyne relies heavily on Product sales, which dwarfs its Service revenue at $2.3B versus $525M. AMD’s mix reflects a strategic pivot to high-growth data infrastructure, while Teradyne’s concentration in products signals exposure to semiconductor equipment cycles but limited ecosystem lock-in.
Strengths and Weaknesses Comparison
This table compares the Strengths and Weaknesses of AMD and Teradyne based on diversification, profitability, financials, innovation, global reach, and market share:
AMD Strengths
- Diverse product mix with strong data center and client segments
- Significant revenue from multiple global regions including US and China
- Favorable net margin of 12.5%
- Strong interest coverage ratio at 28.2
- Low debt and favorable debt-to-assets ratio
Teradyne Strengths
- Balanced product and service revenue streams
- Favorable net margin of 17.4%
- Very strong interest coverage ratio at 81.4
- Low debt levels with favorable debt-to-assets ratio
- Global footprint including strong presence in Korea and Taiwan
AMD Weaknesses
- Unfavorable ROE and ROIC, below cost of capital
- High PE ratio at 80.5 suggesting overvaluation risk
- Poor liquidity ratios (current and quick ratio at 0)
- Unfavorable asset turnover metrics
- No dividend yield
- Overall unfavorable global ratio opinion
Teradyne Weaknesses
- Unfavorable ROE and ROIC
- PE ratio at 54.6 still high, indicating valuation concerns
- Poor liquidity ratios (current and quick ratio at 0)
- Minimal dividend yield of 0.25%
- WACC data unavailable
- Overall unfavorable global ratio opinion
Both companies demonstrate strengths in profitability and conservative leverage. AMD shows greater product and geographic diversification, supporting resilience across market cycles. Teradyne excels in liquidity coverage and service revenue balance but faces similar valuation and liquidity challenges. These factors shape their strategic priorities amid evolving industry dynamics.
The Moat Duel: Analyzing Competitive Defensibility
A structural moat shields long-term profits from relentless competition and market pressures. Here’s how AMD and Teradyne stack up in 2026:
Advanced Micro Devices, Inc. (AMD): Innovation-Driven Cost Advantage
AMD leverages cutting-edge chip designs and manufacturing partnerships to maintain cost leadership. Its robust gross margin (~50%) reflects operational efficiency. However, declining ROIC signals eroding capital returns, risking future moat strength despite new product launches in data centers and gaming.
Teradyne, Inc. (TER): Precision Test Equipment Specialist
Teradyne’s moat stems from specialized automated test platforms with high switching costs for clients. It sustains higher margins (~59%) and stable profitability, unlike AMD’s volatile returns. Though detailed ROIC data is missing, its entrenched position in semiconductor testing and industrial automation suggests resilience, with growth potential in robotics and 5G device testing.
Innovation Cost Leadership vs. Specialized Testing Expertise
AMD’s broader scale and innovation deliver high revenue growth but faltering capital efficiency narrows its moat. Teradyne’s niche focus secures a deeper, more stable moat through customer lock-in and specialized technology. I see Teradyne better positioned to defend and monetize its market share amid industry complexity.
Which stock offers better returns?
The past year reveals striking price gains for both stocks, with Teradyne showing a notably steeper ascent and accelerating momentum compared to Advanced Micro Devices.
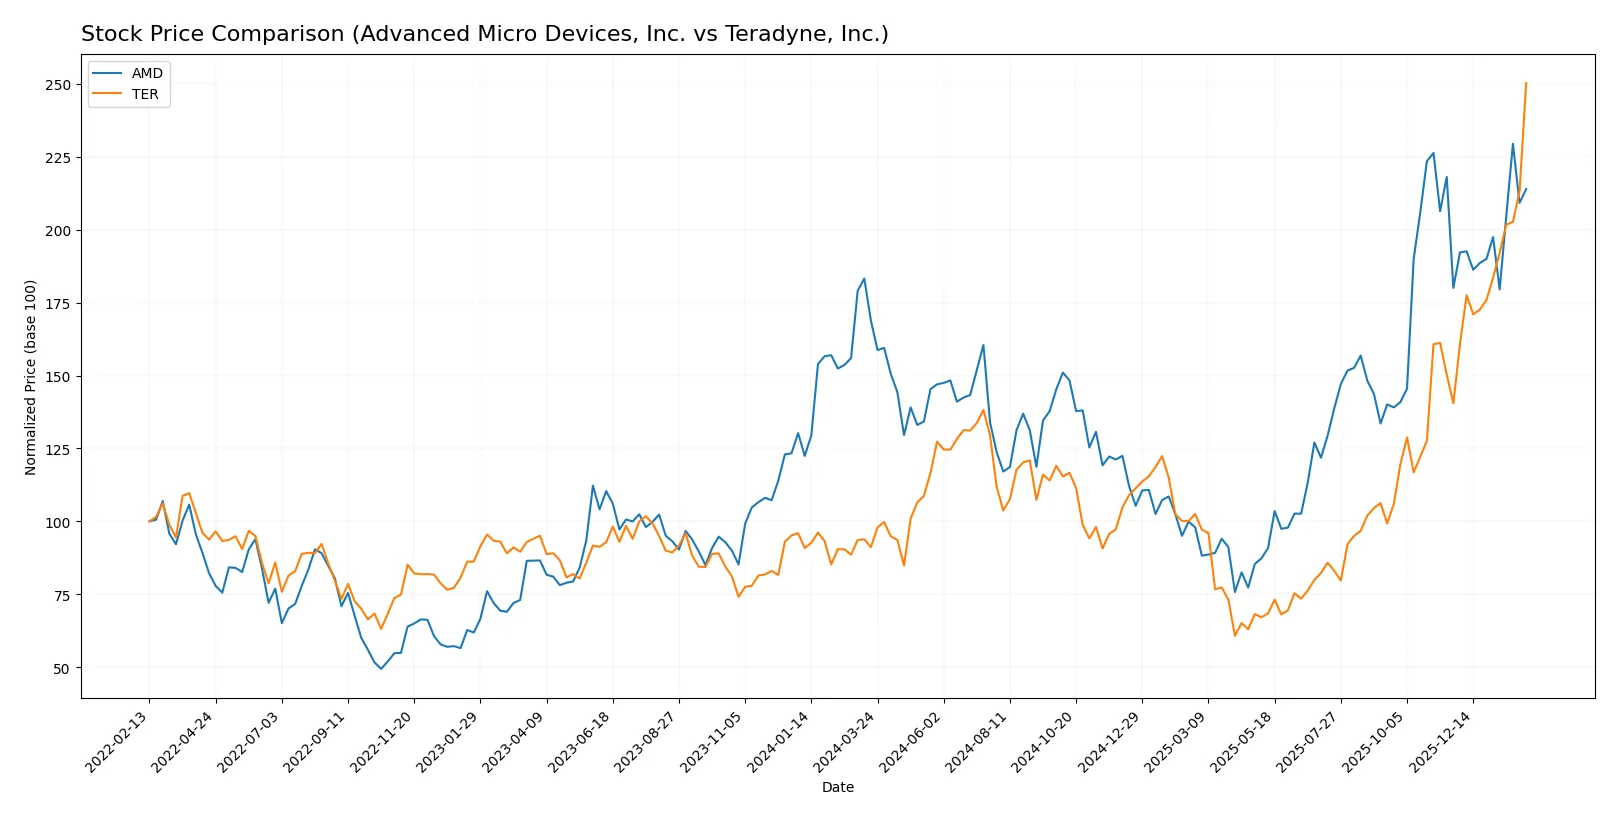
Trend Comparison
Advanced Micro Devices’ stock rose 26.72% over the past year, signaling a bullish trend with accelerating price gains and a peak at 259.68. Volatility remains elevated with a 41.61 standard deviation.
Teradyne’s stock surged 174.58% in the same period, also bullish and accelerating. It reached a high of 282.98, with a slightly lower but still significant 39.72 standard deviation.
Teradyne’s stock delivered substantially higher returns than Advanced Micro Devices, clearly outperforming in market performance over the past year.
Target Prices
Analysts show a positive outlook with solid target price consensus for both AMD and Teradyne.
| Company | Target Low | Target High | Consensus |
|---|---|---|---|
| Advanced Micro Devices, Inc. | 225 | 380 | 291.56 |
| Teradyne, Inc. | 175 | 300 | 251.17 |
The consensus targets exceed current prices for AMD (242) and Teradyne (283), indicating expected upside potential in both stocks.

Don’t Let Luck Decide Your Entry Point
Optimize your entry points with our advanced ProRealTime indicators. You’ll get efficient buy signals with precise price targets for maximum performance. Start outperforming now!
How do institutions grade them?
Here is a comparison of recent institutional grades for Advanced Micro Devices, Inc. and Teradyne, Inc.:
Advanced Micro Devices, Inc. Grades
The following table shows recent grades from recognized grading companies for AMD:
| Grading Company | Action | New Grade | Date |
|---|---|---|---|
| Wells Fargo | Maintain | Overweight | 2026-01-30 |
| Piper Sandler | Maintain | Overweight | 2026-01-26 |
| UBS | Maintain | Buy | 2026-01-26 |
| Bernstein | Maintain | Market Perform | 2026-01-21 |
| Keybanc | Upgrade | Overweight | 2026-01-13 |
| Truist Securities | Maintain | Buy | 2025-12-19 |
| Cantor Fitzgerald | Maintain | Overweight | 2025-12-16 |
| Morgan Stanley | Maintain | Equal Weight | 2025-11-12 |
| Wedbush | Maintain | Outperform | 2025-11-12 |
| Rosenblatt | Maintain | Buy | 2025-11-12 |
Teradyne, Inc. Grades
Recent institutional grades for Teradyne, Inc. are summarized below:
| Grading Company | Action | New Grade | Date |
|---|---|---|---|
| Evercore ISI Group | Maintain | Outperform | 2026-02-03 |
| Cantor Fitzgerald | Maintain | Overweight | 2026-02-02 |
| Stifel | Maintain | Buy | 2026-01-30 |
| UBS | Maintain | Buy | 2026-01-26 |
| B of A Securities | Maintain | Buy | 2026-01-22 |
| Stifel | Maintain | Buy | 2026-01-14 |
| B of A Securities | Maintain | Buy | 2026-01-13 |
| Goldman Sachs | Upgrade | Buy | 2025-12-16 |
| Stifel | Upgrade | Buy | 2025-12-02 |
| Citigroup | Maintain | Buy | 2025-11-12 |
Which company has the best grades?
Teradyne, Inc. consistently receives “Buy” and “Outperform” grades, indicating stronger institutional confidence versus AMD’s mix of “Overweight,” “Buy,” and “Market Perform.” This may influence investor perception toward Teradyne’s growth prospects.
Risks specific to each company
The following categories identify the critical pressure points and systemic threats facing both firms in the 2026 market environment:
1. Market & Competition
Advanced Micro Devices, Inc. (AMD)
- Faces intense rivalry in semiconductors with high innovation demands and pricing pressure.
Teradyne, Inc. (TER)
- Operates in niche semiconductor test equipment, facing competitive pressure but less direct pricing wars.
2. Capital Structure & Debt
Advanced Micro Devices, Inc. (AMD)
- Shows favorable debt-to-equity metrics and strong interest coverage, signaling manageable leverage.
Teradyne, Inc. (TER)
- Also exhibits favorable debt profiles with excellent interest coverage, indicating low financial risk.
3. Stock Volatility
Advanced Micro Devices, Inc. (AMD)
- Higher beta (1.949) indicates greater stock price sensitivity to market swings.
Teradyne, Inc. (TER)
- Slightly lower beta (1.821) suggests marginally less volatile stock behavior.
4. Regulatory & Legal
Advanced Micro Devices, Inc. (AMD)
- Subject to global trade regulations and export controls impacting semiconductor supply chains.
Teradyne, Inc. (TER)
- Faces regulatory scrutiny in defense and industrial automation segments, requiring compliance vigilance.
5. Supply Chain & Operations
Advanced Micro Devices, Inc. (AMD)
- Relies on complex global semiconductor manufacturing networks vulnerable to disruptions.
Teradyne, Inc. (TER)
- Operates manufacturing of test equipment with moderate exposure to supply chain bottlenecks.
6. ESG & Climate Transition
Advanced Micro Devices, Inc. (AMD)
- Increasing pressure to reduce carbon footprint and improve sustainability in semiconductor production.
Teradyne, Inc. (TER)
- Faces ESG demands in automation and wireless test sectors, with opportunities in green tech adoption.
7. Geopolitical Exposure
Advanced Micro Devices, Inc. (AMD)
- Vulnerable to US-China trade tensions affecting semiconductor exports and technology access.
Teradyne, Inc. (TER)
- Exposed to geopolitical risks through defense contracts and international manufacturing dependencies.
Which company shows a better risk-adjusted profile?
Teradyne’s strongest risk is regulatory and geopolitical exposure due to defense and international operations. AMD’s greatest risk lies in market competition and supply chain fragility amid global semiconductor pressures. Teradyne’s lower volatility and superior interest coverage suggest a slightly better risk-adjusted profile. Notably, AMD’s high beta and unfavorable valuation metrics underscore elevated market risk in 2026.
Final Verdict: Which stock to choose?
Advanced Micro Devices, Inc. (AMD) excels as a growth powerhouse fueled by rapid revenue expansion and strong income quality. Its superpower lies in aggressive innovation and market share gains in semiconductor design. However, its declining return on invested capital signals a need for vigilance. AMD suits aggressive growth portfolios willing to embrace volatility.
Teradyne, Inc. (TER) stands out with a strategic moat rooted in its automation and test equipment dominance. It offers more reliable cash flow and operational efficiency, presenting a safer profile than AMD. Teradyne fits well in GARP portfolios seeking stable growth with a margin of safety amid industry cyclicality.
If you prioritize rapid innovation and market disruption, AMD is the compelling choice due to its strong top-line momentum and income quality. However, if you seek better stability and a proven operational moat, Teradyne offers superior defensive qualities and consistent cash flow generation. Both present analytical scenarios fitting distinct investor risk appetites and objectives.
Disclaimer: Investment carries a risk of loss of initial capital. The past performance is not a reliable indicator of future results. Be sure to understand risks before making an investment decision.
Go Further
I encourage you to read the complete analyses of Advanced Micro Devices, Inc. and Teradyne, Inc. to enhance your investment decisions: