Home > Comparison > Technology > TSM vs AMD
The strategic rivalry between Taiwan Semiconductor Manufacturing Company Limited and Advanced Micro Devices, Inc. defines the semiconductor sector’s evolution. TSM operates as a capital-intensive foundry specializing in advanced wafer fabrication, while AMD focuses on high-margin chip design and processor innovation. This head-to-head pits manufacturing scale against architectural agility. This analysis will identify which company’s strategic path offers the superior risk-adjusted return for a diversified investor seeking exposure to technology’s backbone.
Table of contents
Companies Overview
Taiwan Semiconductor Manufacturing Company Limited and Advanced Micro Devices, Inc. dominate critical segments of the semiconductor market.
Taiwan Semiconductor Manufacturing Company Limited: The Foundry Giant
Taiwan Semiconductor Manufacturing Company Limited leads the semiconductor foundry industry, manufacturing and selling integrated circuits globally. Its core revenue stems from wafer fabrication services, offering diverse processes like CMOS logic and RF technologies. In 2026, it strategically focuses on maintaining technological leadership and expanding capacity to meet demand in high-performance computing and automotive sectors.
Advanced Micro Devices, Inc.: The Processor Innovator
Advanced Micro Devices, Inc. excels as a design-driven semiconductor company specializing in x86 processors and GPUs. Its revenue engine relies on sales of CPUs and graphics solutions across computing, graphics, and enterprise segments. The company’s 2026 strategy emphasizes innovation in high-end processors and expansion in data center and gaming markets to capture premium performance customers.
Strategic Collision: Similarities & Divergences
TSMC and AMD share a common ground in semiconductor technology but differ fundamentally: TSMC operates an open foundry model, focusing on manufacturing excellence, while AMD builds proprietary high-performance chips. Their primary battleground is cutting-edge chip technology for computing and graphics applications. These distinctions create unique investment profiles—TSMC as a capital-intensive manufacturing powerhouse and AMD as an innovation-centric design leader.
Income Statement Comparison
The following data dissects the core profitability and scalability of both corporate engines to reveal who dominates the bottom line:
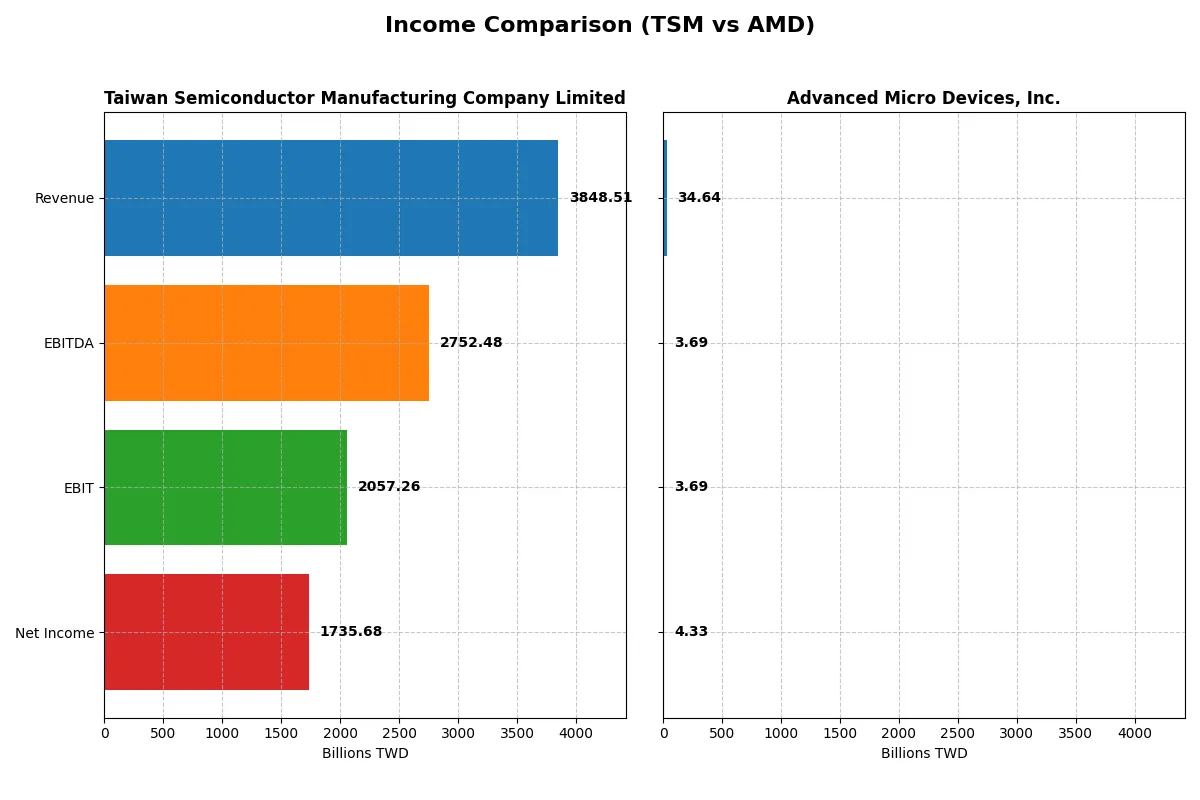
| Metric | Taiwan Semiconductor Manufacturing Company Limited (TSM) | Advanced Micro Devices, Inc. (AMD) |
|---|---|---|
| Revenue | 3.85T TWD | 34.6B USD |
| Cost of Revenue | 1.54T TWD | 17.5B USD |
| Operating Expenses | 349.2B TWD | 13.5B USD |
| Gross Profit | 2.30T TWD | 17.2B USD |
| EBITDA | 2.75T TWD | 3.69B USD |
| EBIT | 2.06T TWD | 3.69B USD |
| Interest Expense | 0 TWD | 131M USD |
| Net Income | 1.74T TWD | 4.34B USD |
| EPS | 334.6 TWD | 2.67 USD |
| Fiscal Year | 2025 | 2025 |
Income Statement Analysis: The Bottom-Line Duel
The income statement comparison unveils which company runs its corporate engine with superior efficiency and sustained momentum.
Taiwan Semiconductor Manufacturing Company Limited Analysis
TSM’s revenue soared from 1.59T TWD in 2021 to 3.85T TWD in 2025, with net income nearly tripling to 1.74T TWD. Its gross margin holds a robust 59.9%, while the net margin impressively stands at 45.1%. In 2025, TSM demonstrates exceptional operational leverage, growing net income by nearly 50% year-over-year, signaling strong momentum and excellent cost control.
Advanced Micro Devices, Inc. Analysis
AMD’s revenue climbed from $16.4B in 2021 to $34.6B in 2025, with net income increasing by 37% overall to $4.3B. The company maintains a solid gross margin of 49.5% but a modest net margin of 12.5%. In 2025, AMD’s net income nearly triples year-over-year, powered by a sharp 165% EPS growth, showcasing rapid earnings acceleration despite lower margin ratios compared to TSM.
Margin Dominance vs. Earnings Momentum
TSM clearly dominates with superior profitability, boasting higher and expanding margins alongside robust revenue growth. AMD impresses with faster earnings momentum and significant EPS growth but operates on thinner margins. For investors, TSM’s profile suggests long-term margin strength, while AMD offers attractive growth potential with more volatility.
Financial Ratios Comparison
These vital ratios act as a diagnostic tool to expose the underlying fiscal health, valuation premiums, and capital efficiency of the companies analyzed:
| Ratios | Taiwan Semiconductor Manufacturing Company Limited (TSM) | Advanced Micro Devices, Inc. (AMD) |
|---|---|---|
| ROE | 32.1% | 0% |
| ROIC | 24.9% | 0% |
| P/E | 28.5 | 80.5 |
| P/B | 9.14 | 0 |
| Current Ratio | 2.62 | 0 |
| Quick Ratio | 2.42 | 0 |
| D/E | 0.18 | 0 |
| Debt-to-Assets | 12.5% | 0 |
| Interest Coverage | 0 | -28.2 |
| Asset Turnover | 0.49 | 0 |
| Fixed Asset Turnover | 1.05 | 0 |
| Payout Ratio | 27.2% | 0% |
| Dividend Yield | 0.95% | 0% |
| Fiscal Year | 2025 | 2025 |
Efficiency & Valuation Duel: The Vital Signs
Ratios act as a company’s DNA, exposing hidden risks and revealing operational excellence with clear financial signals.
Taiwan Semiconductor Manufacturing Company Limited
TSM delivers strong profitability with a 32.12% ROE and a robust 45.1% net margin, signaling operational efficiency. However, the stock trades at an expensive 28.45 P/E and a stretched 9.14 P/B. Shareholders receive modest dividends at 0.95%, while reinvestment emphasizes sustainable growth and innovation.
Advanced Micro Devices, Inc.
AMD posts a modest 12.51% net margin but shows zero ROE and ROIC, indicating profitability challenges. Its valuation is stretched, reflected in an 80.54 P/E ratio. AMD does not pay dividends, instead focusing heavily on R&D at 23.36% of revenue to drive future growth, despite lower financial efficiency.
Valuation Discipline vs. Growth Ambition
TSM offers a better balance of profitability and valuation discipline, supporting stable shareholder returns with a prudent risk profile. AMD’s elevated multiples and weak returns suggest a higher risk, growth-oriented profile. Investors seeking operational safety may prefer TSM, while those chasing growth may lean toward AMD.
Which one offers the Superior Shareholder Reward?
I observe Taiwan Semiconductor Manufacturing Company Limited (TSM) maintains a steady dividend yield near 1%, with a payout ratio around 27%, reflecting disciplined capital return. TSM also executes consistent buybacks, supported by robust free cash flow of 211B TWD per share in 2025. In contrast, Advanced Micro Devices, Inc. (AMD) pays no dividend, reinvesting cash flow aggressively into R&D and growth, shown by a strong free cash flow to operating cash flow ratio near 85%. AMD’s buybacks are less prominent, prioritizing expansion over immediate shareholder returns. Historically, TSM’s balanced approach offers more sustainable, reliable total returns, crucial during semiconductor cycles. I conclude TSM delivers superior shareholder reward in 2026 through disciplined distributions and buybacks, while AMD’s model favors riskier long-term growth.
Comparative Score Analysis: The Strategic Profile
The radar chart reveals the fundamental DNA and trade-offs of Taiwan Semiconductor Manufacturing Company Limited and Advanced Micro Devices, Inc.:
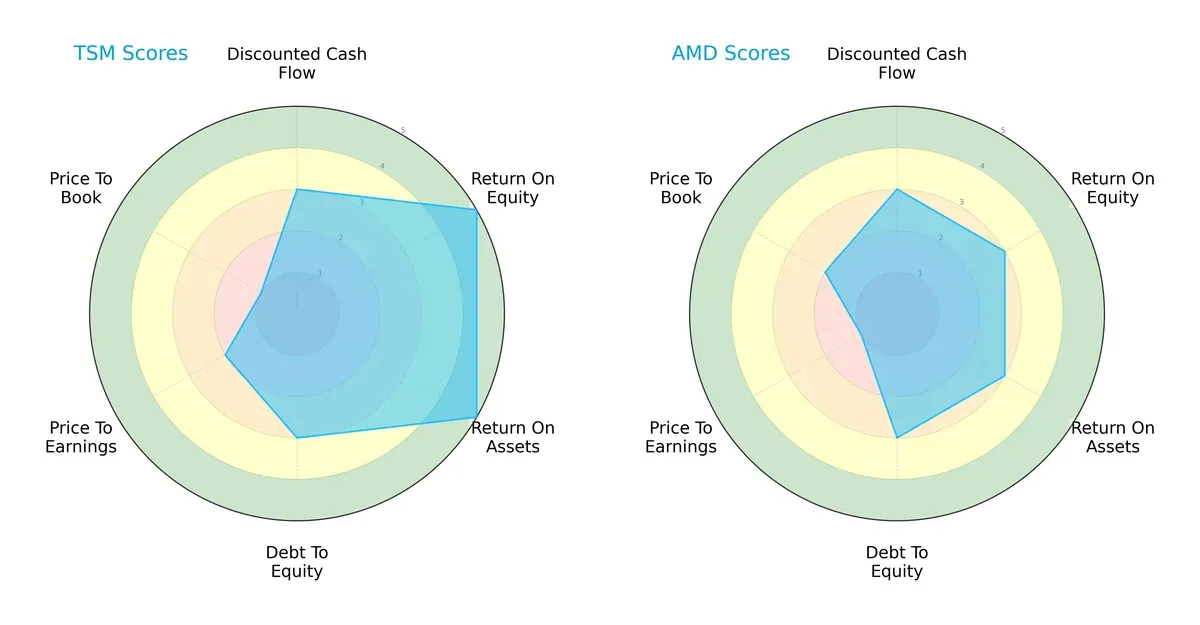
Taiwan Semiconductor Manufacturing Company Limited dominates in profitability metrics with superior ROE and ROA scores of 5 each, signaling efficient capital and asset utilization. Advanced Micro Devices shows a more modest profile, scoring 3 in both metrics, indicating room for operational improvement. Both firms share moderate debt-to-equity (3) and DCF scores (3), suggesting similar risk profiles and valuation expectations. However, Taiwan Semiconductor’s valuation scores lag, with a low price-to-book score of 1, hinting at potential market undervaluation or asset concerns. Overall, Taiwan Semiconductor presents a more balanced strategic profile, leveraging strong operational efficiency, whereas AMD relies on a narrower set of competitive advantages.
—
Bankruptcy Risk: Solvency Showdown
Taiwan Semiconductor Manufacturing Company Limited and Advanced Micro Devices, Inc. both hold Altman Z-Scores well above 3, firmly placing them in the safe zone for long-term solvency in the current cycle:
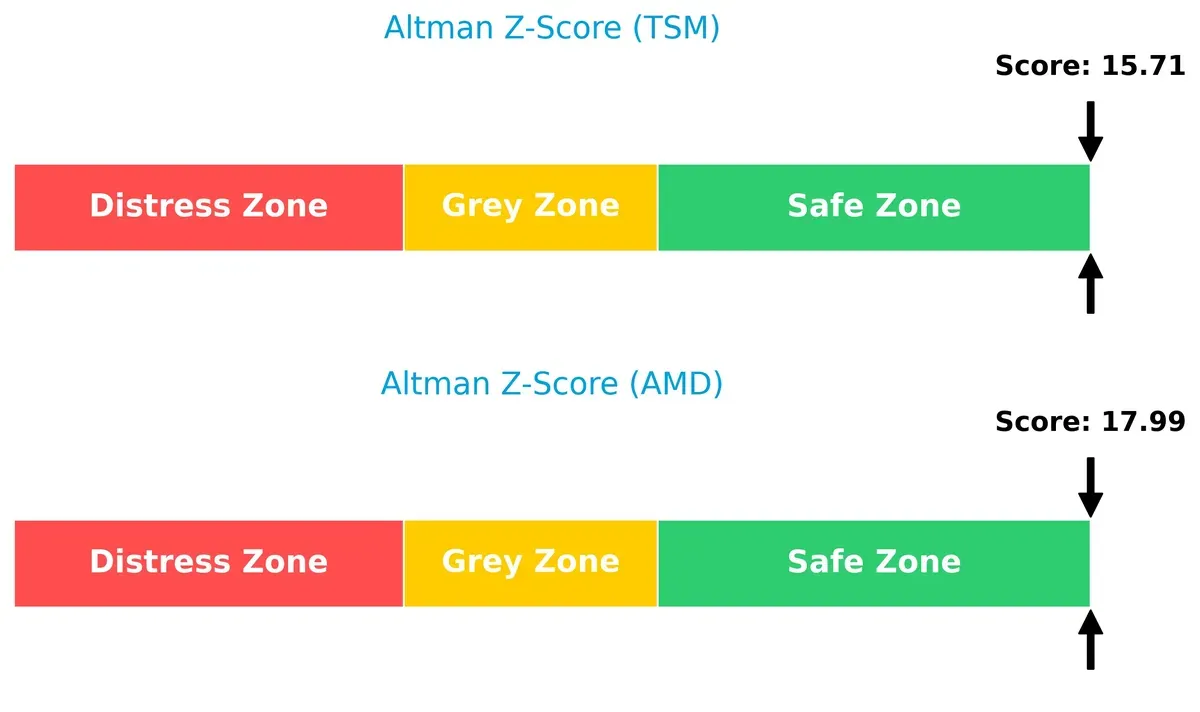
The scores—15.7 for Taiwan Semiconductor and 18.0 for AMD—reflect robust financial health and a low risk of bankruptcy. These elevated levels imply strong profitability, liquidity, and manageable leverage, crucial in semiconductor cyclicality and capital intensity. Investors can confidently view both firms as financially resilient.
—
Financial Health: Quality of Operations
Taiwan Semiconductor scores an impressive 8 on the Piotroski F-Score, indicating very strong internal financial health, while AMD’s 7 signals strong but slightly less robust operations:
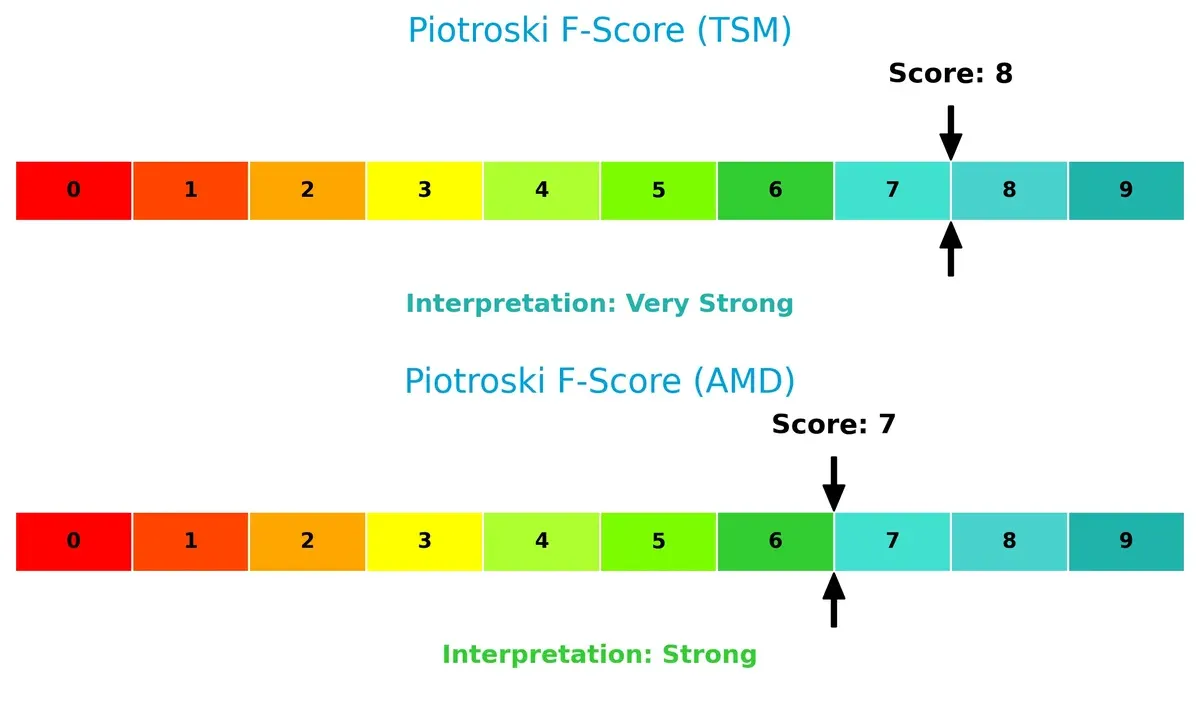
Taiwan Semiconductor’s near-peak score suggests excellent profitability, liquidity, and operational efficiency, with minimal red flags. AMD remains financially sound but may exhibit modest weaknesses relative to Taiwan Semiconductor. This subtle gap highlights Taiwan Semiconductor’s superior internal financial discipline in this competitive sector.
How are the two companies positioned?
This section dissects the operational DNA of TSM and AMD by comparing their revenue distribution and internal dynamics. The goal is to confront their economic moats and identify which model offers the most resilient, sustainable advantage today.
Revenue Segmentation: The Strategic Mix
This visual comparison dissects how Taiwan Semiconductor Manufacturing Company Limited and Advanced Micro Devices, Inc. diversify income streams and where their primary sector bets lie:
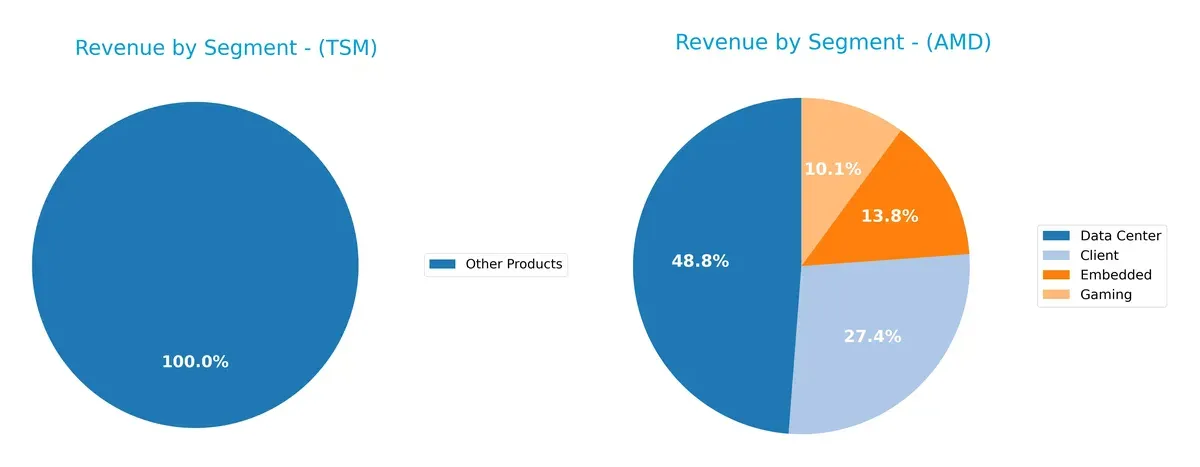
Taiwan Semiconductor Manufacturing Company Limited anchors revenue heavily in wafer sales, with 1.99T TWD in 2022, dwarfing its other products segment at 272B TWD. This concentration highlights TSMC’s dominance in semiconductor manufacturing infrastructure and potential exposure to industry cyclicality. Advanced Micro Devices, Inc. shows a more diversified mix in 2024, with data center (12.58B USD), client (7.05B USD), embedded (3.56B USD), and gaming (2.60B USD) revenues, reducing concentration risk and pivoting on multiple growth avenues.
Strengths and Weaknesses Comparison
This table compares the Strengths and Weaknesses of Taiwan Semiconductor Manufacturing Company Limited (TSM) and Advanced Micro Devices, Inc. (AMD):
TSM Strengths
- High net margin at 45.1%
- Strong ROE at 32.12%
- ROIC well above WACC at 24.92%
- Solid liquidity with current ratio 2.62
- Low debt-to-assets at 12.52%
- Large global presence including US, China, Taiwan
- Significant wafer product revenue diversification
AMD Strengths
- Positive net margin at 12.51%
- Favorable interest coverage at 28.2
- Low debt-to-assets ratio
- Diverse client segments including Data Center and Gaming
- Geographic diversification across US, China, Europe, Japan
- Growth in Data Center and Embedded segments
TSM Weaknesses
- Unfavorable PE ratio at 28.45
- High PB ratio at 9.14
- Low asset turnover at 0.49
- Dividend yield under 1%
- Moderate fixed asset turnover
- Market concentration risks in wafer segment
AMD Weaknesses
- Zero ROE and ROIC indicating weak profitability
- WACC of 12.94% exceeds ROIC
- Unfavorable PE ratio at 80.54
- Zero current and quick ratios signaling liquidity issues
- No dividend yield
- Limited fixed asset turnover and asset turnover
TSM’s financial strength and global scale support a robust market position but face valuation and asset utilization challenges. AMD shows product and geographic diversification but struggles with profitability and liquidity metrics, which may impact its capital allocation and growth strategy.
The Moat Duel: Analyzing Competitive Defensibility
A structural moat is the only reliable shield protecting long-term profits from relentless competitive erosion in dynamic markets:
Taiwan Semiconductor Manufacturing Company Limited (TSM): Scale and Technology Leadership Moat
TSM’s moat stems from its unmatched scale and cutting-edge fabrication technology. Its ROIC outpaces WACC by 15%, signaling strong value creation and margin stability. In 2026, expanding advanced nodes and entering new markets will deepen its moat.
Advanced Micro Devices, Inc. (AMD): Innovation-Driven Product Moat
AMD relies on innovation and product design, contrasting TSM’s scale advantage. Yet, its ROIC trails WACC by nearly 13%, reflecting shrinking profitability. Growth prospects hinge on breakthroughs in CPUs and GPUs to reverse the declining ROIC trend.
Scale Dominance vs. Innovation Agility: The Semiconductor Moat Battle
TSM’s wider, durable moat outperforms AMD’s narrower, innovation-dependent advantage. TSM’s superior capital efficiency equips it better to defend and expand market share amid intensifying competition.
Which stock offers better returns?
Over the past year, both stocks showed strong gains, with Taiwan Semiconductor accelerating sharply and Advanced Micro Devices displaying steady upward momentum.
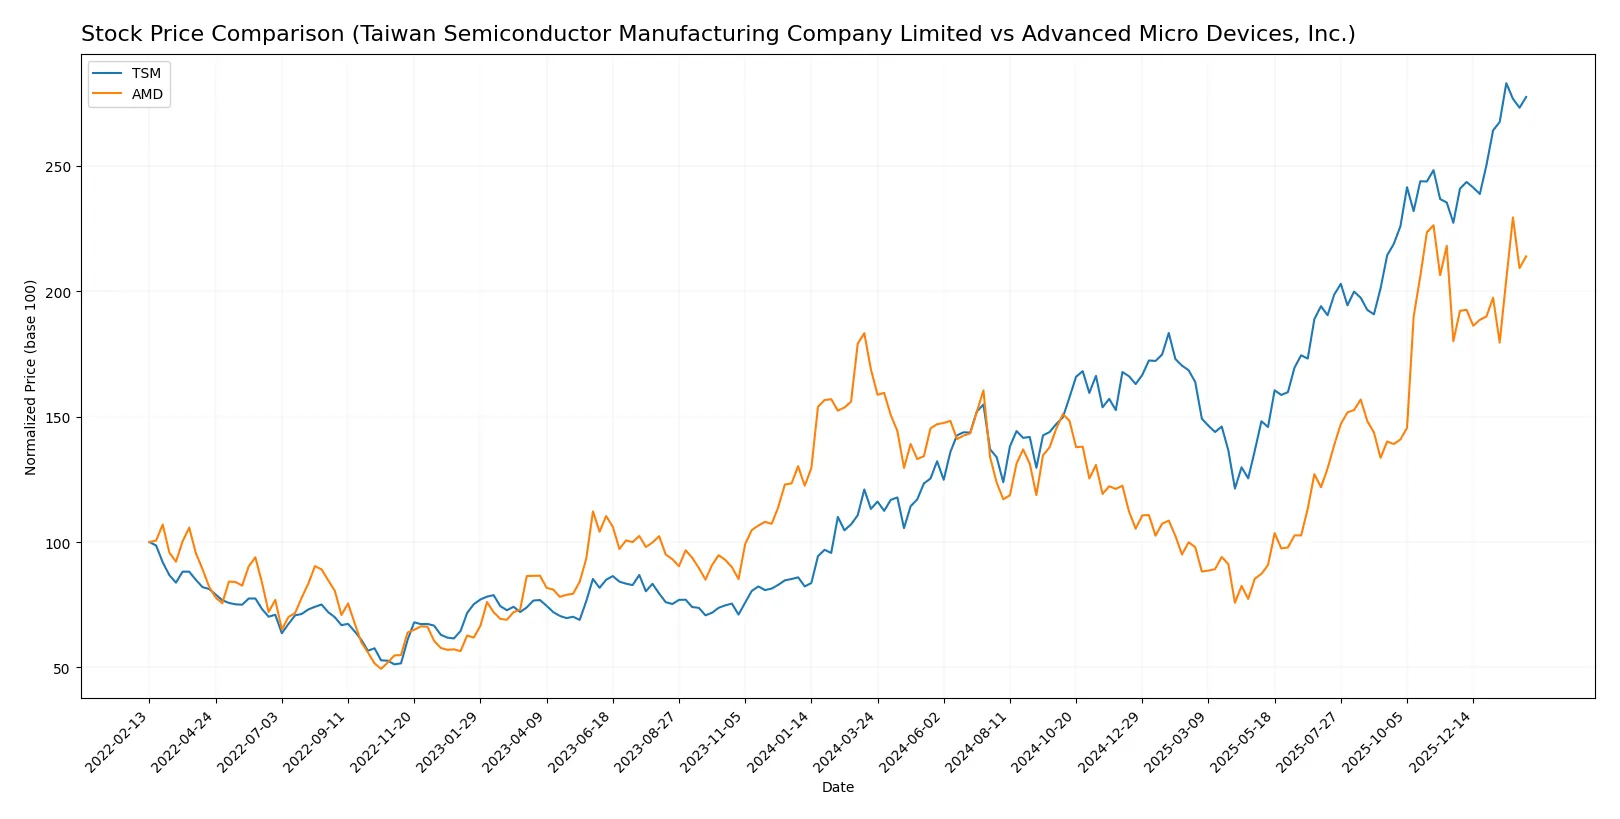
Trend Comparison
Taiwan Semiconductor’s stock surged 145.11% over the past 12 months, showing a bullish trend with accelerating gains and a high volatility of 54.71%. The price hit a peak of 342.4 and a low of 127.7.
Advanced Micro Devices climbed 26.72% over the same period, also bullish with acceleration. Volatility was lower at 41.61%, with the highest price reaching 259.68 and the lowest at 85.76.
Taiwan Semiconductor outperformed Advanced Micro Devices significantly, delivering the highest market return with more pronounced acceleration in price gains.
Target Prices
Analysts present a cautiously optimistic consensus for both Taiwan Semiconductor Manufacturing Company Limited and Advanced Micro Devices, Inc.
| Company | Target Low | Target High | Consensus |
|---|---|---|---|
| Taiwan Semiconductor Manufacturing Company Limited | 330 | 450 | 397.5 |
| Advanced Micro Devices, Inc. | 225 | 380 | 291.56 |
The consensus target price for TSM sits roughly 18% above its current price of 335.75, signaling moderate upside potential. AMD’s consensus target is about 20% above its current price of 242.11, reflecting analyst confidence amid semiconductor sector volatility.

Don’t Let Luck Decide Your Entry Point
Optimize your entry points with our advanced ProRealTime indicators. You’ll get efficient buy signals with precise price targets for maximum performance. Start outperforming now!
How do institutions grade them?
This section compares the latest institutional grades assigned to Taiwan Semiconductor Manufacturing Company Limited and Advanced Micro Devices, Inc.:
Taiwan Semiconductor Manufacturing Company Limited Grades
The table below summarizes recent grades from leading investment firms for TSM:
| Grading Company | Action | New Grade | Date |
|---|---|---|---|
| TD Cowen | Maintain | Hold | 2026-01-16 |
| Barclays | Maintain | Overweight | 2026-01-16 |
| Needham | Maintain | Buy | 2026-01-15 |
| Bernstein | Maintain | Outperform | 2025-12-08 |
| Needham | Maintain | Buy | 2025-10-27 |
| Barclays | Maintain | Overweight | 2025-10-17 |
| Needham | Maintain | Buy | 2025-10-16 |
| Susquehanna | Maintain | Positive | 2025-10-10 |
| Barclays | Maintain | Overweight | 2025-10-09 |
| Barclays | Maintain | Overweight | 2025-09-16 |
Advanced Micro Devices, Inc. Grades
Below is a concise summary of recent institutional grades for AMD:
| Grading Company | Action | New Grade | Date |
|---|---|---|---|
| Wells Fargo | Maintain | Overweight | 2026-01-30 |
| Piper Sandler | Maintain | Overweight | 2026-01-26 |
| UBS | Maintain | Buy | 2026-01-26 |
| Bernstein | Maintain | Market Perform | 2026-01-21 |
| Keybanc | Upgrade | Overweight | 2026-01-13 |
| Truist Securities | Maintain | Buy | 2025-12-19 |
| Cantor Fitzgerald | Maintain | Overweight | 2025-12-16 |
| Morgan Stanley | Maintain | Equal Weight | 2025-11-12 |
| Wedbush | Maintain | Outperform | 2025-11-12 |
| Rosenblatt | Maintain | Buy | 2025-11-12 |
Which company has the best grades?
Both companies enjoy generally positive ratings, but TSM has more consistent buy and overweight ratings from multiple firms. AMD’s ratings show some variety, including market perform and equal weight. Investors may perceive TSM’s steadier bullish outlook as a sign of confidence.
Risks specific to each company
The following categories identify the critical pressure points and systemic threats facing both firms in the 2026 market environment:
1. Market & Competition
Taiwan Semiconductor Manufacturing Company Limited
- Dominates foundry market with strong technology leadership but faces rising competition from new entrants and geopolitical tensions.
Advanced Micro Devices, Inc.
- Competes aggressively in CPUs and GPUs with innovation but struggles with market share volatility and fierce rivalry from larger incumbents.
2. Capital Structure & Debt
Taiwan Semiconductor Manufacturing Company Limited
- Low debt-to-equity ratio (0.18) and strong interest coverage indicate prudent capital structure and financial stability.
Advanced Micro Devices, Inc.
- Virtually no debt, implying low financial risk but potentially limited leverage for growth investments.
3. Stock Volatility
Taiwan Semiconductor Manufacturing Company Limited
- Beta of 1.27 suggests moderate sensitivity to market swings, typical for large-cap semiconductors.
Advanced Micro Devices, Inc.
- High beta of 1.95 signals greater volatility, raising risk for risk-averse investors.
4. Regulatory & Legal
Taiwan Semiconductor Manufacturing Company Limited
- Faces regulatory scrutiny in Taiwan and export restrictions due to geopolitical tensions with China and the U.S.
Advanced Micro Devices, Inc.
- Subject to U.S. tech regulations and international trade tariffs, impacting supply and market access.
5. Supply Chain & Operations
Taiwan Semiconductor Manufacturing Company Limited
- Highly dependent on complex global supply chains, vulnerable to disruptions from geopolitical risks and raw material shortages.
Advanced Micro Devices, Inc.
- Relies on foundry partners like TSMC; supply chain disruptions can delay product launches and affect revenues.
6. ESG & Climate Transition
Taiwan Semiconductor Manufacturing Company Limited
- Invests in energy-efficient production but faces pressure to reduce carbon footprint amid global sustainability mandates.
Advanced Micro Devices, Inc.
- Increasing focus on ESG initiatives but lagging compared to peers on climate impact disclosures and transition plans.
7. Geopolitical Exposure
Taiwan Semiconductor Manufacturing Company Limited
- High exposure to Taiwan-China tensions risks operational continuity and investor confidence.
Advanced Micro Devices, Inc.
- Moderate geopolitical risk primarily from U.S.-China trade relations affecting supply chains and sales.
Which company shows a better risk-adjusted profile?
TSMC’s most impactful risk lies in geopolitical tensions threatening operational stability. AMD faces critical market volatility and weaker financial metrics, challenging its competitive footing. TSMC’s robust balance sheet, strong profitability, and safer stock volatility profile establish a superior risk-adjusted position. Notably, TSMC’s Altman Z-Score and Piotroski Score signal exceptional financial health, while AMD’s weaker ratios and high beta underscore elevated risk.
Final Verdict: Which stock to choose?
Taiwan Semiconductor Manufacturing Company Limited (TSM) excels as a cash-generating powerhouse with a durable economic moat, reflected in its rising ROIC and robust profitability. Its valuation premium and moderate asset turnover require cautious monitoring. TSM suits portfolios seeking steady, long-term growth anchored in industry dominance.
Advanced Micro Devices, Inc. (AMD) leverages a strategic moat built on innovation and rapid revenue growth, particularly in high-margin segments. While it lacks the financial stability of TSM, AMD offers a compelling growth narrative with aggressive R&D investment. It fits well within Growth at a Reasonable Price (GARP) portfolios willing to tolerate higher volatility.
If you prioritize resilient value creation and financial strength, TSM is the compelling choice due to its superior moat durability and cash flow consistency. However, if you seek dynamic growth with exposure to cutting-edge technology, AMD offers better growth potential despite its weaker profitability metrics. Both scenarios carry inherent risks that investors must weigh carefully.
Disclaimer: Investment carries a risk of loss of initial capital. The past performance is not a reliable indicator of future results. Be sure to understand risks before making an investment decision.
Go Further
I encourage you to read the complete analyses of Taiwan Semiconductor Manufacturing Company Limited and Advanced Micro Devices, Inc. to enhance your investment decisions: