Home > Comparison > Technology > AMD vs STM
The strategic rivalry between Advanced Micro Devices, Inc. (AMD) and STMicroelectronics N.V. shapes the semiconductor industry’s evolution. AMD operates as a high-performance computing and graphics innovator, focused on x86 processors and GPUs. In contrast, STMicroelectronics is a diversified semiconductor manufacturer emphasizing automotive, analog, and sensor technologies. This analysis compares their distinct operational models and growth trajectories to identify which offers a superior risk-adjusted return for diversified portfolios in 2026.
Table of contents
Companies Overview
Advanced Micro Devices and STMicroelectronics stand as pivotal players in the global semiconductor market.
Advanced Micro Devices, Inc.: Innovator in High-Performance Computing
Advanced Micro Devices dominates the semiconductor industry with x86 microprocessors and GPUs powering desktops, notebooks, servers, and gaming consoles. Its revenue centers on computing and graphics segments, including AMD Ryzen and EPYC processors. In 2026, AMD focuses strategically on expanding its data center and professional GPU offerings, aiming to strengthen its foothold in high-growth cloud and AI markets.
STMicroelectronics N.V.: Leader in Diversified Semiconductor Solutions
STMicroelectronics specializes in automotive, industrial, and consumer semiconductor products across analog, MEMS, microcontrollers, and digital ICs. Its revenue streams derive from a broad portfolio including sensors, power transistors, and microcontrollers. The company’s 2026 strategy emphasizes innovation in automotive integrated circuits and energy-efficient solutions, targeting growth in electric vehicles and industrial automation sectors.
Strategic Collision: Similarities & Divergences
Both companies excel in semiconductors but diverge sharply in focus: AMD pursues high-performance computing with a processor-centric ecosystem, while STMicroelectronics champions diversified analog and embedded solutions. They compete primarily in automotive and industrial markets, especially as AI and electrification reshape demand. Investors face distinct profiles: AMD delivers cutting-edge CPU/GPU innovation, whereas ST offers stability through broad application exposure and embedded systems expertise.
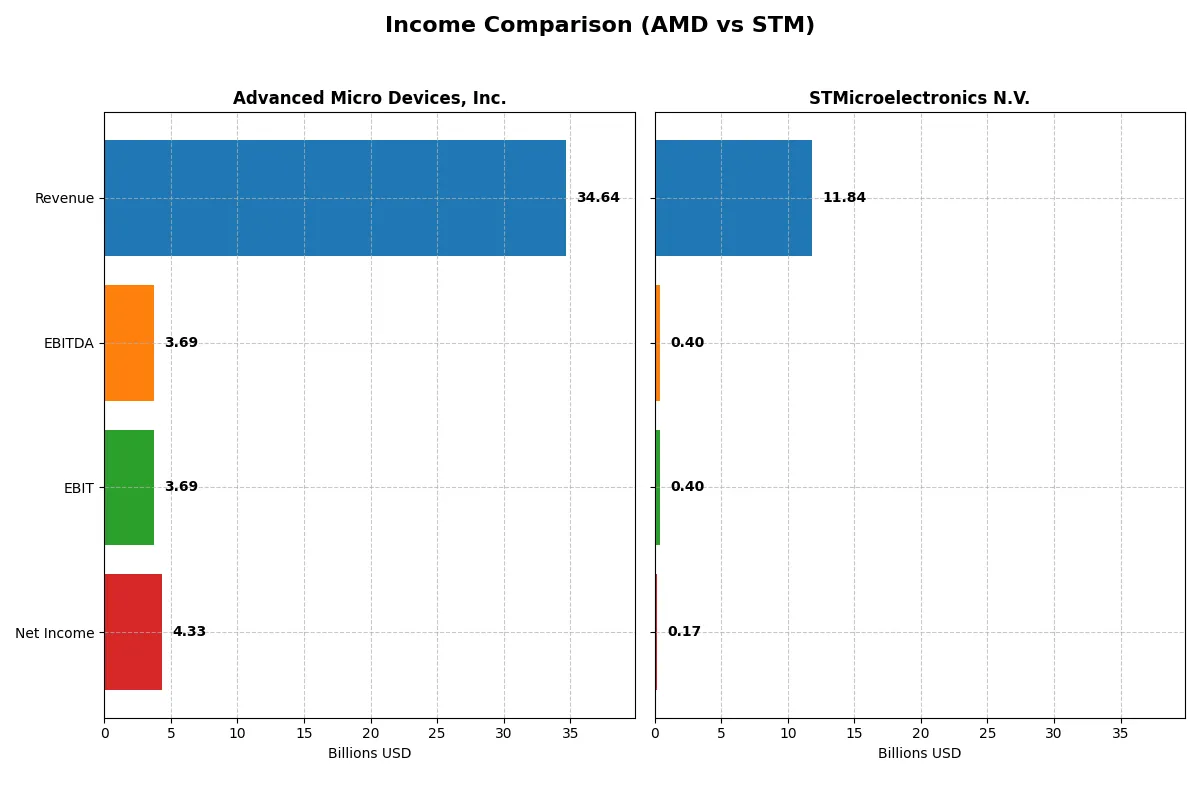
Income Statement Comparison
This data dissects the core profitability and scalability of both corporate engines to reveal who dominates the bottom line:
| Metric | Advanced Micro Devices, Inc. (AMD) | STMicroelectronics N.V. (STM) |
|---|---|---|
| Revenue | 34.6B | 11.8B |
| Cost of Revenue | 17.5B | 7.8B |
| Operating Expenses | 13.5B | 3.7B |
| Gross Profit | 17.2B | 4.0B |
| EBITDA | 3.7B | 401M |
| EBIT | 3.7B | 401M |
| Interest Expense | 131M | 0 |
| Net Income | 4.3B | 0 |
| EPS | 2.67 | 0.19 |
| Fiscal Year | 2025 | 2025 |
Income Statement Analysis: The Bottom-Line Duel
This income statement comparison uncovers which company drives stronger financial efficiency and bottom-line performance.
Advanced Micro Devices, Inc. Analysis
AMD’s revenue surged from $16.4B in 2021 to $34.6B in 2025, doubling over five years. Net income rose robustly to $4.3B in 2025, reflecting expanding profitability. Its gross margin remains strong near 49.5%, while net margin improved to 12.5%, signaling efficient cost control and healthy operational leverage in the latest fiscal year.
STMicroelectronics N.V. Analysis
STM’s revenue peaked at $17.3B in 2023 but declined to $11.8B by 2025, losing scale. Net income dropped sharply to just $167M in 2025 from $4.2B in 2023. Its gross margin contracted to 33.9%, and net margin shrank to 1.4%, indicating margin pressure and deteriorating profitability. The latest year showed significant efficiency challenges and negative momentum.
Margin Strength vs. Revenue Decline
AMD clearly outperforms STM in revenue growth, margin expansion, and net income gains. AMD’s superior gross and net margins demonstrate robust operational efficiency. STM’s shrinking revenue and collapsing profits expose fundamental weaknesses. For investors, AMD’s profile offers a more attractive combination of growth and profitability resilience.
Financial Ratios Comparison
These vital ratios act as a diagnostic tool to expose the underlying fiscal health, valuation premiums, and capital efficiency of the companies compared here:
| Ratios | Advanced Micro Devices, Inc. (AMD) | STMicroelectronics N.V. (STM) |
|---|---|---|
| ROE | — | 0.0093 |
| ROIC | — | 0.0067 |
| P/E | 80.5 | — |
| P/B | 3.52 | — |
| Current Ratio | 2.62 | 3.36 |
| Quick Ratio | 1.83 | 2.43 |
| D/E (Debt to Equity) | 0.038 | 0.120 |
| Debt-to-Assets | 0.032 | 0.086 |
| Interest Coverage | 20.7 | 0 |
| Asset Turnover | 0.37 | 0.48 |
| Fixed Asset Turnover | 10.63 | 1.07 |
| Payout ratio | 0 | 0 |
| Dividend yield | 0% | 0% |
| Fiscal Year | 2025 | 2025 |
Efficiency & Valuation Duel: The Vital Signs
Ratios act as a company’s DNA, revealing hidden risks and operational excellence that shape its market valuation and shareholder returns.
Advanced Micro Devices, Inc.
AMD’s net margin of 12.51% signals solid profitability, but a zero ROE and ROIC reflect operational challenges. Its high P/E of 80.54 marks the stock as expensive and stretched. AMD pays no dividends, instead reinvesting heavily in R&D (23.4% of revenue) to fuel growth, reflecting a long-term innovation strategy.
STMicroelectronics N.V.
STM posts a low net margin of 1.41% and modest ROE at 0.93%, indicating limited profitability. The absence of a P/E ratio suggests valuation uncertainty, but its strong current ratio (3.36) and low debt levels improve balance sheet safety. STM also foregoes dividends, focusing on moderate R&D investment (15.7% of revenue) to support operational efficiency.
Premium Valuation vs. Operational Safety
AMD commands a premium valuation with better margins but weak returns on equity and capital, implying risk in sustaining profitability. STM offers a more balanced risk profile with conservative debt and liquidity, though profitability remains limited. Investors seeking growth may prefer AMD’s innovation focus; risk-averse profiles might lean toward STM’s financial stability.
Which one offers the Superior Shareholder Reward?
I see AMD and STMicroelectronics both avoid dividends, focusing on reinvestment and buybacks. AMD posts no dividend but generates robust FCF of $3.4B per share, fueling aggressive buybacks. STM pays a modest 1.3% yield, with a 18% payout ratio, but suffers negative FCF recently, limiting buyback scope. AMD’s capital allocation prioritizes sustainable buybacks, supporting long-term shareholder value. STM’s split between dividends and weak FCF raises sustainability concerns. For 2026, AMD offers a superior total shareholder reward, balancing reinvestment and buybacks with stronger free cash flow.
Comparative Score Analysis: The Strategic Profile
The radar chart reveals the fundamental DNA and trade-offs of Advanced Micro Devices, Inc. and STMicroelectronics N.V., highlighting their distinct financial strengths and weaknesses:
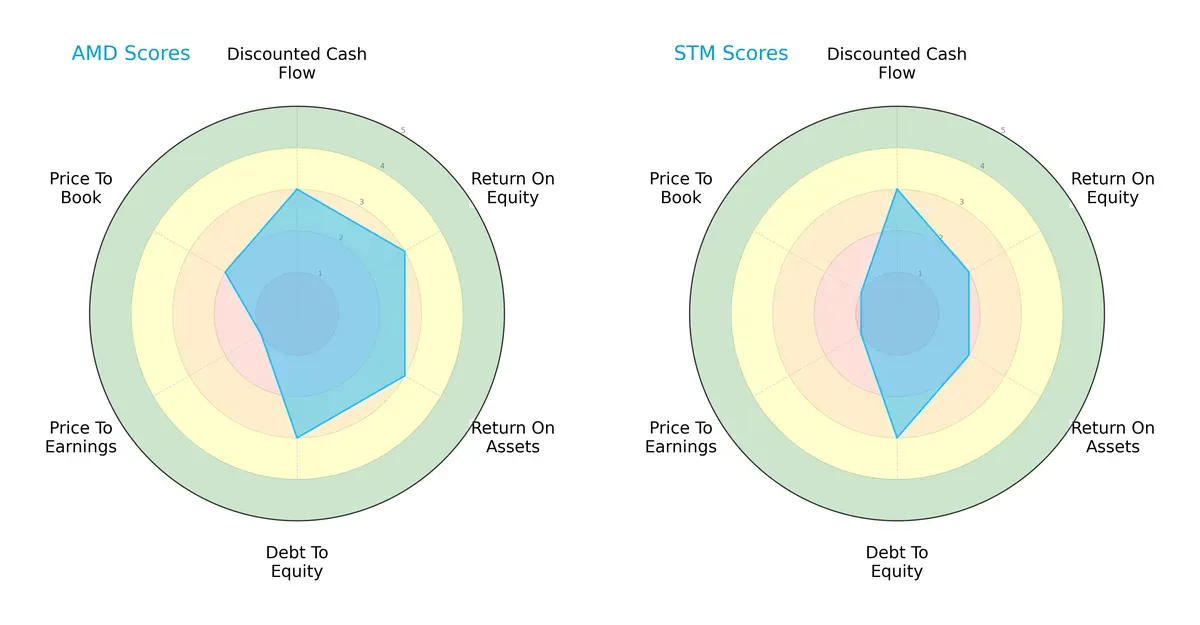
Advanced Micro Devices shows a balanced profile with moderate scores in DCF, ROE, ROA, and Debt/Equity, but struggles with valuation metrics, especially P/E. STMicroelectronics has similar strengths in cash flow and leverage but scores lower in profitability and valuation, relying more on financial stability than growth efficiency.
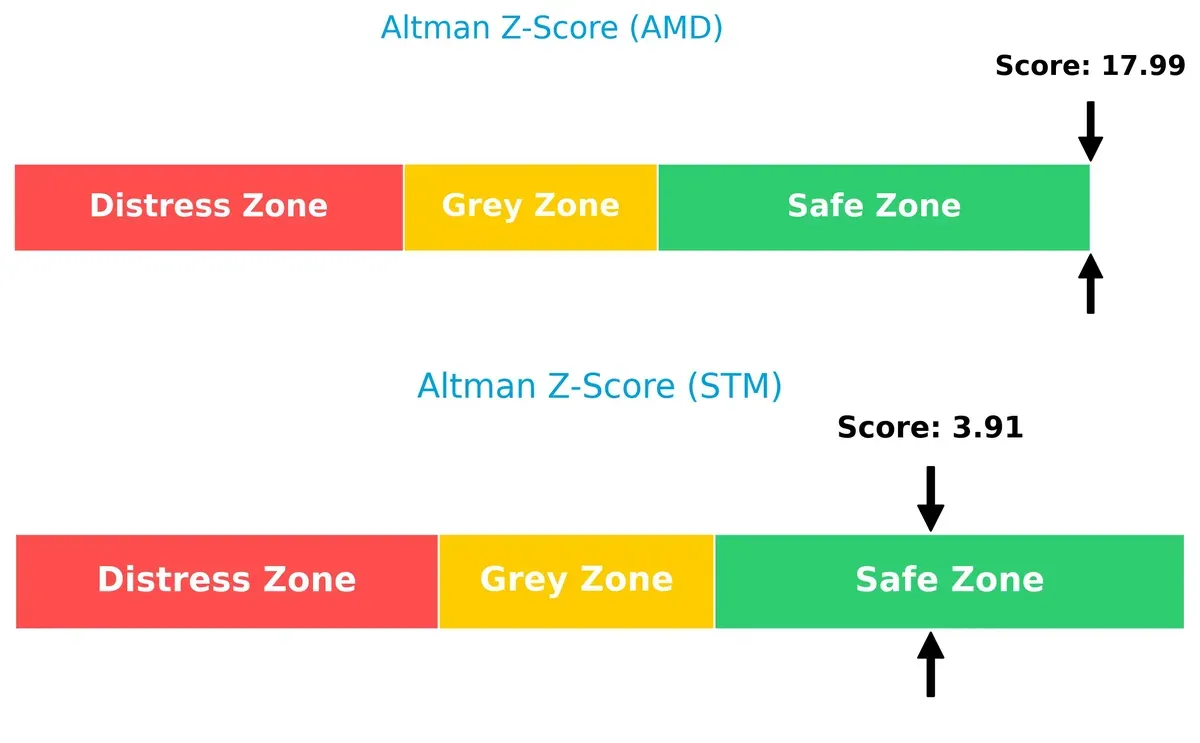
Bankruptcy Risk: Solvency Showdown
The Altman Z-Score gap signals both firms are in the safe zone, but AMD’s exceptionally high score suggests a much safer long-term survival profile than STMicroelectronics:
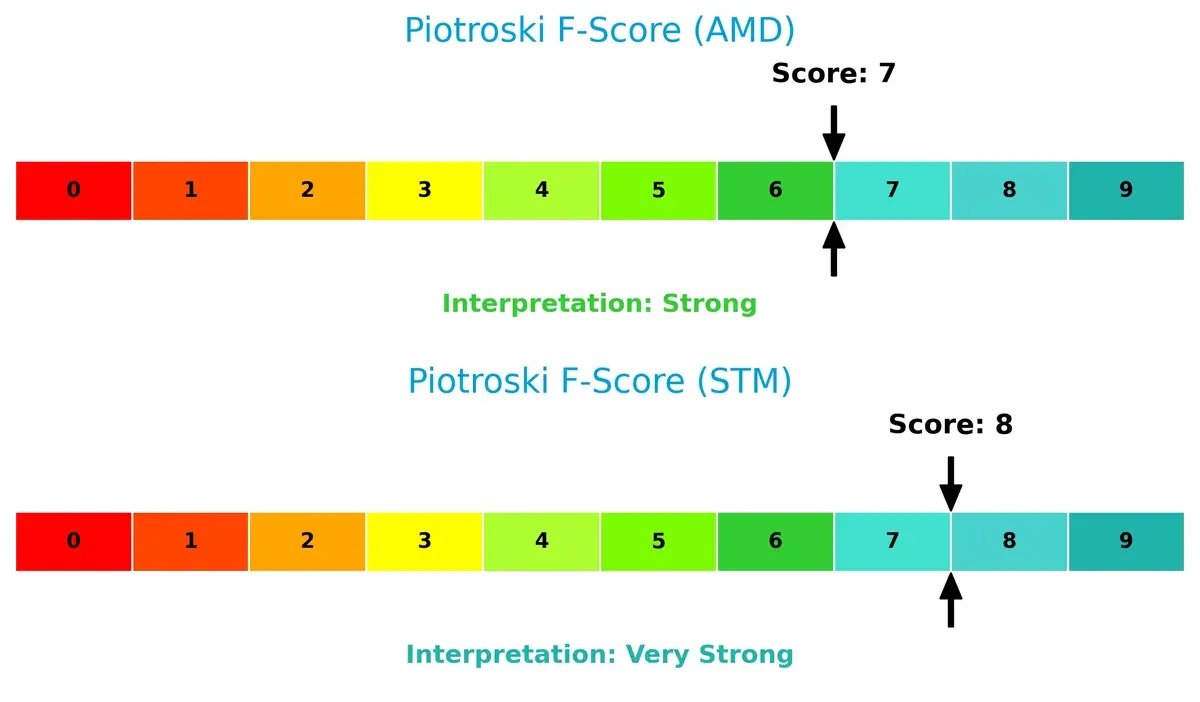
Financial Health: Quality of Operations
STMicroelectronics leads with a very strong Piotroski F-Score of 8, indicating excellent financial health, while AMD’s score of 7 shows strong but slightly less robust operational quality:
How are the two companies positioned?
This section dissects the operational DNA of AMD and STM by comparing their revenue distribution and internal dynamics, including strengths and weaknesses. The final objective is to confront their economic moats to identify which business model offers the most resilient and sustainable competitive advantage in today’s semiconductor market.
Revenue Segmentation: The Strategic Mix
This visual comparison dissects how Advanced Micro Devices, Inc. and STMicroelectronics N.V. diversify their income streams and reveals their primary sector bets:
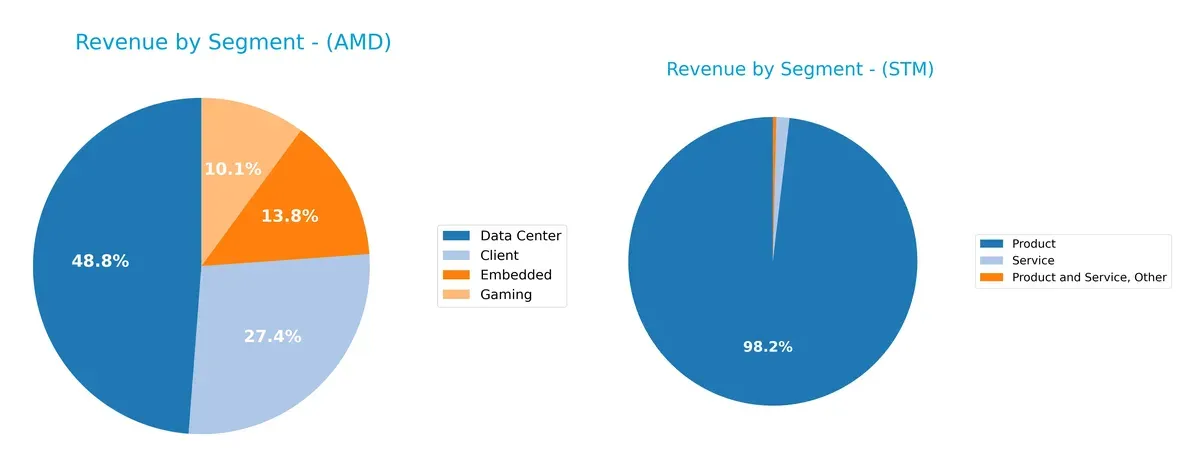
Advanced Micro Devices, Inc. anchors revenue heavily in Data Center ($12.6B) and Client segments ($7.1B), showcasing a focused but balanced tech portfolio. STMicroelectronics N.V. dwarfs with a dominant Product segment ($13.2B), while Services and other revenues remain marginal. AMD’s diversified mix reduces concentration risk, supporting ecosystem lock-in. STM’s reliance on Product revenue signals infrastructure dominance but exposes it to product cycle volatility and market shifts.
Strengths and Weaknesses Comparison
This table compares the Strengths and Weaknesses of AMD and STM based on diversification, profitability, financials, innovation, global presence, and market share:
AMD Strengths
- Diverse revenue streams: Client, Data Center, Embedded, Gaming segments
- Strong net margin at 12.51%
- Favorable debt-to-equity and debt-to-assets ratios
- High interest coverage ratio at 28.2
- Significant revenue from United States and China markets
STM Strengths
- Solid diversification in product and service offerings
- Favorable price-to-earnings and price-to-book ratios
- Strong quick ratio at 2.43 and low debt-to-equity at 0.12
- Infinite interest coverage indicating low financial risk
- Broad global presence with significant revenue from Singapore and Switzerland
AMD Weaknesses
- Unfavorable ROE and ROIC at 0%, below WACC of 12.94%
- High PE ratio at 80.54 signals valuation risk
- Poor liquidity with zero current and quick ratios
- Unfavorable asset and fixed asset turnovers
- No dividend yield reported
STM Weaknesses
- Low net margin at 1.41% and weak ROE at 0.93%
- ROIC of 0.67% below WACC of 9.53%
- Unfavorable current ratio at 3.36 despite good quick ratio
- Moderate asset turnover of 0.48 and neutral fixed asset turnover
- No dividend yield reported
Both companies show strengths in diversification and debt management, but AMD’s profitability metrics and liquidity raise concerns. STM exhibits more balanced financial health but faces pressure from low profitability ratios. These factors are crucial for strategic positioning in competitive semiconductor markets.
The Moat Duel: Analyzing Competitive Defensibility
A true structural moat shields long-term profits from relentless competitive pressure. Without it, market share and margins erode rapidly:
Advanced Micro Devices, Inc. (AMD): Innovation-Driven Performance Moat
AMD’s competitive edge stems from innovation and brand momentum in high-performance CPUs and GPUs. Strong revenue growth and margin stability reflect this moat. New data center and gaming products in 2026 could deepen AMD’s market entrenchment.
STMicroelectronics N.V. (STM): Diversified Industrial Solutions Moat
STM relies on broad product diversification across automotive and industrial semiconductors, contrasting AMD’s focused innovation. Despite diversification, STM’s declining margins and shrinking profits highlight weakening competitive leverage. Expansion into emerging sensor markets could offer partial recovery.
Innovation Leadership vs. Diversification Resilience
Both firms face deteriorating ROIC trends, signaling value destruction over 2021-2025. However, AMD’s sharper growth and product-focused moat appear wider and more sustainable. I believe AMD is better positioned to defend and expand its market share amid intensifying competition.
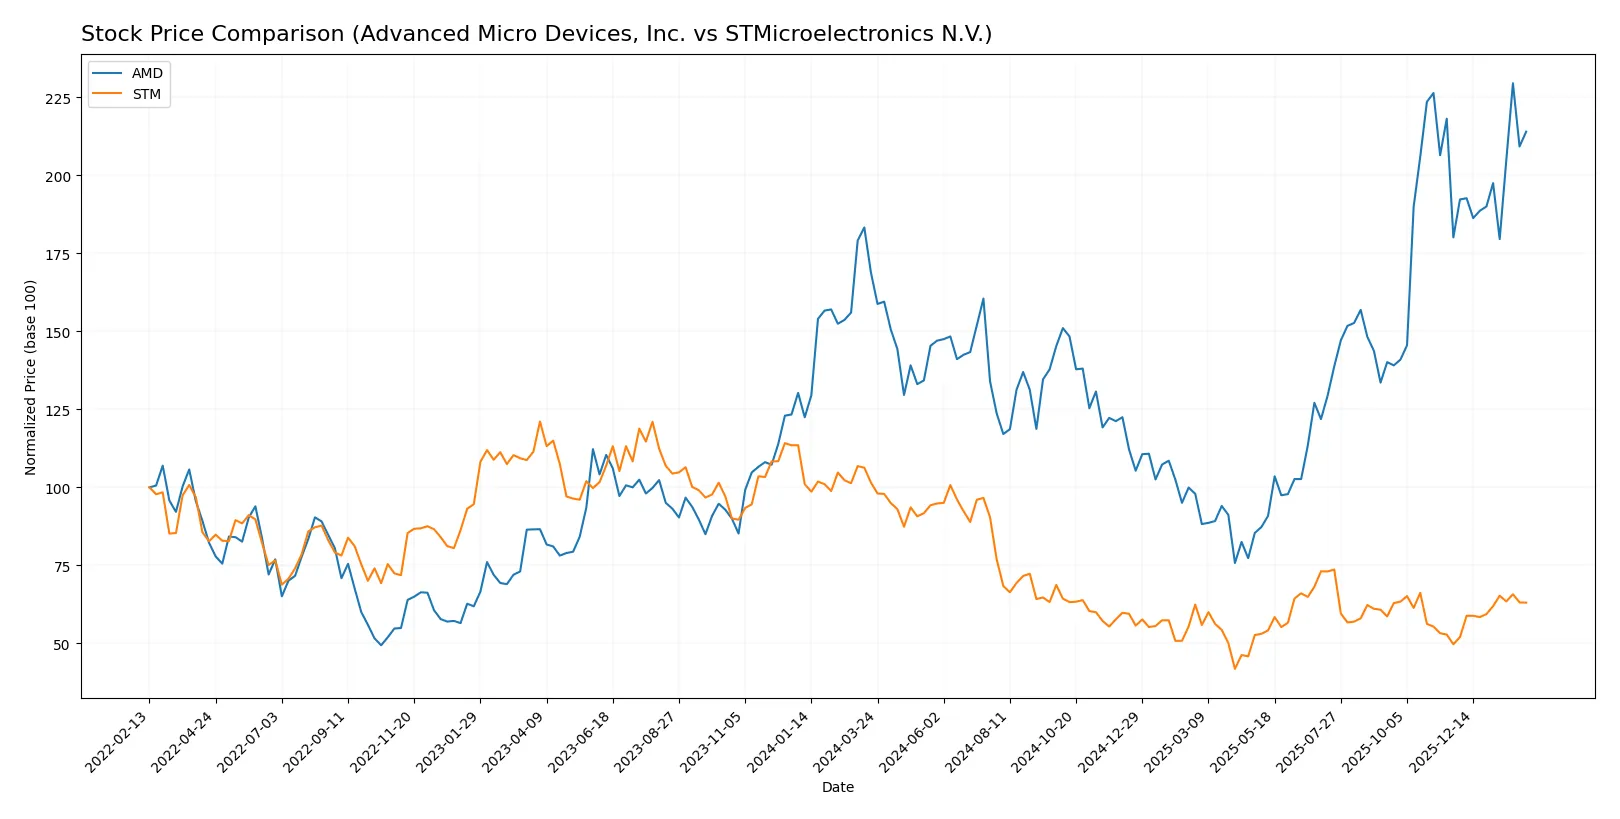
Which stock offers better returns?
Over the past 12 months, AMD’s stock surged with accelerating gains, while STM experienced a marked decline despite recent recovery efforts.
Trend Comparison
Advanced Micro Devices, Inc. (AMD) shows a strong bullish trend with a 26.72% price increase over 12 months and accelerating momentum. Volatility is high, with a 41.61 standard deviation.
STMicroelectronics N.V. (STM) exhibits a bearish trend, declining 37.88% over the same period despite recent modest gains. Volatility remains low with a 6.54 standard deviation.
AMD outperformed STM in market returns, delivering the highest price appreciation and sustained positive momentum across the analyzed timeframe.
Target Prices
Analysts present a moderately optimistic consensus for Advanced Micro Devices, Inc. and STMicroelectronics N.V.
| Company | Target Low | Target High | Consensus |
|---|---|---|---|
| Advanced Micro Devices, Inc. | 225 | 380 | 291.56 |
| STMicroelectronics N.V. | 28 | 45 | 37.67 |
AMD’s consensus target price at $291.56 suggests a 20% upside from the current $242.11 price. STM’s target consensus of $37.67 implies a 35% potential gain from $27.86.

Don’t Let Luck Decide Your Entry Point
Optimize your entry points with our advanced ProRealTime indicators. You’ll get efficient buy signals with precise price targets for maximum performance. Start outperforming now!
How do institutions grade them?
Here is a summary of recent institutional grades for Advanced Micro Devices, Inc. and STMicroelectronics N.V.:
Advanced Micro Devices, Inc. Grades
The latest grades from recognized institutions for AMD are as follows:
| Grading Company | Action | New Grade | Date |
|---|---|---|---|
| Wells Fargo | Maintain | Overweight | 2026-01-30 |
| Piper Sandler | Maintain | Overweight | 2026-01-26 |
| UBS | Maintain | Buy | 2026-01-26 |
| Bernstein | Maintain | Market Perform | 2026-01-21 |
| Keybanc | Upgrade | Overweight | 2026-01-13 |
| Truist Securities | Maintain | Buy | 2025-12-19 |
| Cantor Fitzgerald | Maintain | Overweight | 2025-12-16 |
| Morgan Stanley | Maintain | Equal Weight | 2025-11-12 |
| Wedbush | Maintain | Outperform | 2025-11-12 |
| Rosenblatt | Maintain | Buy | 2025-11-12 |
STMicroelectronics N.V. Grades
The latest grades from recognized institutions for STM are as follows:
| Grading Company | Action | New Grade | Date |
|---|---|---|---|
| TD Cowen | Maintain | Buy | 2025-10-24 |
| Susquehanna | Maintain | Positive | 2025-10-22 |
| Susquehanna | Maintain | Positive | 2025-07-25 |
| Baird | Upgrade | Outperform | 2025-07-22 |
| Susquehanna | Maintain | Positive | 2025-07-22 |
| Jefferies | Upgrade | Buy | 2025-02-19 |
| Bernstein | Downgrade | Market Perform | 2025-02-05 |
| Susquehanna | Maintain | Positive | 2025-01-31 |
| Barclays | Downgrade | Underweight | 2025-01-22 |
| JP Morgan | Downgrade | Neutral | 2024-12-09 |
Which company has the best grades?
AMD holds a stronger consensus with multiple “Buy” and “Overweight” ratings and fewer downgrades. STM shows mixed ratings, including downgrades to “Underweight” and “Neutral.” Investors may see AMD’s grades as more consistently positive, indicating stronger institutional confidence.
Risks specific to each company
The following categories identify the critical pressure points and systemic threats facing both firms in the 2026 market environment:
1. Market & Competition
Advanced Micro Devices, Inc. (AMD)
- Dominates in high-performance CPUs and GPUs but faces intense rivalry from Intel and Nvidia.
STMicroelectronics N.V. (STM)
- Competes in automotive and industrial segments with diversified product lines, facing pressure from specialized analog and sensor rivals.
2. Capital Structure & Debt
Advanced Micro Devices, Inc. (AMD)
- Low debt-to-equity ratio and strong interest coverage indicate financial prudence.
STMicroelectronics N.V. (STM)
- Maintains low leverage with a debt-to-assets of 8.6%, ensuring manageable financial risk.
3. Stock Volatility
Advanced Micro Devices, Inc. (AMD)
- High beta of 1.949 signals elevated volatility, increasing market risk.
STMicroelectronics N.V. (STM)
- Moderate beta of 1.322 suggests lower price swings compared to AMD.
4. Regulatory & Legal
Advanced Micro Devices, Inc. (AMD)
- Subject to US tech export controls and intellectual property scrutiny.
STMicroelectronics N.V. (STM)
- Faces EU regulations and compliance demands in automotive and industrial sectors.
5. Supply Chain & Operations
Advanced Micro Devices, Inc. (AMD)
- Relies heavily on third-party foundries, vulnerable to chip shortages and geopolitical tensions.
STMicroelectronics N.V. (STM)
- Diverse manufacturing footprint mitigates some supply chain risks but exposed to global logistics volatility.
6. ESG & Climate Transition
Advanced Micro Devices, Inc. (AMD)
- ESG initiatives advancing but under investor scrutiny for energy-intensive data center products.
STMicroelectronics N.V. (STM)
- Strong focus on sustainable manufacturing and energy-efficient products aligns well with climate goals.
7. Geopolitical Exposure
Advanced Micro Devices, Inc. (AMD)
- Exposed to US-China tensions impacting semiconductor supply and sales.
STMicroelectronics N.V. (STM)
- European base offers some geopolitical insulation, though global operations remain sensitive to trade conflicts.
Which company shows a better risk-adjusted profile?
STM’s lower volatility, stronger liquidity ratios, and diversified product base suggest a better risk-adjusted profile. AMD’s dominant market position is tempered by high stock volatility and unfavorable valuation metrics. STM’s Altman Z-Score and Piotroski Score also reflect stronger financial health, justifying cautious optimism amid sector headwinds.
Final Verdict: Which stock to choose?
Advanced Micro Devices (AMD) excels as a high-velocity innovator with unmatched revenue growth and robust free cash flow generation. Its superpower lies in aggressive R&D fueling market share gains in a fiercely competitive semiconductor space. However, AMD’s declining ROIC and stretched valuation remain points of vigilance. It suits aggressive growth portfolios willing to tolerate volatility for outsized returns.
STMicroelectronics (STM) offers a steadier profile anchored by a solid balance sheet and strong liquidity ratios. Its strategic moat centers on diversified industrial applications and stable recurring revenues, fostering resilience amid cyclical headwinds. While growth has slowed, STM presents a more conservative investment scenario fitting GARP portfolios seeking reasonable growth with defensible downside protection.
If you prioritize rapid expansion and market disruption, AMD is the compelling choice due to its innovation-led momentum and cash flow strength. However, if you seek better stability and capital preservation, STM offers superior balance sheet resilience and a more measured growth trajectory. Both stocks warrant caution given profitability pressures and sector cyclicality, underscoring the importance of aligning choice with your risk tolerance and investment horizon.
Disclaimer: Investment carries a risk of loss of initial capital. The past performance is not a reliable indicator of future results. Be sure to understand risks before making an investment decision.
Go Further
I encourage you to read the complete analyses of Advanced Micro Devices, Inc. and STMicroelectronics N.V. to enhance your investment decisions: