Home > Comparison > Technology > AMD vs SLAB
The strategic rivalry between Advanced Micro Devices, Inc. (AMD) and Silicon Laboratories Inc. (SLAB) defines the semiconductor sector’s innovation frontier. AMD operates as a large-scale, diversified chipmaker focusing on high-performance computing and graphics. In contrast, SLAB specializes in analog-intensive mixed-signal solutions for IoT applications, targeting niche markets. This analysis pits broad market leadership against focused innovation to identify which trajectory delivers superior risk-adjusted returns for a diversified portfolio.
Table of contents
Companies Overview
Advanced Micro Devices and Silicon Laboratories both drive innovation in the semiconductor industry with distinct market focuses and growth strategies.
Advanced Micro Devices, Inc.: Semiconductor Powerhouse
Advanced Micro Devices, Inc. dominates the semiconductor market with its diverse product portfolio spanning x86 microprocessors, GPUs, and server processors. Its revenue hinges on high-performance computing and graphics solutions for PCs, data centers, and game consoles. In 2026, AMD sharpens its competitive edge by advancing semi-custom SoC products and expanding its presence in cloud and enterprise segments.
Silicon Laboratories Inc.: IoT Semiconductor Specialist
Silicon Laboratories Inc. specializes in analog-intensive mixed-signal semiconductor solutions tailored for the Internet of Things (IoT). Its core revenue derives from wireless microcontrollers and sensors embedded in connected home, industrial automation, and smart building applications. In 2026, Silicon Labs intensifies its strategic focus on IoT growth markets, leveraging its fabless model and broad application reach.
Strategic Collision: Similarities & Divergences
Both companies compete within the semiconductor sector but pursue different philosophies: AMD emphasizes high-performance computing ecosystems, while Silicon Labs targets specialized IoT solutions with analog and mixed-signal expertise. Their primary battleground lies in delivering cutting-edge technology to distinct end markets—enterprise computing versus connected devices. This divergence defines their investment profiles: AMD offers scale and innovation depth, whereas Silicon Labs presents niche specialization with growth tied closely to IoT adoption.
Income Statement Comparison
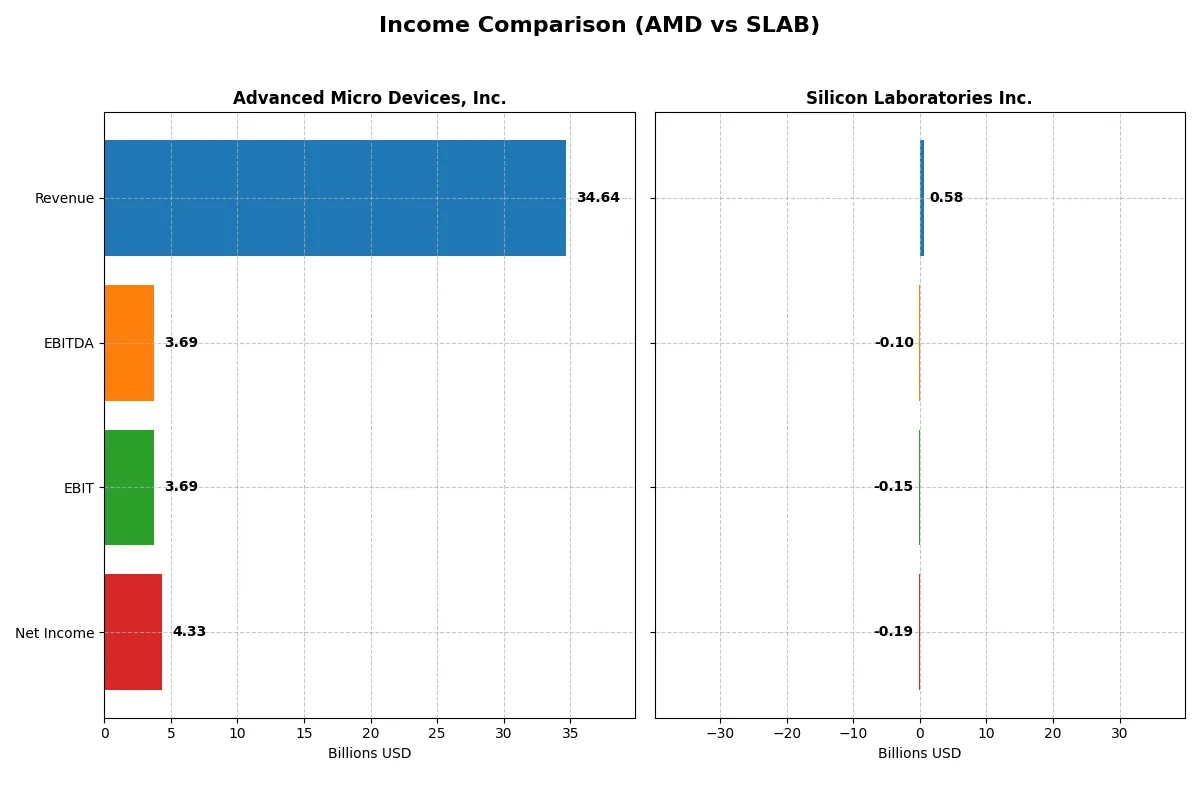
This data dissects the core profitability and scalability of both corporate engines to reveal who dominates the bottom line:
| Metric | Advanced Micro Devices, Inc. (AMD) | Silicon Laboratories Inc. (SLAB) |
|---|---|---|
| Revenue | 34.6B | 584M |
| Cost of Revenue | 17.5B | 272M |
| Operating Expenses | 13.5B | 478M |
| Gross Profit | 17.2B | 312M |
| EBITDA | 3.7B | -105M |
| EBIT | 3.7B | -154M |
| Interest Expense | 131M | 1.3M |
| Net Income | 4.3B | -191M |
| EPS | 2.67 | -5.93 |
| Fiscal Year | 2025 | 2024 |
Income Statement Analysis: The Bottom-Line Duel
This income statement comparison reveals which company drives superior operational efficiency and bottom-line profitability in their sector.
Advanced Micro Devices, Inc. Analysis
AMD’s revenue surged from $16.4B in 2021 to $34.6B in 2025, with net income climbing from $3.16B to $4.34B. Its gross margin holds strong near 50%, showcasing robust cost control. The 2025 net margin of 12.5% and an EPS jump to $2.67 signal accelerating profitability and operational momentum.
Silicon Laboratories Inc. Analysis
SLAB faced declining revenues, dropping from $1.02B in 2022 to $584M in 2024, dragging net income into losses of $191M in 2024. Despite a favorable 53.4% gross margin, its EBIT margin suffers at -26.3%, reflecting weak expense management. The persistent net losses and shrinking top line reveal deteriorating operational efficiency.
Margin Power vs. Revenue Scale
AMD outpaces SLAB decisively with double-digit net margins and substantial revenue growth, while SLAB struggles with shrinking sales and steep losses. AMD’s profile appeals to investors seeking scalable, profitable growth. SLAB’s current financials caution toward elevated risk and operational inefficiency.
Financial Ratios Comparison
These vital ratios act as a diagnostic tool to expose the underlying fiscal health, valuation premiums, and capital efficiency of the companies compared:
| Ratios | Advanced Micro Devices, Inc. (AMD) | Silicon Laboratories Inc. (SLAB) |
|---|---|---|
| ROE | 2.85% (2024) | -17.69% (2024) |
| ROIC | 2.49% (2024) | -14.71% (2024) |
| P/E | 124 (2024) | -22 (2024) |
| P/B | 3.52 (2024) | 3.81 (2024) |
| Current Ratio | 2.62 (2024) | 6.15 (2024) |
| Quick Ratio | 1.83 (2024) | 5.07 (2024) |
| D/E (Debt-to-Equity) | 0.038 (2024) | 0.014 (2024) |
| Debt-to-Assets | 3.20% (2024) | 1.27% (2024) |
| Interest Coverage | 20.7 (2024) | -126.3 (2024) |
| Asset Turnover | 0.37 (2024) | 0.48 (2024) |
| Fixed Asset Turnover | 10.63 (2024) | 4.42 (2024) |
| Payout ratio | 0% (2024) | 0% (2024) |
| Dividend yield | 0% (2024) | 0% (2024) |
| Fiscal Year | 2024 | 2024 |
Efficiency & Valuation Duel: The Vital Signs
Financial ratios act as the company’s DNA, exposing hidden risks and operational strengths that drive investor decisions in complex markets.
Advanced Micro Devices, Inc.
AMD shows a favorable net margin of 12.51%, signaling solid profitability, but its ROE and ROIC are zero, which raises concern. The stock trades at a stretched P/E of 80.54, suggesting high valuation. AMD offers no dividend yield, instead reinvesting heavily in R&D, with 25% of revenue fueling growth and innovation.
Silicon Laboratories Inc.
SLAB suffers from a steep net margin loss of -32.69% and negative returns on equity and invested capital, underscoring operational challenges. Its P/E is negative but labeled favorable due to losses, while the P/B ratio of 3.81 appears expensive. SLAB pays no dividends and focuses on R&D, allocating over 56% of revenue to future product development.
Premium Valuation vs. Operational Struggles
Both companies face unfavorable global ratios, but AMD’s strong margins and R&D investment contrast with SLAB’s deep losses and weaker profitability. AMD’s profile suits growth-oriented investors willing to pay a premium for innovation. SLAB fits those betting on a turnaround, accepting higher risk amid operational difficulties.
Which one offers the Superior Shareholder Reward?
I observe both AMD and Silicon Laboratories (SLAB) pay no dividends, focusing instead on reinvestment and buybacks. AMD maintains a robust free cash flow of 3.4B per share and a disciplined buyback program, supporting sustainable shareholder returns. SLAB posts negative free cash flow and net losses, impeding buybacks and signaling risk. AMD’s lower payout ratio (0%) paired with strong operating margins and positive cash flow underpin its superior capital allocation. SLAB’s volatile margins and negative cash flow question long-term distribution sustainability. I conclude AMD offers a more attractive total return profile for 2026 investors.
Comparative Score Analysis: The Strategic Profile
The radar chart reveals the fundamental DNA and trade-offs of Advanced Micro Devices, Inc. (AMD) and Silicon Laboratories Inc. (SLAB), highlighting their financial strengths and weaknesses:
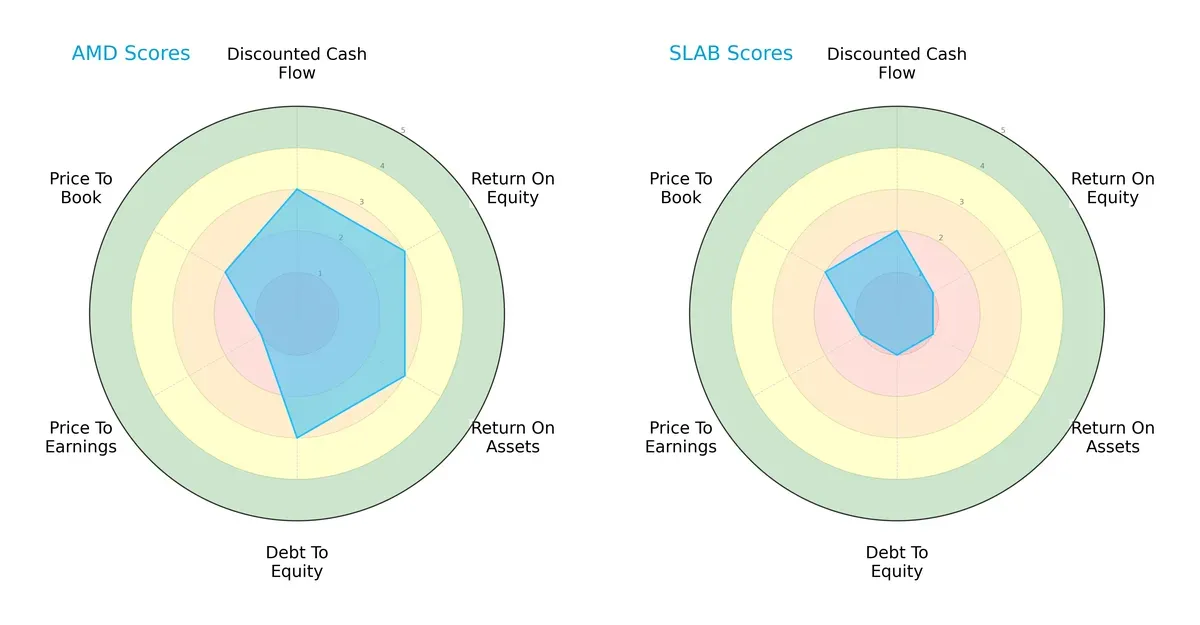
AMD demonstrates a more balanced profile with moderate scores across DCF, ROE, ROA, and debt-to-equity metrics. SLAB, by contrast, shows consistent weakness, particularly in ROE, ROA, and leverage, signaling reliance on limited competitive advantages. AMD’s very unfavorable P/E score suggests valuation risk despite operational strength.
Bankruptcy Risk: Solvency Showdown
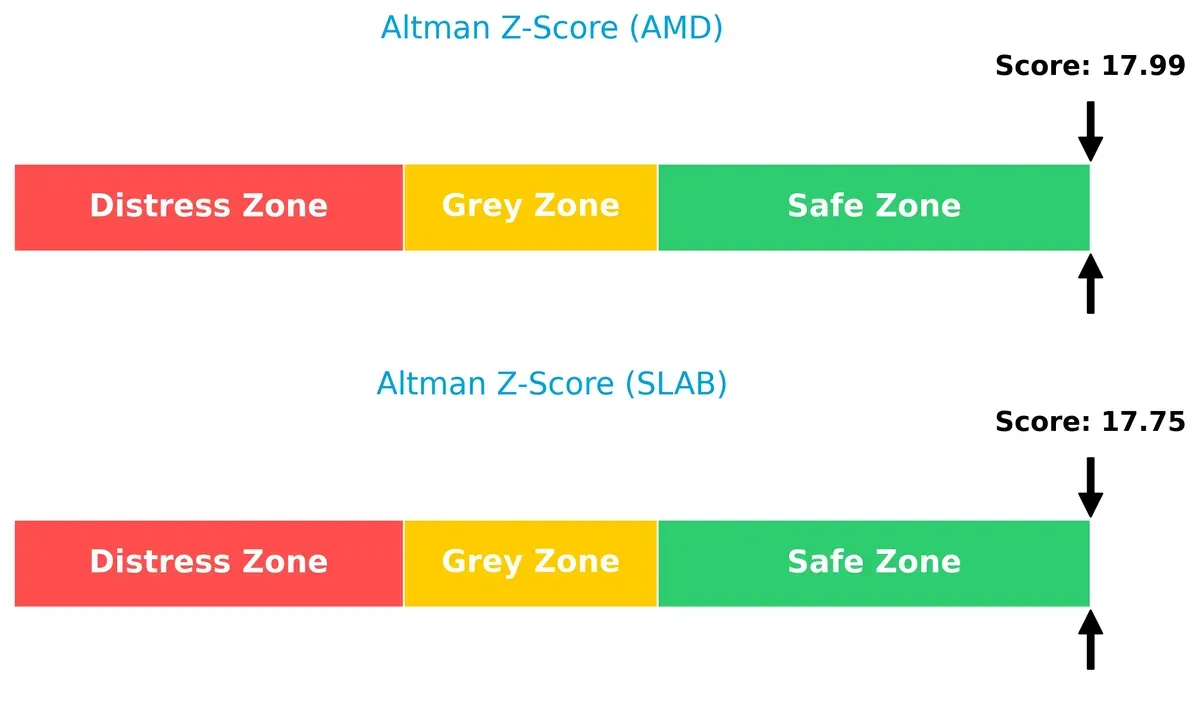
AMD and SLAB both score deep in the safe zone on the Altman Z-Score scale, implying strong solvency and low bankruptcy risk amid current economic cycles:
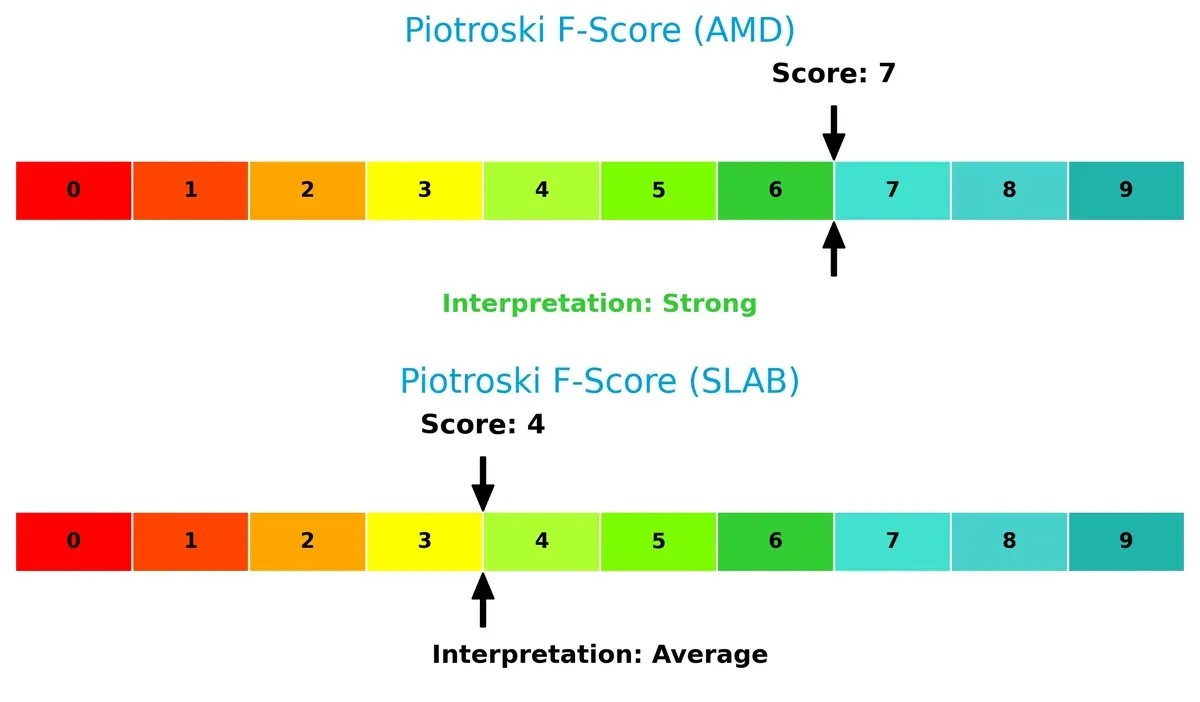
Financial Health: Quality of Operations
AMD’s Piotroski F-Score of 7 indicates strong financial health and operational quality. SLAB’s score of 4 flags moderate concerns, suggesting weaker internal controls and profitability compared to AMD:
How are the two companies positioned?
This section dissects the operational DNA of AMD and SLAB by comparing their revenue distribution by segment and internal strengths and weaknesses. The final objective is to confront their economic moats to identify which business model delivers the most resilient and sustainable competitive advantage today.
Revenue Segmentation: The Strategic Mix
This visual comparison dissects how Advanced Micro Devices, Inc. and Silicon Laboratories Inc. diversify their income streams and where their primary sector bets lie:
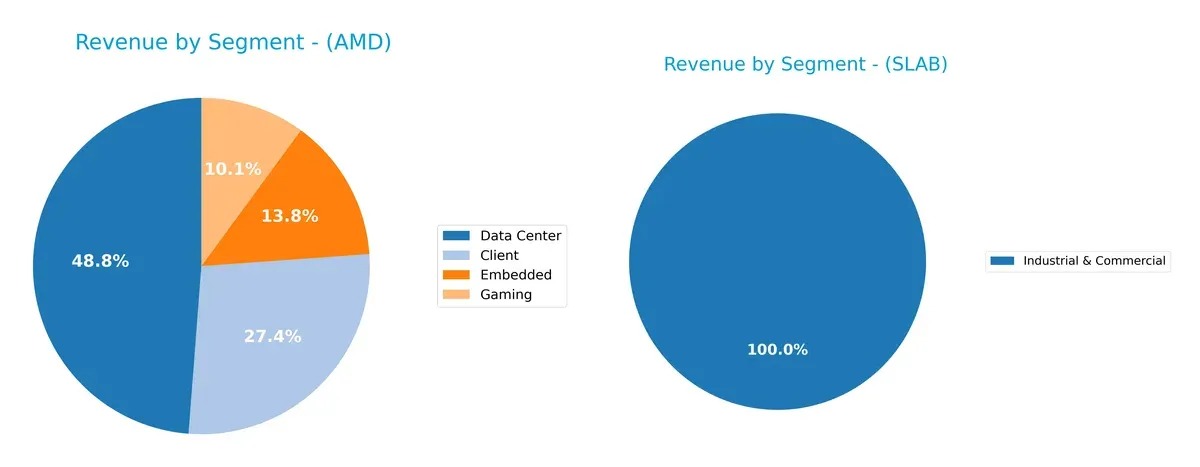
AMD pivots on Data Center, which dwarfs other segments at $12.6B in 2024, while Client and Embedded revenues show meaningful scale at $7.1B and $3.6B. This mix reveals AMD’s ecosystem lock-in across high-growth cloud and computing markets. Conversely, Silicon Laboratories relies heavily on a single $339M Industrial & Commercial segment. This concentration highlights sector-specific risk, lacking AMD’s broad infrastructure dominance. Investors must weigh AMD’s diversified growth against Silicon Labs’ focused niche exposure.
Strengths and Weaknesses Comparison
This table compares the Strengths and Weaknesses of AMD and SLAB based on diversification, profitability, financial statement, innovation, global presence, and market share:
AMD Strengths
- Diverse revenue streams across Client, Data Center, Embedded, and Gaming segments
- Large global presence with significant sales in the US, China, and Singapore
- Favorable net margin at 12.51%
- Strong interest coverage at 28.2 times
- Low debt-to-assets ratio
SLAB Strengths
- Favorable quick ratio at 5.07 indicates strong liquidity
- Low debt-to-assets at 1.27% supports financial stability
- Favorable fixed asset turnover at 4.42 shows efficient asset use
- Presence in Industrial & Commercial markets with steady revenues
- Global sales spread including China, US, and Taiwan
AMD Weaknesses
- Unfavorable ROE and ROIC at 0%, below WACC at 12.94% indicates weak capital returns
- Unfavorable current and quick ratios suggest liquidity concerns
- High P/E ratio at 80.54 signals potential overvaluation
- Low asset and fixed asset turnover ratios limit operational efficiency
- No dividend yield reported
SLAB Weaknesses
- Negative net margin (-32.69%) and ROE (-17.69%) indicate profitability struggles
- Negative interest coverage (-117.18) signals risk in debt servicing
- Unfavorable P/B at 3.81 and current ratio at 6.15 suggests valuation and liquidity risks
- Narrow product focus limits diversification
- Unfavorable asset turnover at 0.48 constrains revenue generation
Both companies face significant profitability and capital efficiency challenges despite having solid liquidity and asset management in some areas. AMD’s diversified revenue base and global footprint contrast with SLAB’s more concentrated market presence and weaker profitability metrics. These factors shape their strategic options for growth and risk mitigation.
The Moat Duel: Analyzing Competitive Defensibility
A structural moat is the sole barrier protecting long-term profits from relentless competitive erosion. Let’s dissect how these two semiconductor firms defend their turf:
Advanced Micro Devices, Inc.: Innovation-Driven Product Moat
AMD’s competitive edge stems from cutting-edge processor and GPU technology. This manifests in robust revenue growth (110% over five years) and stable gross margins near 50%. Yet, its declining ROIC signals eroding capital efficiency, challenging moat durability in 2026 as competition intensifies.
Silicon Laboratories Inc.: Niche IoT Solutions Moat
Silicon Labs relies on specialized mixed-signal and wireless microcontrollers, targeting IoT applications. Despite a higher gross margin (53%), the firm suffers negative EBIT and net margins, reflecting weak profitability and a shrinking market footprint. Its deteriorating ROIC trend warns of fragile competitive positioning.
Innovation Velocity vs. Niche Specialization: Who Holds the Moat?
Both companies show very unfavorable moat metrics with declining ROIC, but AMD’s scale and superior revenue momentum carve a wider moat. I see AMD better equipped to defend and potentially deepen its market share, while Silicon Labs faces a tougher uphill battle.
Which stock offers better returns?
The past year showed distinct bullish trends for both stocks, with Advanced Micro Devices accelerating strongly, while Silicon Laboratories posted moderate gains amid lower volatility.
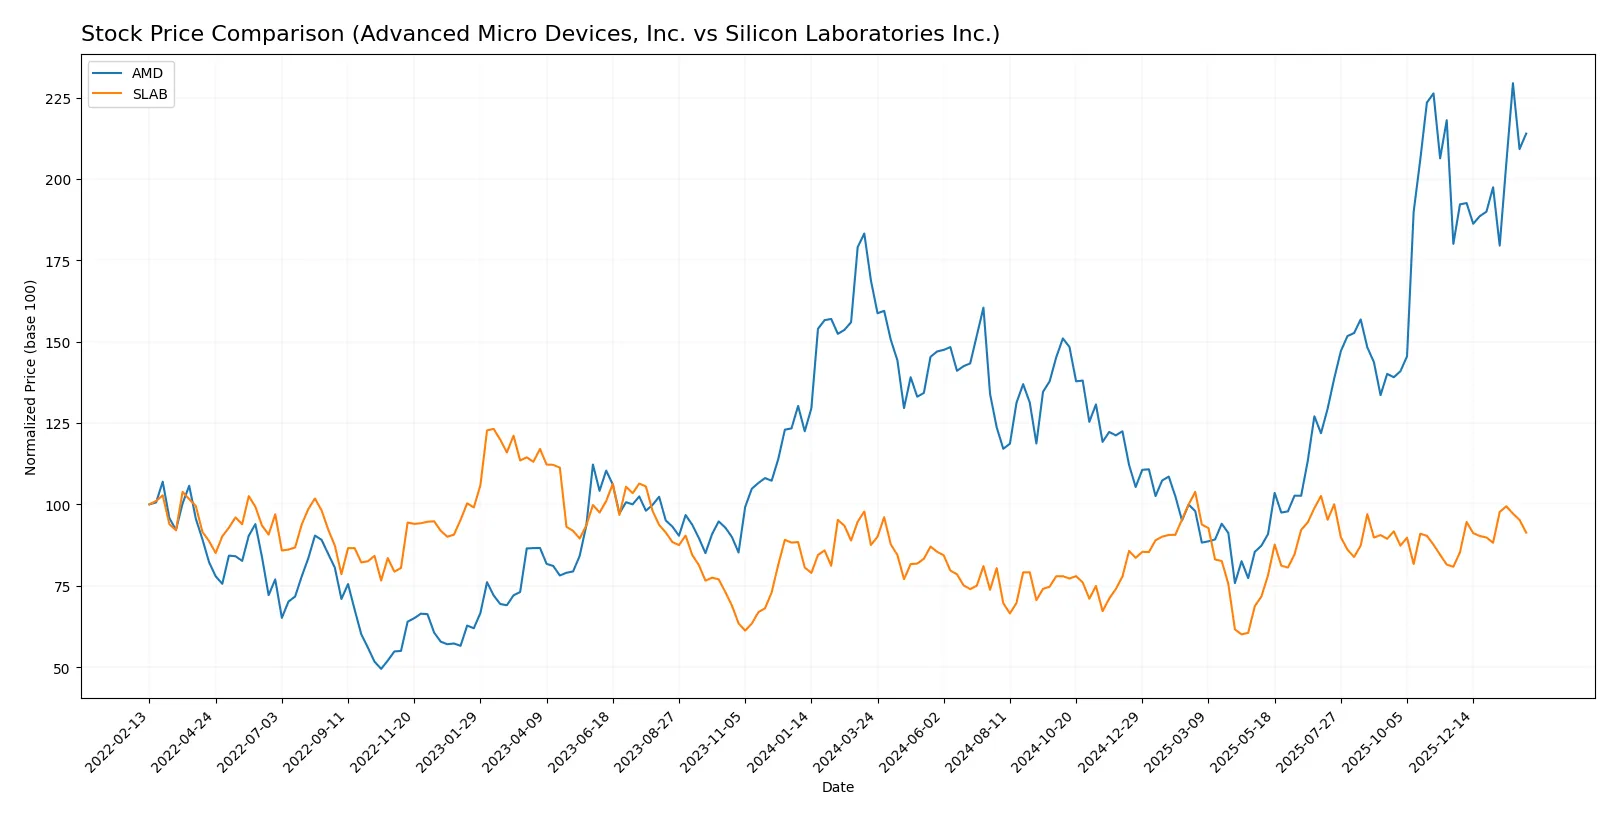
Trend Comparison
Advanced Micro Devices (AMD) delivered a 26.72% price increase over 12 months, confirming a bullish trend with accelerating momentum and a high volatility level at 41.61%. Its price ranged between 85.76 and 259.68.
Silicon Laboratories Inc. (SLAB) showed a 4.37% rise over the same period, also bullish with acceleration but far lower volatility at 14.1%. Its price fluctuated between 89.82 and 155.33.
AMD outperformed SLAB significantly, delivering the highest market performance with a more pronounced upward trajectory and greater price appreciation.
Target Prices
Analysts present a moderately optimistic consensus on the target prices for Advanced Micro Devices, Inc. and Silicon Laboratories Inc.
| Company | Target Low | Target High | Consensus |
|---|---|---|---|
| Advanced Micro Devices, Inc. | 225 | 380 | 291.56 |
| Silicon Laboratories Inc. | 130 | 165 | 151.67 |
The consensus target for AMD sits roughly 20% above the current price of 242.11, signaling expected growth. Silicon Laboratories’ consensus target also exceeds its current 136.62 price by about 11%, reflecting moderate upside potential.

Don’t Let Luck Decide Your Entry Point
Optimize your entry points with our advanced ProRealTime indicators. You’ll get efficient buy signals with precise price targets for maximum performance. Start outperforming now!
How do institutions grade them?
The following tables summarize recent institutional grades for Advanced Micro Devices, Inc. and Silicon Laboratories Inc.:
Advanced Micro Devices, Inc. Grades
Here are the recent grades assigned by leading financial institutions for AMD:
| Grading Company | Action | New Grade | Date |
|---|---|---|---|
| Wells Fargo | Maintain | Overweight | 2026-01-30 |
| Piper Sandler | Maintain | Overweight | 2026-01-26 |
| UBS | Maintain | Buy | 2026-01-26 |
| Bernstein | Maintain | Market Perform | 2026-01-21 |
| Keybanc | Upgrade | Overweight | 2026-01-13 |
| Truist Securities | Maintain | Buy | 2025-12-19 |
| Cantor Fitzgerald | Maintain | Overweight | 2025-12-16 |
| Morgan Stanley | Maintain | Equal Weight | 2025-11-12 |
| Wedbush | Maintain | Outperform | 2025-11-12 |
| Rosenblatt | Maintain | Buy | 2025-11-12 |
Silicon Laboratories Inc. Grades
Below is the institutional grading history for Silicon Laboratories Inc.:
| Grading Company | Action | New Grade | Date |
|---|---|---|---|
| Morgan Stanley | Maintain | Equal Weight | 2025-08-06 |
| Susquehanna | Maintain | Neutral | 2025-08-06 |
| Barclays | Maintain | Equal Weight | 2025-08-05 |
| Susquehanna | Maintain | Neutral | 2025-07-22 |
| Stifel | Maintain | Buy | 2025-07-18 |
| Keybanc | Maintain | Overweight | 2025-07-08 |
| Benchmark | Maintain | Buy | 2025-05-27 |
| Benchmark | Maintain | Buy | 2025-05-14 |
| Needham | Maintain | Buy | 2025-05-14 |
| Susquehanna | Maintain | Neutral | 2025-05-14 |
Which company has the best grades?
Advanced Micro Devices, Inc. consistently receives higher grades such as Buy and Overweight from multiple firms, including recent upgrades. Silicon Laboratories Inc. holds mainly Neutral and Equal Weight ratings with fewer Buy endorsements. This divergence signals stronger institutional confidence in AMD, potentially influencing investor sentiment towards it.
Risks specific to each company
The following categories identify the critical pressure points and systemic threats facing both firms in the 2026 market environment:
1. Market & Competition
Advanced Micro Devices, Inc. (AMD)
- Operates in fiercely competitive semiconductor markets with high innovation pressure and large rivals like Intel and Nvidia.
Silicon Laboratories Inc. (SLAB)
- Faces niche competition in analog-intensive mixed-signal solutions but is vulnerable due to smaller scale and specialized market segments.
2. Capital Structure & Debt
AMD
- Maintains a favorable debt-to-equity profile and strong interest coverage, indicating prudent leverage management.
SLAB
- Exhibits very low debt levels but negative interest coverage signals operational losses impacting financial stability.
3. Stock Volatility
AMD
- Beta near 1.95 reflects high sensitivity to market swings, typical for large-cap tech stocks.
SLAB
- Lower beta at 1.54 shows relatively less volatility but recent price drops suggest emerging investor concerns.
4. Regulatory & Legal
AMD
- Subject to global semiconductor export controls and antitrust scrutiny in key markets.
SLAB
- Faces regulatory risks in IoT product certifications and international trade compliance, especially in China and US.
5. Supply Chain & Operations
AMD
- Relies on complex global supply chains vulnerable to geopolitical tensions and chip manufacturing constraints.
SLAB
- Smaller scale and fabless model reduce capital intensity but increase dependence on foundry partners and component suppliers.
6. ESG & Climate Transition
AMD
- Invests heavily in sustainability initiatives but faces pressure to reduce carbon footprint from large data center clients.
SLAB
- ESG efforts less publicized; risks include compliance costs and transition challenges for analog and IoT device production.
7. Geopolitical Exposure
AMD
- High exposure to US-China tech tensions impacting supply chains and sales in Asia-Pacific markets.
SLAB
- Moderate exposure with focus on IoT markets, but sensitive to trade policies affecting semiconductor components.
Which company shows a better risk-adjusted profile?
AMD’s most impactful risk is market competition and macro-driven supply chain fragility. SLAB’s greatest challenge lies in operational losses and weak profitability metrics. Despite AMD’s higher stock volatility, its stronger capital structure and safer Altman Z-score suggest a better risk-adjusted profile. SLAB’s negative margins and deteriorating return ratios heighten its financial risk. The recent sharp stock price drop (-4.7% for SLAB versus -1.7% for AMD) underlines investor caution about SLAB’s earnings sustainability. Overall, AMD balances growth and risk more effectively in 2026’s turbulent semiconductor landscape.
Final Verdict: Which stock to choose?
Advanced Micro Devices (AMD) stands out as a powerhouse of innovation and revenue growth, driven by its impressive ability to generate cash and reinvest in cutting-edge R&D. Its main point of vigilance remains the declining efficiency in capital returns, which could pressure long-term value creation. AMD suits portfolios chasing aggressive growth with a tolerance for valuation risk.
Silicon Laboratories (SLAB) offers a strategic moat in specialized semiconductor markets, underpinned by its strong liquidity and low leverage. Compared to AMD, SLAB presents a safer balance sheet profile but struggles with profitability and value destruction, posing a significant risk. It fits investors seeking GARP (Growth at a Reasonable Price) with patience for a turnaround.
If you prioritize high growth and innovation-driven returns, AMD is the compelling choice due to its robust income momentum and market leadership, despite its valuation premium. However, if you seek a more conservative exposure with a focus on balance sheet strength and niche market positioning, SLAB offers better stability but with considerable profitability challenges.
Disclaimer: Investment carries a risk of loss of initial capital. The past performance is not a reliable indicator of future results. Be sure to understand risks before making an investment decision.
Go Further
I encourage you to read the complete analyses of Advanced Micro Devices, Inc. and Silicon Laboratories Inc. to enhance your investment decisions: