Home > Comparison > Technology > AMD vs ONTO
The strategic rivalry between Advanced Micro Devices, Inc. (AMD) and Onto Innovation Inc. shapes the semiconductor sector’s competitive landscape. AMD operates as a diversified semiconductor powerhouse, focusing on CPUs and GPUs across multiple markets. Onto Innovation specializes in precision process control tools, targeting semiconductor manufacturing efficiency. This analysis pits AMD’s broad market reach against Onto’s niche expertise to determine which offers superior risk-adjusted returns for a diversified portfolio.
Table of contents
Companies Overview
Advanced Micro Devices and Onto Innovation stand as pivotal players in the semiconductor market, each driving innovation in distinct niches.
Advanced Micro Devices, Inc.: Semiconductor Powerhouse
Advanced Micro Devices dominates as a semiconductor giant specializing in microprocessors and GPUs. Its core revenue derives from high-performance CPUs and GPUs for PCs, servers, and gaming consoles. In 2026, AMD strategically focuses on expanding its data center and high-performance computing segments, leveraging cutting-edge technology to challenge incumbents.
Onto Innovation Inc.: Precision Process Control Leader
Onto Innovation operates as a specialist in semiconductor process control tools and software. It earns revenue by providing inspection, metrology, and analytical solutions crucial for semiconductor manufacturing yield. In 2026, Onto emphasizes advancing its integrated software suites and packaging test capabilities to enhance manufacturing precision and efficiency.
Strategic Collision: Similarities & Divergences
AMD and Onto Innovation share a commitment to semiconductor innovation but diverge in approach: AMD targets end-product computing power, while Onto focuses on manufacturing process optimization. Their battleground lies in the semiconductor value chain—AMD in chip design, Onto in production quality. These differences shape distinct investment profiles: AMD offers growth through product innovation, Onto through enabling manufacturing excellence.
Income Statement Comparison
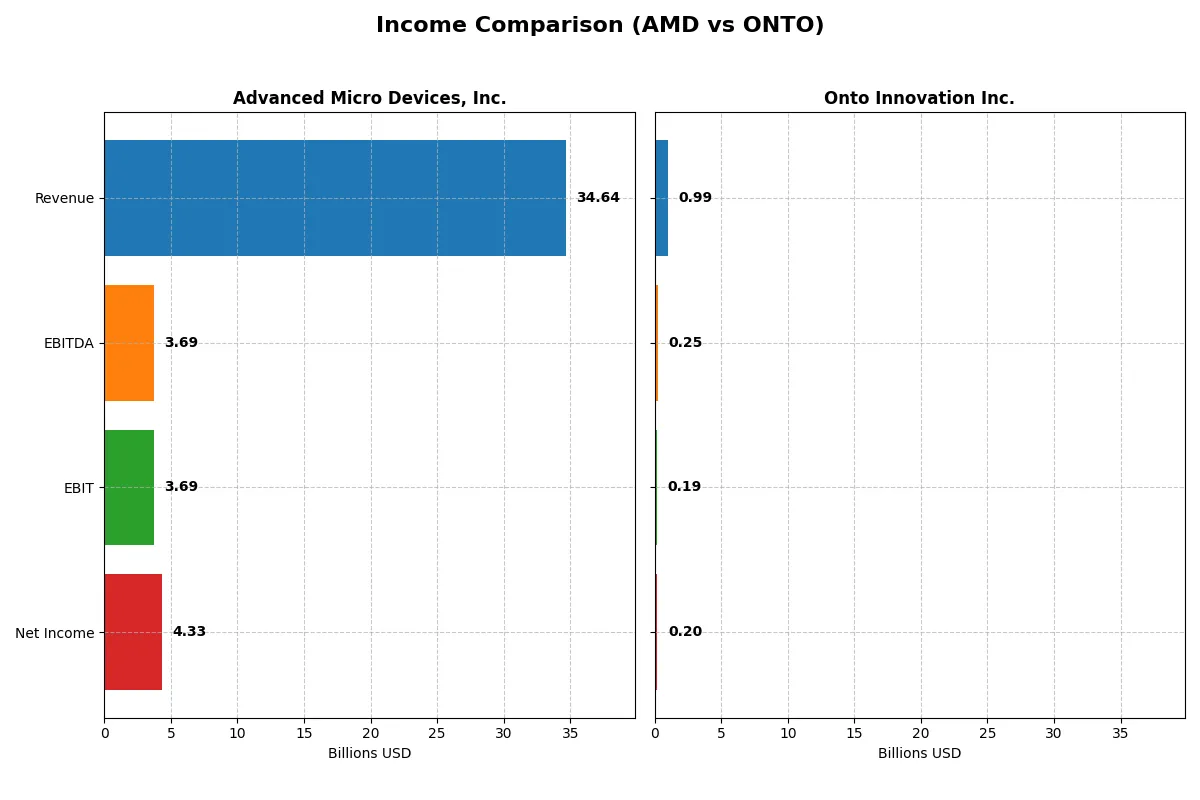
This data dissects the core profitability and scalability of both corporate engines to reveal who dominates the bottom line:
| Metric | Advanced Micro Devices, Inc. (AMD) | Onto Innovation Inc. (ONTO) |
|---|---|---|
| Revenue | 34.6B | 987M |
| Cost of Revenue | 17.5B | 472M |
| Operating Expenses | 13.5B | 328M |
| Gross Profit | 17.2B | 515M |
| EBITDA | 3.7B | 249M |
| EBIT | 3.7B | 187M |
| Interest Expense | 131M | 0 |
| Net Income | 4.3B | 202M |
| EPS | 2.67 | 4.09 |
| Fiscal Year | 2025 | 2024 |
Income Statement Analysis: The Bottom-Line Duel
This income statement comparison reveals which company runs its business more efficiently and delivers stronger profitability momentum.
Advanced Micro Devices, Inc. Analysis
AMD’s revenue jumped from $22.7B in 2023 to $34.6B in 2025, signaling robust top-line growth. Net income surged from $854M to $4.3B, doubling margins to 12.5%. Gross margin sits near 50%, reflecting solid cost control. The 2025 EBIT margin improved to 10.7%, showing operational efficiency gains and strong momentum.
Onto Innovation Inc. Analysis
Onto Innovation’s revenue rose steadily from $556M in 2020 to $987M in 2024, a solid growth trajectory. Net income expanded dramatically from $31M to $202M, lifting net margin to 20.4%. Gross margin exceeds 52%, and EBIT margin reached 19% in 2024, indicating healthy profitability and effective cost management with accelerating earnings growth.
Margin Strength vs. Growth Scale
Onto Innovation leads in margin efficiency with a 20.4% net margin versus AMD’s 12.5%, driven by higher EBIT margin and cost discipline. AMD, however, boasts far larger revenue scale and faster absolute profit growth. Investors seeking higher margin profiles may prefer Onto, while those favoring scale and momentum should watch AMD’s expanding earnings engine.
Financial Ratios Comparison
These vital ratios act as a diagnostic tool to expose the underlying fiscal health, valuation premiums, and capital efficiency of the companies compared below:
| Ratios | Advanced Micro Devices, Inc. (AMD) | Onto Innovation Inc. (ONTO) |
|---|---|---|
| ROE | 2.85% (2024) | 10.47% (2024) |
| ROIC | 2.49% (2024) | 8.77% (2024) |
| P/E | 124 (2024) | 42 (2024) |
| P/B | 3.52 (2024) | 4.37 (2024) |
| Current Ratio | 2.62 (2024) | 8.69 (2024) |
| Quick Ratio | 1.83 (2024) | 7.00 (2024) |
| D/E | 0.038 (2024) | 0.008 (2024) |
| Debt-to-Assets | 3.20% (2024) | 0.72% (2024) |
| Interest Coverage | 20.65 (2024) | N/A |
| Asset Turnover | 0.37 (2024) | 0.47 (2024) |
| Fixed Asset Turnover | 10.63 (2024) | 7.16 (2024) |
| Payout ratio | 0% (2024) | 0% (2024) |
| Dividend yield | 0% (2024) | 0% (2024) |
| Fiscal Year | 2024 | 2024 |
Efficiency & Valuation Duel: The Vital Signs
Financial ratios serve as a company’s DNA, unveiling hidden risks and operational excellence that shape investment decisions.
Advanced Micro Devices, Inc.
AMD posts a solid net margin of 12.51%, yet its ROE and ROIC both read zero, signaling operational challenges. The stock trades at a stretched P/E of 80.54, reflecting high growth expectations. With no dividend payout, AMD reinvests heavily in R&D, dedicating over 23% of revenue to innovation, aiming for long-term value creation.
Onto Innovation Inc.
Onto Innovation shows a stronger net margin at 20.43% and a moderate ROE of 10.47%, with ROIC at 8.77%, indicating reasonable efficiency. Its P/E of 41.76 is elevated but less extreme than AMD’s. Onto offers no dividends either, focusing on growth through consistent R&D spending, around 12% of revenue, while maintaining a robust current ratio of 8.69.
Premium Valuation vs. Operational Safety
AMD’s valuation is notably stretched and profitability metrics are weak, posing higher risk despite robust R&D investment. Onto balances higher margins with better capital efficiency and a more conservative valuation, offering a steadier profile. Investors seeking growth volatility may lean toward AMD; those prioritizing operational safety and margin strength might prefer Onto.
Which one offers the Superior Shareholder Reward?
I observe both AMD and Onto Innovation pay no dividends, focusing shareholder returns on growth and buybacks. AMD’s buyback intensity is moderate, with a free cash flow per share of $3.4 and a payout ratio at zero. Onto Innovation reinvests heavily, boasting a stronger free cash flow per share of $4.3 and an exceptionally high operating cash flow coverage ratio of 16.2, indicating robust buyback capacity and operational strength. While AMD’s P/E ratio is steep at 80+, Onto’s is more reasonable at 41.8, suggesting better valuation discipline. Onto’s distribution model, centered on sustainable reinvestment and share repurchase flexibility, offers a more attractive total return profile in 2026.
Comparative Score Analysis: The Strategic Profile
The radar chart reveals the fundamental DNA and trade-offs of Advanced Micro Devices, Inc. and Onto Innovation Inc., highlighting their financial strengths and valuation approaches:
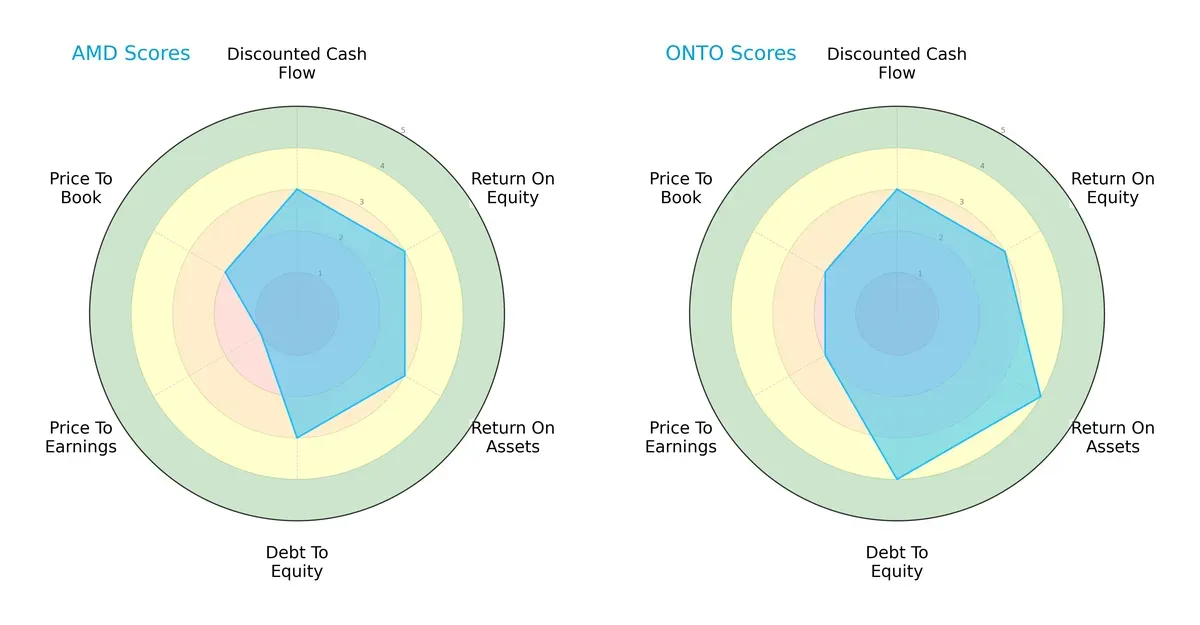
Both companies share moderate DCF and ROE scores, signaling stable cash flow expectations and equity returns. Onto Innovation edges ahead with a stronger ROA and a healthier debt-to-equity profile, reflecting more efficient asset use and better leverage management. AMD’s valuation scores lag, especially in P/E, indicating a higher market premium. Onto Innovation presents a more balanced and robust financial profile, while AMD relies on specific profitability metrics despite its valuation challenges.
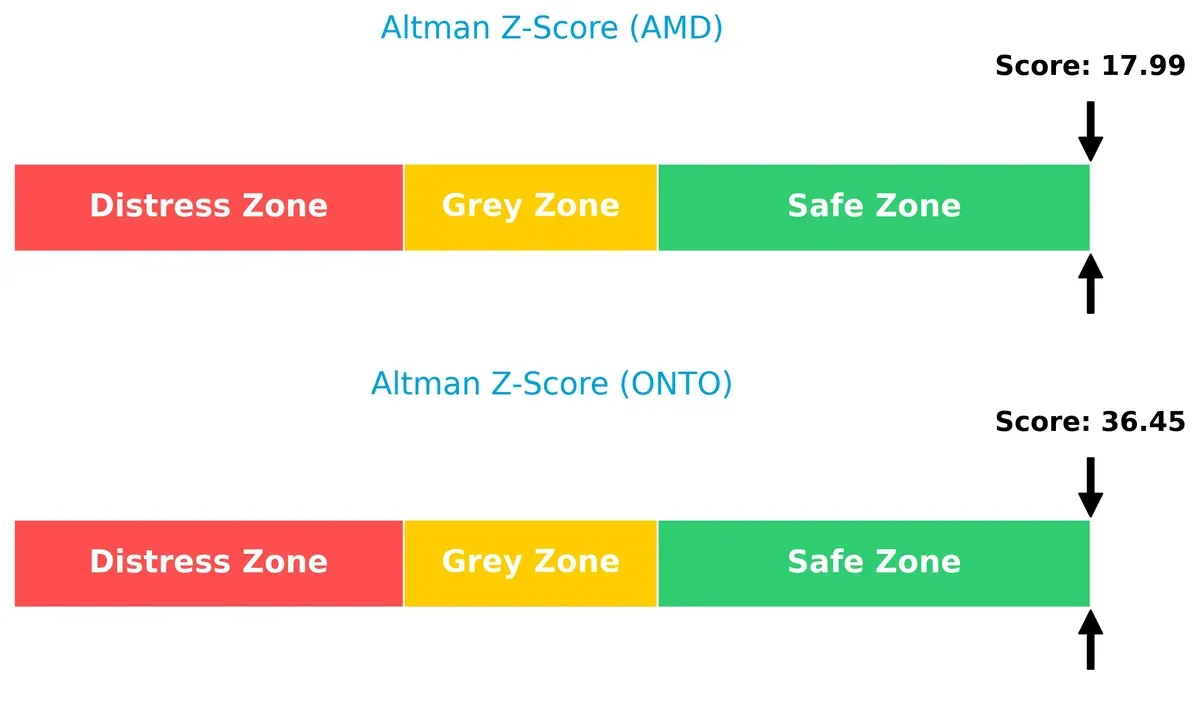
Bankruptcy Risk: Solvency Showdown
Onto Innovation’s Altman Z-Score significantly surpasses AMD’s, placing both firms safely above distress thresholds but underscoring Onto’s superior solvency in this cycle:
Financial Health: Quality of Operations
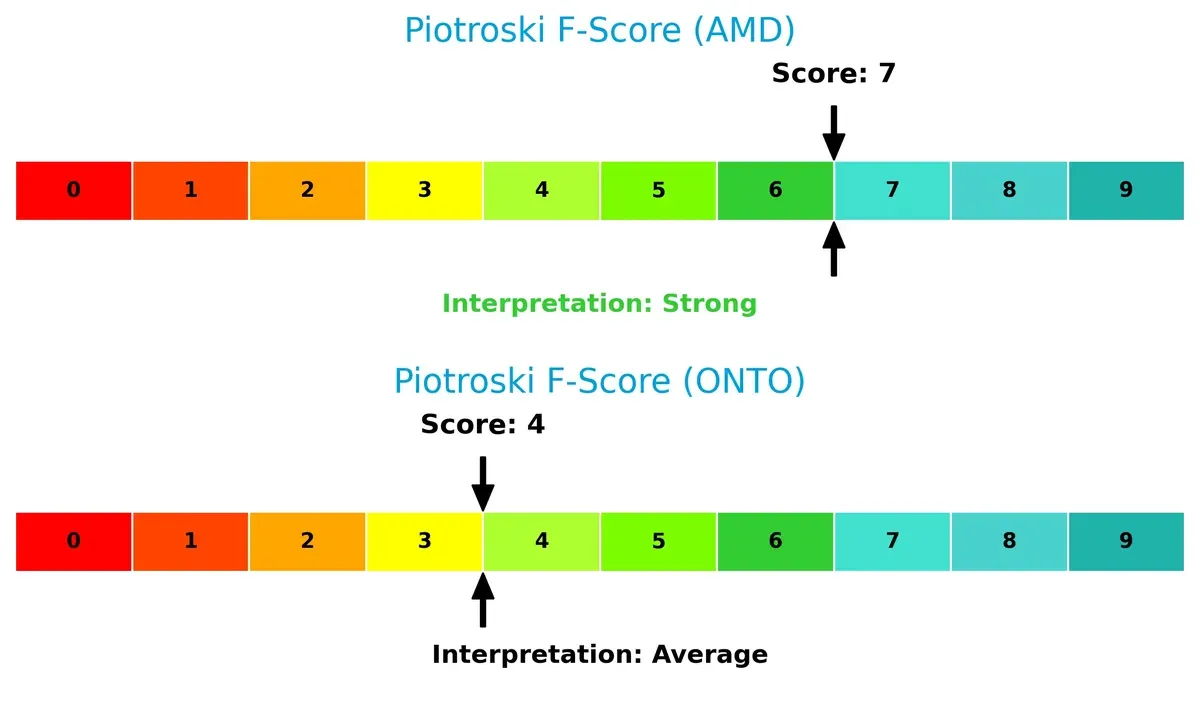
AMD’s Piotroski F-Score of 7 signals strong financial health, outpacing Onto Innovation’s moderate score of 4, which may raise caution about operational efficiency and internal metrics:
How are the two companies positioned?
This section dissects the operational DNA of AMD and Onto by comparing their revenue distribution by segment alongside their internal strengths and weaknesses. The final objective confronts their economic moats to reveal which model offers the most resilient competitive advantage today.
Revenue Segmentation: The Strategic Mix
This visual comparison dissects how Advanced Micro Devices, Inc. and Onto Innovation Inc. diversify their income streams and where their primary sector bets lie:
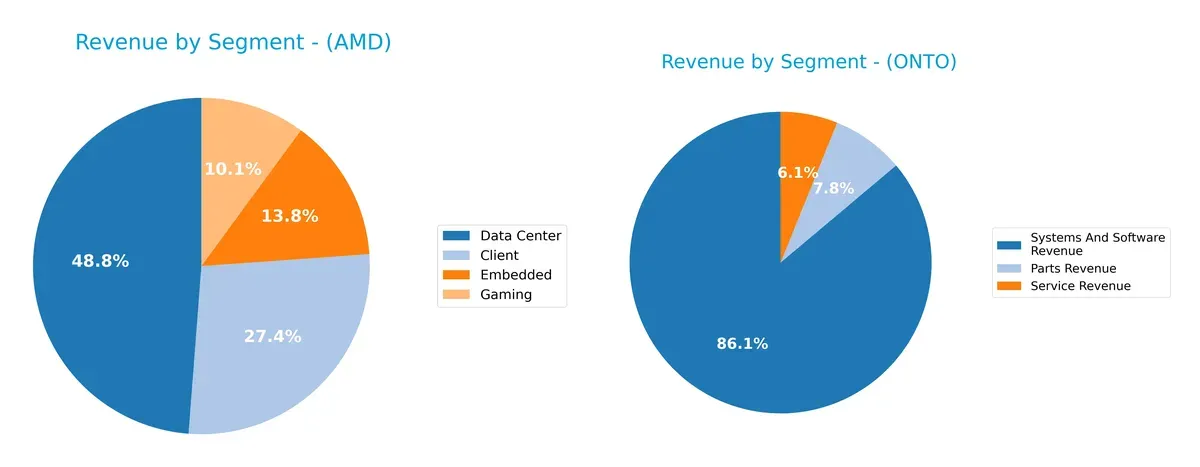
AMD’s revenue pivots on Data Center at $12.6B, dwarfing other segments like Client ($7.1B) and Embedded ($3.6B). Onto Innovation leans heavily on Systems and Software Revenue at $850M, anchoring its portfolio more than Parts ($76.6M) and Service ($60.3M). AMD’s focus on high-growth infrastructure markets signals ecosystem lock-in, while Onto’s concentration suggests exposure to niche tech cycles and potential concentration risk.
Strengths and Weaknesses Comparison
This table compares the strengths and weaknesses of AMD and Onto Innovation in key financial and market dimensions:
AMD Strengths
- Diverse revenue streams across Client, Data Center, Embedded, and Gaming segments
- Strong global presence with significant sales in the US, China, and Asia
- Favorable net margin at 12.51%
- Low debt levels and strong interest coverage ratio
ONTO Strengths
- High net margin at 20.43%
- Favorable quick ratio and low debt to assets
- Strong fixed asset turnover indicating efficient use of property and equipment
- Balanced product and service revenue mix
- Global sales presence including Korea and Taiwan
AMD Weaknesses
- Unfavorable ROE, ROIC, and WACC suggest poor capital efficiency
- High P/E ratio of 80.54 indicates expensive valuation
- Weak liquidity ratios (current and quick)
- Low asset turnover signals underutilized assets
- Zero dividend yield
ONTO Weaknesses
- Unfavorable P/E and price-to-book ratios indicate overvaluation
- Elevated current ratio may signal inefficient asset use
- Moderate ROE and ROIC classified as neutral
- Lower asset turnover compared to sector benchmarks
- Zero dividend yield
Both companies show solid profitability but face challenges in valuation and asset utilization. AMD’s broad product and geographic diversification contrasts with Onto’s operational efficiency and focused innovation, shaping distinct strategic priorities.
The Moat Duel: Analyzing Competitive Defensibility
A structural moat is the only true shield guarding long-term profits against relentless competitive erosion:
Advanced Micro Devices, Inc. (AMD): Innovation-Driven Scale Moat
AMD’s moat stems from cutting-edge semiconductor design and scale economies. Historically, it shows margin resilience and strong top-line growth. Yet, its declining ROIC signals eroding capital efficiency. New product launches in AI and data centers could revive its moat in 2026.
Onto Innovation Inc. (ONTO): Niche Process Control Expertise
ONTO’s moat lies in specialized process control tools with high switching costs for customers. Unlike AMD’s scale advantage, ONTO delivers superior margin expansion and a rising ROIC trend. Expansion into emerging semiconductor markets may deepen its competitive edge.
Scale Dominance vs. Specialized Precision: The Moat Verdict
AMD dominates in scale and innovation breadth but suffers a deteriorating ROIC, indicating weakening moat durability. ONTO’s narrower moat is more financially sound, with improving capital returns. I see ONTO better positioned to defend and grow its market share in the near term.
Which stock offers better returns?
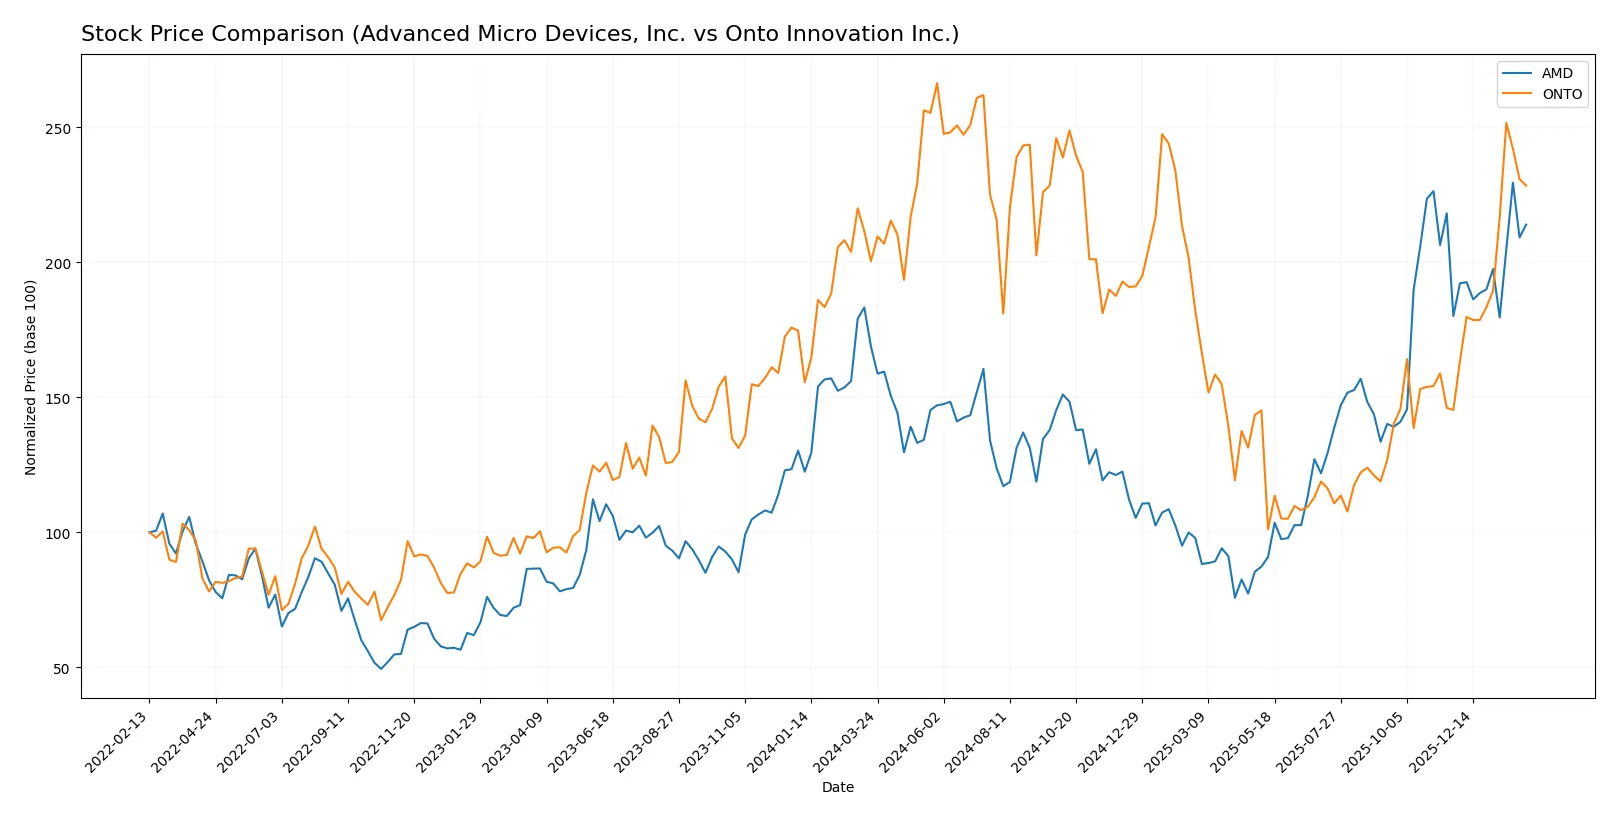
The past year showed strong upward moves for both stocks, with Advanced Micro Devices gaining steady momentum and Onto Innovation accelerating sharply in recent months.
Trend Comparison
Advanced Micro Devices, Inc. posted a 26.72% price increase over the last 12 months, reflecting a bullish trend with acceleration and a notable high at 259.68. Onto Innovation Inc. gained 13.97% over the same period, also bullish with acceleration, peaking at 233.14. Onto’s recent surge of 57.21% contrasts with AMD’s steadier 18.81% rise in the last few months. Comparing both, AMD delivered the highest market performance over the full year, despite Onto’s recent sharper gains.
Target Prices
Analysts present a constructive target consensus for Advanced Micro Devices and Onto Innovation.
| Company | Target Low | Target High | Consensus |
|---|---|---|---|
| Advanced Micro Devices, Inc. | 225 | 380 | 291.56 |
| Onto Innovation Inc. | 160 | 260 | 191.67 |
The target consensus for AMD implies a 20% upside from its current 242 price, reflecting strong sector momentum. Onto Innovation’s consensus suggests a modest 4% upside, signaling cautious optimism in its niche.

Don’t Let Luck Decide Your Entry Point
Optimize your entry points with our advanced ProRealTime indicators. You’ll get efficient buy signals with precise price targets for maximum performance. Start outperforming now!
How do institutions grade them?
Advanced Micro Devices, Inc. Grades
The table below shows recent grades assigned to Advanced Micro Devices, Inc. by major grading companies.
| Grading Company | Action | New Grade | Date |
|---|---|---|---|
| Wells Fargo | Maintain | Overweight | 2026-01-30 |
| Piper Sandler | Maintain | Overweight | 2026-01-26 |
| UBS | Maintain | Buy | 2026-01-26 |
| Bernstein | Maintain | Market Perform | 2026-01-21 |
| Keybanc | Upgrade | Overweight | 2026-01-13 |
| Truist Securities | Maintain | Buy | 2025-12-19 |
| Cantor Fitzgerald | Maintain | Overweight | 2025-12-16 |
| Morgan Stanley | Maintain | Equal Weight | 2025-11-12 |
| Wedbush | Maintain | Outperform | 2025-11-12 |
| Rosenblatt | Maintain | Buy | 2025-11-12 |
Onto Innovation Inc. Grades
This table presents recent institutional grades for Onto Innovation Inc. from reputable firms.
| Grading Company | Action | New Grade | Date |
|---|---|---|---|
| Needham | Maintain | Buy | 2026-01-20 |
| B. Riley Securities | Maintain | Buy | 2026-01-15 |
| Stifel | Maintain | Hold | 2026-01-14 |
| Needham | Maintain | Buy | 2026-01-06 |
| Jefferies | Maintain | Buy | 2025-12-15 |
| Needham | Maintain | Buy | 2025-11-18 |
| B. Riley Securities | Maintain | Buy | 2025-11-18 |
| Evercore ISI Group | Maintain | Outperform | 2025-11-05 |
| Oppenheimer | Maintain | Outperform | 2025-10-14 |
| Stifel | Maintain | Hold | 2025-10-13 |
Which company has the best grades?
Both companies receive predominantly positive grades, with multiple “Buy” and “Overweight” ratings. AMD’s grades show a mix including “Market Perform” and “Equal Weight,” while Onto Innovation has consistent “Buy” and “Outperform” ratings. Onto Innovation’s stronger consensus of buy ratings may appeal to investors seeking confirmed institutional confidence.
Risks specific to each company
The following categories identify the critical pressure points and systemic threats facing both firms in the 2026 market environment:
1. Market & Competition
Advanced Micro Devices, Inc. (AMD)
- Operates in a highly competitive semiconductor space with strong rivals like Intel and Nvidia. Market cap 394B indicates scale advantage but high valuation pressures (PE 80.54).
Onto Innovation Inc. (ONTO)
- Faces niche competition in process control tools with smaller market cap 10B. More specialized but less diversified product portfolio. Moderate PE 41.76 signals valuation risk.
2. Capital Structure & Debt
Advanced Micro Devices, Inc. (AMD)
- Strong interest coverage (28.2) and favorable debt-to-equity metrics. However, weak liquidity ratios (current and quick ratios unfavorable) suggest potential short-term pressure.
Onto Innovation Inc. (ONTO)
- Very low debt (D/E 0.01) and excellent interest coverage (infinite). Liquidity strong with high current ratio (8.69) and quick ratio (7.0), indicating sound short-term financial health.
3. Stock Volatility
Advanced Micro Devices, Inc. (AMD)
- High beta (1.95) reflects significant stock price volatility and sensitivity to market swings, increasing investment risk.
Onto Innovation Inc. (ONTO)
- Lower beta (1.48) compared to AMD, indicating relatively less volatility but still above market average, suggesting moderate risk exposure.
4. Regulatory & Legal
Advanced Micro Devices, Inc. (AMD)
- Subject to global semiconductor trade regulations, export controls, and antitrust scrutiny, which could impact supply and market access.
Onto Innovation Inc. (ONTO)
- Faces regulatory risks tied to process control technologies and manufacturing standards, with less geopolitical complexity due to smaller global footprint.
5. Supply Chain & Operations
Advanced Micro Devices, Inc. (AMD)
- Relies heavily on complex global semiconductor supply chains vulnerable to geopolitical tensions and component shortages.
Onto Innovation Inc. (ONTO)
- Operates in advanced manufacturing equipment space with dependence on component suppliers but less exposed to mass-market supply chain shocks.
6. ESG & Climate Transition
Advanced Micro Devices, Inc. (AMD)
- Faces pressure to improve energy efficiency in chip production and reduce carbon footprint within a highly scrutinized tech sector.
Onto Innovation Inc. (ONTO)
- ESG commitments less publicized, with potential risks related to environmental impact of manufacturing equipment but lower overall exposure.
7. Geopolitical Exposure
Advanced Micro Devices, Inc. (AMD)
- High exposure to US-China trade tensions and export restrictions impacting sales and supply chains globally.
Onto Innovation Inc. (ONTO)
- Limited direct geopolitical exposure due to smaller global scale, but still affected by US regulatory environment and global semiconductor market dynamics.
Which company shows a better risk-adjusted profile?
AMD’s most impactful risk is its high stock volatility combined with elevated valuation metrics, creating significant market sensitivity. Onto Innovation’s primary risk lies in its niche market focus and slightly elevated valuation multiples. Onto’s stronger balance sheet and liquidity position offer a safer financial profile. Overall, Onto Innovation presents a better risk-adjusted profile supported by its strong liquidity, low debt, and moderate volatility, while AMD’s valuation and market risks demand greater caution.
Final Verdict: Which stock to choose?
Advanced Micro Devices (AMD) shines as a technology powerhouse with unmatched revenue growth and a robust innovation engine. Its main point of vigilance lies in a declining return on invested capital, signaling efficiency challenges ahead. AMD suits aggressive growth portfolios willing to tolerate operational headwinds for scale and market disruption.
Onto Innovation (ONTO) offers a strategic moat through steady profitability and improving capital returns. Its strong balance sheet and rising operating efficiency provide a safer harbor compared to AMD’s volatility. ONTO fits well in GARP portfolios seeking growth with a measured approach to financial stability and value creation.
If you prioritize rapid expansion and market leadership, AMD is the compelling choice due to its superior top-line momentum despite some operational strain. However, if you seek a blend of growth and financial resilience, ONTO offers better stability and improving profitability, commanding a premium for risk-conscious investors.
Disclaimer: Investment carries a risk of loss of initial capital. The past performance is not a reliable indicator of future results. Be sure to understand risks before making an investment decision.
Go Further
I encourage you to read the complete analyses of Advanced Micro Devices, Inc. and Onto Innovation Inc. to enhance your investment decisions: