Home > Comparison > Technology > AMD vs ON
The strategic rivalry between Advanced Micro Devices, Inc. (AMD) and ON Semiconductor Corporation shapes the semiconductor industry’s evolution. AMD excels as a high-performance computing and graphics innovator, while ON Semiconductor focuses on power solutions and intelligent sensing for automotive and industrial applications. This head-to-head reflects a contrast between cutting-edge processor design and specialized analog technology. This analysis determines which company’s trajectory offers superior risk-adjusted returns for a diversified portfolio in 2026.
Table of contents
Companies Overview
Advanced Micro Devices and ON Semiconductor both play critical roles in the global semiconductor industry, shaping technology’s future.
Advanced Micro Devices, Inc.: Leader in High-Performance Computing Chips
Advanced Micro Devices dominates the semiconductor space with high-performance processors and GPUs powering personal computers, data centers, and gaming consoles. Its revenue engine centers on x86 microprocessors and discrete graphics units. In 2026, AMD sharpened its strategic focus on expanding data center and gaming market share through innovation in accelerated processing units and server chips.
ON Semiconductor Corporation: Pioneer in Intelligent Sensing and Power Solutions
ON Semiconductor leads in intelligent power technologies that drive automotive electrification and sustainable energy systems. It generates revenue through analog and mixed-signal semiconductors aimed at power conversion and sensing applications. The firm’s 2026 strategy emphasizes advancing electric vehicle components and renewable energy integration with a diversified product mix across power, sensing, and logic segments.
Strategic Collision: Similarities & Divergences
AMD pursues a compute-centric, high-performance approach, while ON Semiconductor targets power-efficient, sensing-driven solutions. Their rivalry centers on markets demanding semiconductor innovation, yet their end markets differ—AMD thrives in computing and graphics, ON in automotive and industrial sectors. This contrast defines distinct investment profiles: AMD bets on growth cycles in cloud and gaming, ON on electrification and sustainability trends.
Income Statement Comparison
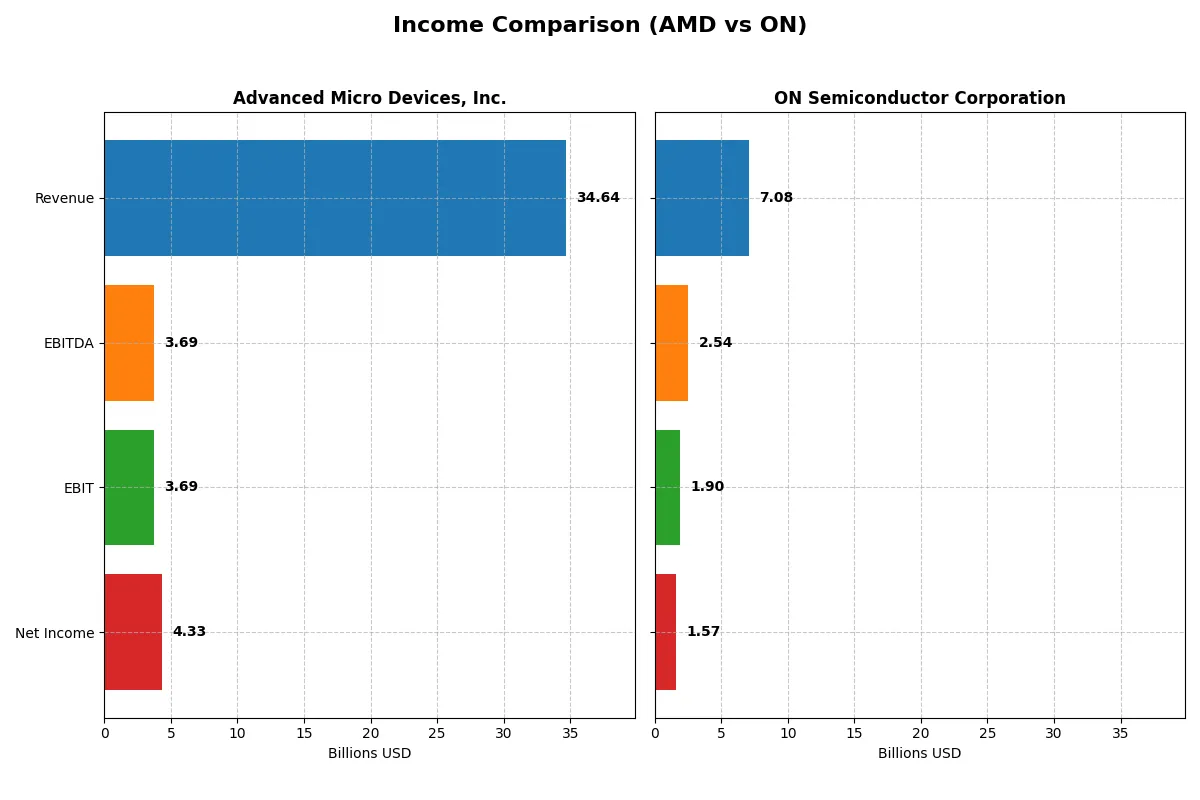
This data dissects the core profitability and scalability of both corporate engines to reveal who dominates the bottom line:
| Metric | Advanced Micro Devices, Inc. (AMD) | ON Semiconductor Corporation (ON) |
|---|---|---|
| Revenue | 34.6B | 7.08B |
| Cost of Revenue | 17.5B | 3.87B |
| Operating Expenses | 13.5B | 1.45B |
| Gross Profit | 17.2B | 3.22B |
| EBITDA | 3.69B | 2.54B |
| EBIT | 3.69B | 1.90B |
| Interest Expense | 131M | 62.3M |
| Net Income | 4.34B | 1.57B |
| EPS | 2.67 | 3.68 |
| Fiscal Year | 2025 | 2024 |
Income Statement Analysis: The Bottom-Line Duel
This income statement comparison reveals which company converts revenue into profit most efficiently and sustainably.
Advanced Micro Devices, Inc. Analysis
AMD demonstrates a strong upward trajectory, with revenue surging from 16.4B in 2021 to 34.6B in 2025. Its net income more than doubled, reaching 4.3B in 2025. AMD’s gross margin holds firm at 49.5%, while its net margin improves to 12.5%, signaling enhanced operational efficiency and robust profitability momentum in the latest year.
ON Semiconductor Corporation Analysis
ON Semiconductor’s revenue grew from 5.3B in 2020 to a peak of 8.3B in 2022 but declined to 7.1B in 2024. Its net income followed a similar pattern, peaking near 2.2B in 2023 before falling to 1.6B in 2024. Despite recent declines, ON maintains a strong net margin of 22.2% and a superior EBIT margin of 26.8%, reflecting disciplined cost control and margin strength.
Growth Surge vs. Margin Strength
AMD clearly leads in revenue growth and net income scale, doubling its top line and nearly tripling net profit over five years. ON excels in margin quality, delivering higher profitability ratios despite recent revenue setbacks. For growth-oriented investors, AMD’s expanding top line and improving margins offer more dynamic potential. ON’s profile suits those valuing consistent margin power amid cyclical challenges.
Financial Ratios Comparison
These vital ratios act as a diagnostic tool to expose the underlying fiscal health, valuation premiums, and capital efficiency of the companies analyzed:
| Ratios | Advanced Micro Devices, Inc. (AMD) | ON Semiconductor Corporation (ON) |
|---|---|---|
| ROE | 2.85% (2024) | 17.88% (2024) |
| ROIC | 2.49% (2024) | 11.88% (2024) |
| P/E | 124x (2024) | 17.13x (2024) |
| P/B | 3.52x (2024) | 3.06x (2024) |
| Current Ratio | 2.62 (2024) | 5.06 (2024) |
| Quick Ratio | 1.83 (2024) | 3.38 (2024) |
| D/E | 0.04 (2024) | 0.38 (2024) |
| Debt-to-Assets | 3.20% (2024) | 23.90% (2024) |
| Interest Coverage | 20.7 (2024) | 28.4 (2024) |
| Asset Turnover | 0.37 (2024) | 0.50 (2024) |
| Fixed Asset Turnover | 10.63 (2024) | 1.61 (2024) |
| Payout ratio | 0% (2024) | 0% (2024) |
| Dividend yield | 0% (2024) | 0% (2024) |
| Fiscal Year | 2024 | 2024 |
Efficiency & Valuation Duel: The Vital Signs
Ratios act as a company’s DNA, uncovering hidden risks and operational strengths that shape investor decisions.
Advanced Micro Devices, Inc.
AMD’s net margin of 12.51% shows decent profitability, but its ROE and ROIC at 0% signal weak capital efficiency. The P/E ratio at 80.54 flags the stock as expensive and stretched. AMD returns no dividend, focusing heavily on R&D with 25% of revenue reinvested to fuel innovation and growth.
ON Semiconductor Corporation
ON posts a robust net margin of 22.21% and a solid ROE of 17.88%, demonstrating efficient capital use. Its P/E ratio of 17.13 suggests a fair valuation, neither cheap nor expensive. ON offers no dividend but balances growth with prudent capital allocation, maintaining favorable debt ratios and operational efficiency.
Premium Valuation vs. Operational Safety
AMD’s sky-high valuation contrasts with weak returns on equity and capital, elevating risk despite innovation focus. ON delivers a healthier balance of profitability and valuation, offering a more stable risk-reward profile. Investors seeking operational efficiency might prefer ON’s steadier metrics, while growth-focused profiles may tolerate AMD’s stretched valuation.
Which one offers the Superior Shareholder Reward?
I observe that neither AMD nor ON Semiconductor pays dividends, focusing instead on reinvestment and buybacks. AMD’s payout ratio is zero, with a strong free cash flow per share of 3.4, supporting sustainable buybacks. ON posts a free cash flow per share of 2.8 but exhibits higher debt levels, which could constrain buyback capacity. ON’s operating margin (around 25%) outpaces AMD’s (~10%), suggesting better cash generation efficiency. However, AMD’s aggressive reinvestment in R&D fuels growth, while ON prioritizes steady cash returns via buybacks despite leverage. I conclude AMD offers a more attractive total return profile in 2026 due to its robust free cash flow, lower leverage, and growth-driven capital allocation.
Comparative Score Analysis: The Strategic Profile
The radar chart reveals the fundamental DNA and trade-offs of Advanced Micro Devices, Inc. and ON Semiconductor Corporation:
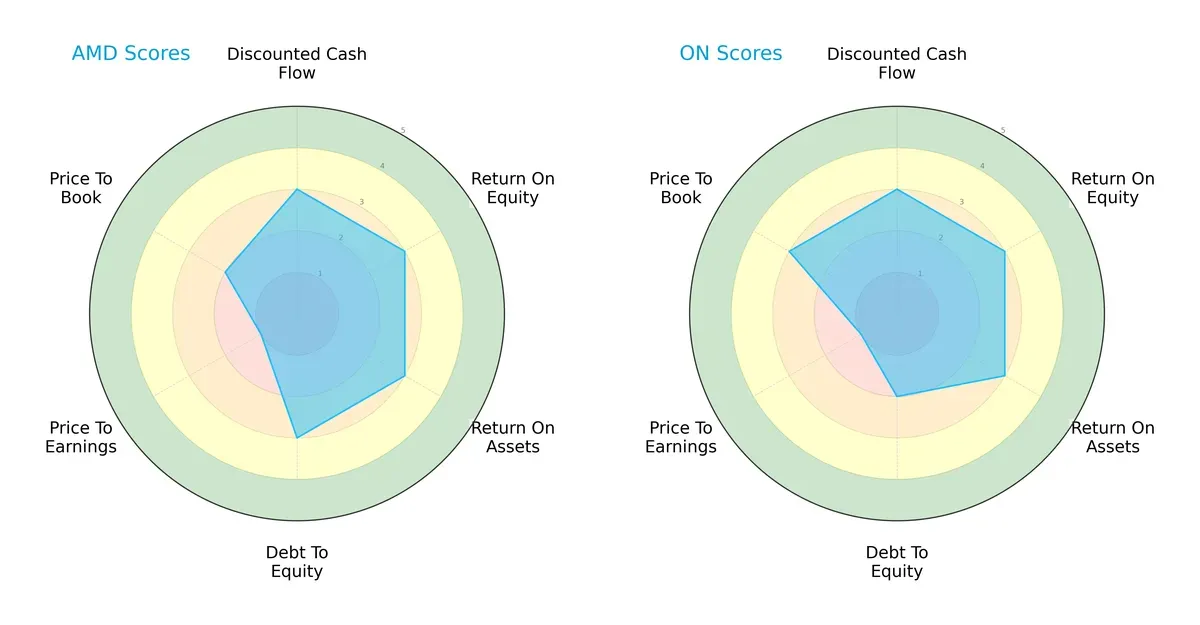
Both firms share a balanced profile with moderate scores in DCF, ROE, and ROA, signaling consistent operational efficiency. AMD leads slightly in debt management with a stronger Debt/Equity score (3 vs. 2), reflecting a more robust balance sheet. ON shows an edge in Price-to-Book valuation (3 vs. 2), hinting at better market bargain potential. However, both struggle with Price-to-Earnings, scoring very unfavorably at 1, indicating valuation concerns. Overall, AMD appears more balanced, while ON leans on valuation metrics.
Bankruptcy Risk: Solvency Showdown
AMD’s Altman Z-Score of 18.0 far exceeds ON’s 4.8, indicating superior long-term financial safety in this cycle:
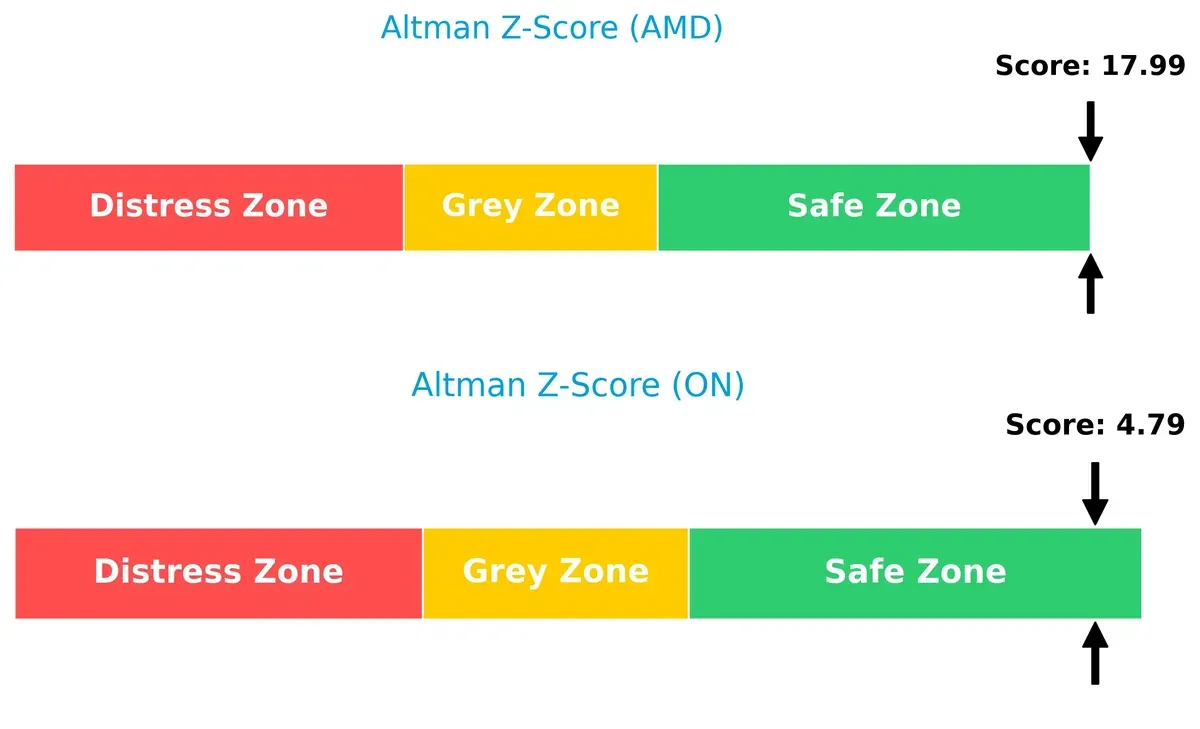
AMD’s score places it deep into the safe zone, reflecting strong solvency and low bankruptcy risk. ON, while also in the safe zone, is closer to the grey area, suggesting relatively higher vulnerability during economic stress.
Financial Health: Quality of Operations
AMD’s Piotroski F-Score of 7 surpasses ON’s score of 6, signaling stronger internal financial health and operational quality:
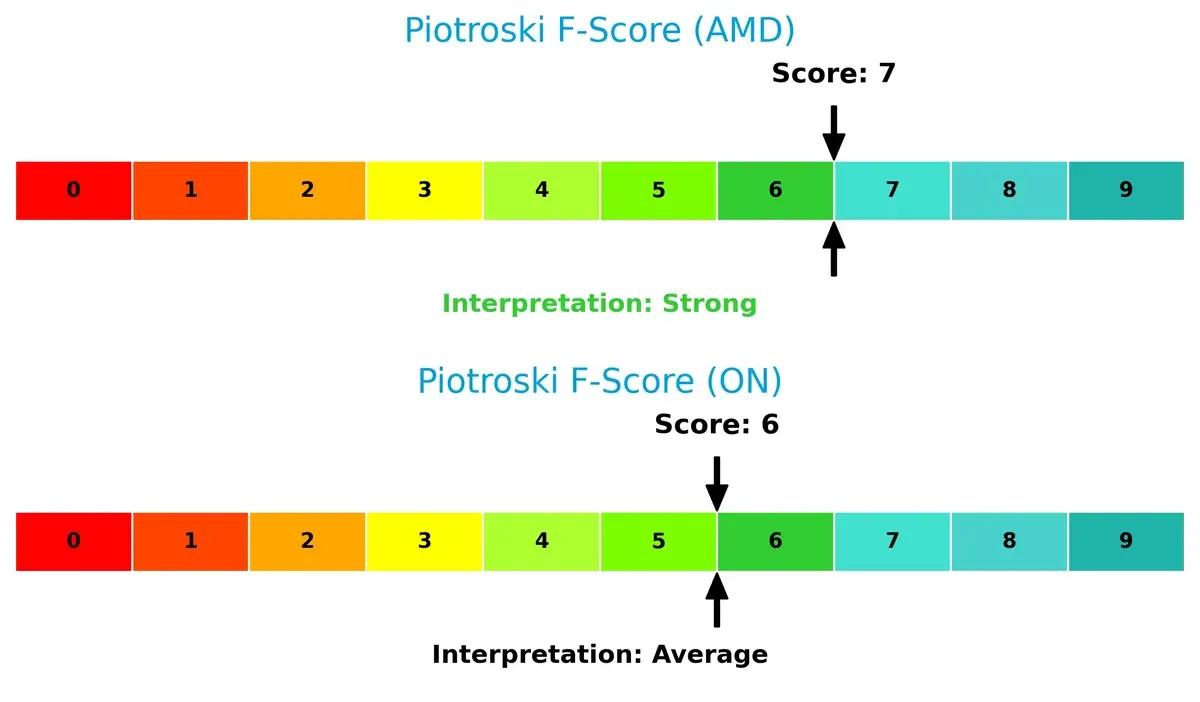
AMD demonstrates more consistent profitability, liquidity, and efficiency metrics. ON’s slightly lower score may hint at emerging red flags in internal financial controls or capital allocation, warranting closer monitoring.
How are the two companies positioned?
This section dissects AMD and ON Semiconductor’s operational DNA by comparing revenue distribution and internal strengths and weaknesses. The goal is to confront their economic moats to determine which model offers the most resilient competitive advantage today.
Revenue Segmentation: The Strategic Mix
This visual comparison dissects how Advanced Micro Devices, Inc. and ON Semiconductor Corporation diversify their income streams and where their primary sector bets lie:
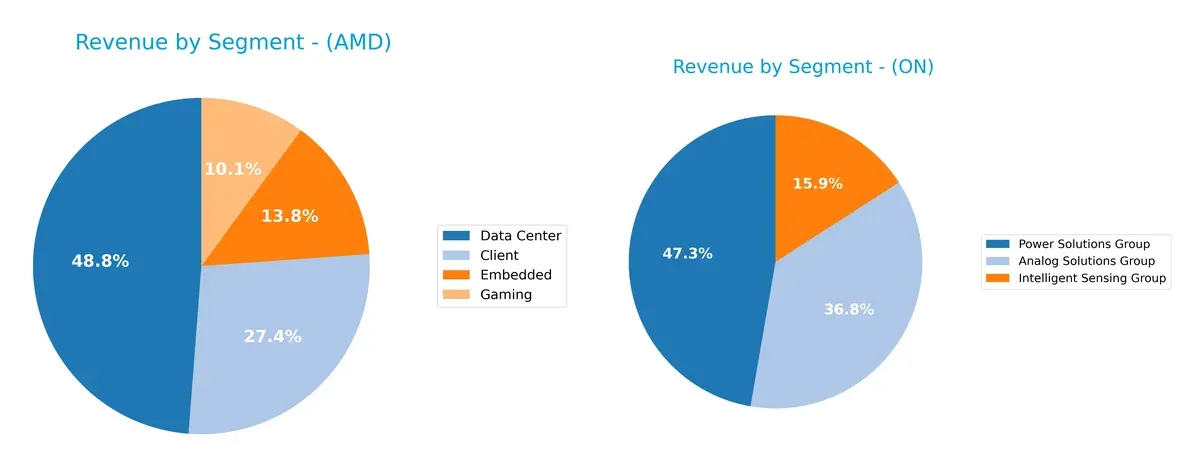
Advanced Micro Devices anchors revenue in Data Center at $12.6B, complemented by Client at $7.1B and Embedded at $3.6B, showing a balanced yet tech-focused portfolio. ON Semiconductor pivots on Power Solutions Group with $3.3B, while Analog Solutions Group and Intelligent Sensing Group contribute $2.6B and $1.1B, respectively. AMD’s mix suggests a strategic bet on cloud infrastructure and gaming ecosystems. ON’s reliance on power solutions signals strength but exposes moderate concentration risk.
Strengths and Weaknesses Comparison
This table compares the strengths and weaknesses of AMD and ON Semiconductor across key financial and market metrics:
AMD Strengths
- Strong global presence with $8.7B US and $6.2B China sales
- Diversified segments including Client and Data Center
- Favorable net margin at 12.5%
- Low debt-to-assets ratio and strong interest coverage
ON Strengths
- Higher net margin at 22.2% and strong ROE at 17.9%
- Diversified revenue across Power and Analog Solutions
- Favorable quick ratio and manageable debt levels
- Solid interest coverage ratio of 30.5
AMD Weaknesses
- Unfavorable ROIC vs. WACC indicating weak capital returns
- High P/E at 80.5 signals overvaluation concerns
- Poor liquidity ratios (current and quick)
- Low asset turnover impacting efficiency
ON Weaknesses
- Unfavorable current ratio despite favorable quick ratio
- WACC above ROIC suggests cost of capital risk
- Unfavorable price-to-book ratio at 3.06
- Dividend yield at zero may deter income investors
Overall, ON Semiconductor shows superior profitability and capital efficiency metrics compared to AMD, which struggles with returns and liquidity. However, AMD’s larger scale and global footprint provide diversification benefits that are critical in volatile markets. Each company’s financial strengths and weaknesses pose distinct strategic challenges.
The Moat Duel: Analyzing Competitive Defensibility
A structural moat alone protects a company’s long-term profits from competitive erosion and market pressures. Let’s dissect the moats of two semiconductor players:
Advanced Micro Devices, Inc. (AMD): Innovation-Driven Market Penetration
AMD leverages cutting-edge chip design and brand strength, reflected in high gross margins (49.5%) but declining ROIC trends. Its expanding data center and gaming markets could deepen its moat, yet profitability erosion remains a concern in 2026.
ON Semiconductor Corporation (ON): Operational Efficiency and Niche Focus
ON’s moat centers on power management expertise and analog semiconductor specialization, yielding superior EBIT margins (26.8%) and a growing ROIC trajectory. Unlike AMD, ON’s focus on electrification and automotive sectors positions it for gradual moat expansion despite recent revenue declines.
Verdict: Innovation Scale vs. Operational Strength
AMD’s technological innovation offers a broader moat but shows signs of value destruction with declining ROIC. ON’s steadily improving profitability and niche specialization create a narrower yet deepening moat. I believe ON is currently better equipped to defend market share with operational discipline and focused growth.
Which stock offers better returns?
The past year reveals contrasting trajectories: AMD surged notably with accelerating gains, while ON Semiconductor faced a pronounced decline despite recent recovery signs.
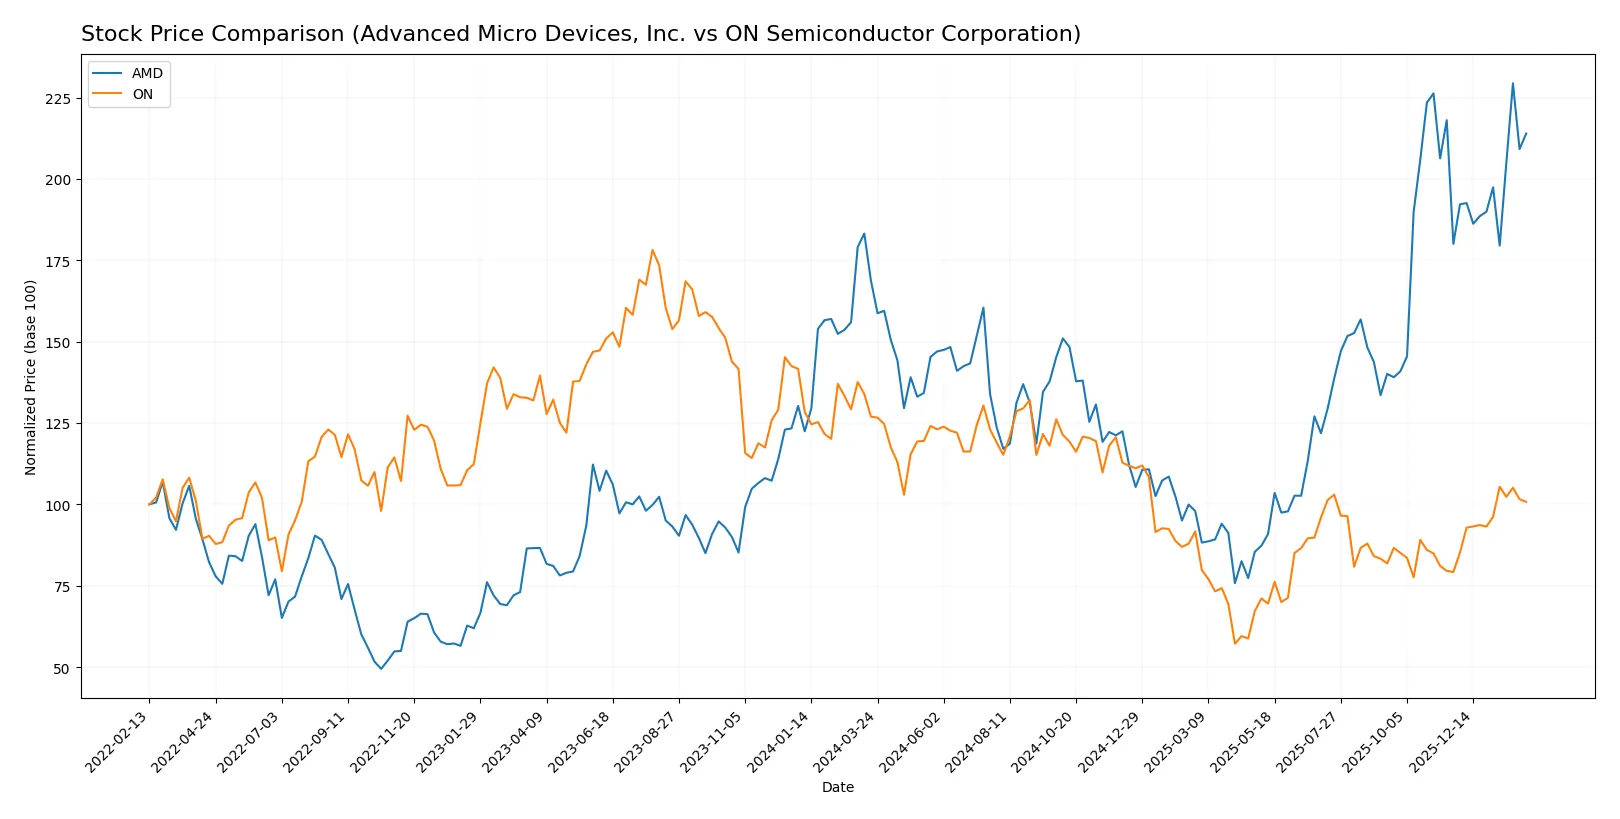
Trend Comparison
AMD’s stock posted a strong 26.72% gain over the past 12 months, marking a bullish trend with accelerating momentum and high volatility between $85.76 and $259.68.
ON Semiconductor’s stock declined 20.62% in the same period, reflecting a bearish trend but showed recent acceleration with a 27.26% gain over the last two months.
AMD outperformed ON Semiconductor over the full year, delivering the highest market returns despite ON’s recent positive reversal.
Target Prices
Analysts present a cautiously optimistic consensus on these semiconductor leaders.
| Company | Target Low | Target High | Consensus |
|---|---|---|---|
| Advanced Micro Devices, Inc. | 225 | 380 | 291.56 |
| ON Semiconductor Corporation | 51 | 64 | 59.25 |
The consensus target prices for AMD and ON exceed current prices, signaling expected growth. AMD’s target consensus at 291.56 surpasses its 242.11 price, while ON’s 59.25 target aligns closely with its 59.43 price.

Don’t Let Luck Decide Your Entry Point
Optimize your entry points with our advanced ProRealTime indicators. You’ll get efficient buy signals with precise price targets for maximum performance. Start outperforming now!
How do institutions grade them?
Advanced Micro Devices, Inc. Grades
The following table summarizes recent grades issued by reputable institutions for AMD:
| Grading Company | Action | New Grade | Date |
|---|---|---|---|
| Wells Fargo | maintain | Overweight | 2026-01-30 |
| Piper Sandler | maintain | Overweight | 2026-01-26 |
| UBS | maintain | Buy | 2026-01-26 |
| Bernstein | maintain | Market Perform | 2026-01-21 |
| Keybanc | upgrade | Overweight | 2026-01-13 |
| Truist Securities | maintain | Buy | 2025-12-19 |
| Cantor Fitzgerald | maintain | Overweight | 2025-12-16 |
| Morgan Stanley | maintain | Equal Weight | 2025-11-12 |
| Wedbush | maintain | Outperform | 2025-11-12 |
| Rosenblatt | maintain | Buy | 2025-11-12 |
ON Semiconductor Corporation Grades
The following table summarizes recent grades issued by reputable institutions for ON Semiconductor:
| Grading Company | Action | New Grade | Date |
|---|---|---|---|
| B of A Securities | maintain | Neutral | 2026-01-21 |
| B. Riley Securities | maintain | Neutral | 2026-01-20 |
| Stifel | maintain | Hold | 2026-01-16 |
| Citigroup | maintain | Neutral | 2026-01-15 |
| Wells Fargo | maintain | Overweight | 2026-01-15 |
| Piper Sandler | maintain | Overweight | 2026-01-07 |
| Truist Securities | maintain | Hold | 2025-12-19 |
| Morgan Stanley | maintain | Equal Weight | 2025-11-24 |
| Truist Securities | maintain | Hold | 2025-11-04 |
| Morgan Stanley | maintain | Equal Weight | 2025-11-04 |
Which company has the best grades?
Advanced Micro Devices, Inc. holds generally stronger and more consistent buy and overweight ratings. ON Semiconductor’s grades lean toward neutral and hold, indicating a more cautious outlook. This difference affects investor sentiment and risk assessment for each stock.
Risks specific to each company
The following categories identify the critical pressure points and systemic threats facing both firms in the 2026 market environment:
1. Market & Competition
Advanced Micro Devices, Inc. (AMD)
- Faces intense competition from large players in CPUs and GPUs, pressuring margins.
ON Semiconductor Corporation (ON)
- Competes in specialized power and sensing markets with rising demand but also niche rivals.
2. Capital Structure & Debt
AMD
- Maintains favorable debt-to-equity and interest coverage ratios, indicating manageable leverage.
ON
- Holds moderate debt levels with strong interest coverage, showing prudent capital structure.
3. Stock Volatility
AMD
- Exhibits high beta (1.95), reflecting significant stock price volatility relative to the market.
ON
- Has lower beta (1.54), implying comparatively less sensitivity to market swings.
4. Regulatory & Legal
AMD
- Subject to global tech regulations and export controls impacting semiconductor sales.
ON
- Faces regulatory scrutiny related to automotive and industrial electronics compliance.
5. Supply Chain & Operations
AMD
- Dependent on complex foundry networks; supply chain disruptions can impact product availability.
ON
- Relies on diverse suppliers but benefits from integration in automotive supply chains.
6. ESG & Climate Transition
AMD
- Increasing pressure to reduce carbon footprint in chip manufacturing processes.
ON
- Positioned to benefit from electrification trends but must manage sustainability in production.
7. Geopolitical Exposure
AMD
- Vulnerable to US-China tensions affecting semiconductor trade policies.
ON
- Also exposed to geopolitical risks but with a more diversified end-market base.
Which company shows a better risk-adjusted profile?
ON Semiconductor’s stronger profitability metrics and moderate leverage offer a better risk-adjusted profile. AMD’s higher stock volatility and unfavorable valuation multiples heighten investor risk. ON’s Piotroski score of 6 versus AMD’s 7 indicates slightly lower financial strength but still respectable. The most impactful risk for AMD lies in market competition and valuation stretch, while ON faces critical exposure in regulatory and supply chain dynamics. Recent data show ON’s more balanced capital structure and lower beta mitigate some market uncertainties, justifying my cautious preference for ON on a risk basis.
Final Verdict: Which stock to choose?
Advanced Micro Devices, Inc. (AMD) excels as a rapid innovator, driving robust revenue growth through aggressive R&D investments. Its superpower lies in capturing market share with cutting-edge technology. However, its declining ROIC signals a caution point for long-term value creation. AMD fits an aggressive growth portfolio willing to weather volatility.
ON Semiconductor Corporation (ON) presents a strategic moat rooted in improving profitability and efficient capital use. Its steady ROIC growth and strong income quality offer a safer profile than AMD. ON aligns with a GARP investor seeking reasonable valuation combined with earnings stability amidst market fluctuations.
If you prioritize dynamic innovation and market disruption, AMD is the compelling choice due to its superior growth trajectory despite value erosion risks. However, if you seek stable profitability with improving capital efficiency, ON offers better stability and a growing moat, appealing to risk-conscious growth investors.
Disclaimer: Investment carries a risk of loss of initial capital. The past performance is not a reliable indicator of future results. Be sure to understand risks before making an investment decision.
Go Further
I encourage you to read the complete analyses of Advanced Micro Devices, Inc. and ON Semiconductor Corporation to enhance your investment decisions: