Home > Comparison > Technology > AMD vs NXPI
The strategic rivalry between Advanced Micro Devices, Inc. (AMD) and NXP Semiconductors N.V. shapes the semiconductor industry’s evolution. AMD is a high-performance computing and graphics chipmaker focused on data centers and gaming, while NXP specializes in automotive and IoT semiconductor solutions. This analysis dissects their contrasting operational models to identify which company offers a superior risk-adjusted return, guiding investors seeking durable leadership in technology’s most critical sector.
Table of contents
Companies Overview
Advanced Micro Devices and NXP Semiconductors are pivotal players shaping the semiconductor landscape in 2026.
Advanced Micro Devices, Inc.: Computing Power Innovator
Advanced Micro Devices dominates semiconductor innovation with a focus on high-performance computing and graphics. Its core revenue comes from x86 microprocessors, GPUs, and semi-custom SoC products powering PCs, data centers, and game consoles. In 2026, AMD emphasizes expanding data center GPUs and enhancing integrated CPU-GPU solutions to capture growing cloud and gaming markets.
NXP Semiconductors N.V.: Connectivity and Sensor Specialist
NXP Semiconductors leads in semiconductor solutions for automotive, industrial IoT, and mobile sectors with a diverse product portfolio of microcontrollers, application processors, and wireless connectivity chips. Its revenue hinges on serving original equipment manufacturers globally. The company’s 2026 strategy centers on expanding secure connectivity and sensor technologies amid rising demand for smart, connected devices.
Strategic Collision: Similarities & Divergences
AMD and NXP both excel in semiconductors but pursue distinct philosophies: AMD drives high-performance, integrated computing platforms, while NXP prioritizes specialized connectivity and sensor ecosystems. They compete chiefly in edge computing and IoT device markets, where performance and integration matter most. Their investment profiles diverge sharply—AMD rides growth in cloud and gaming, whereas NXP bets on industrial and automotive connectivity resilience.
Income Statement Comparison
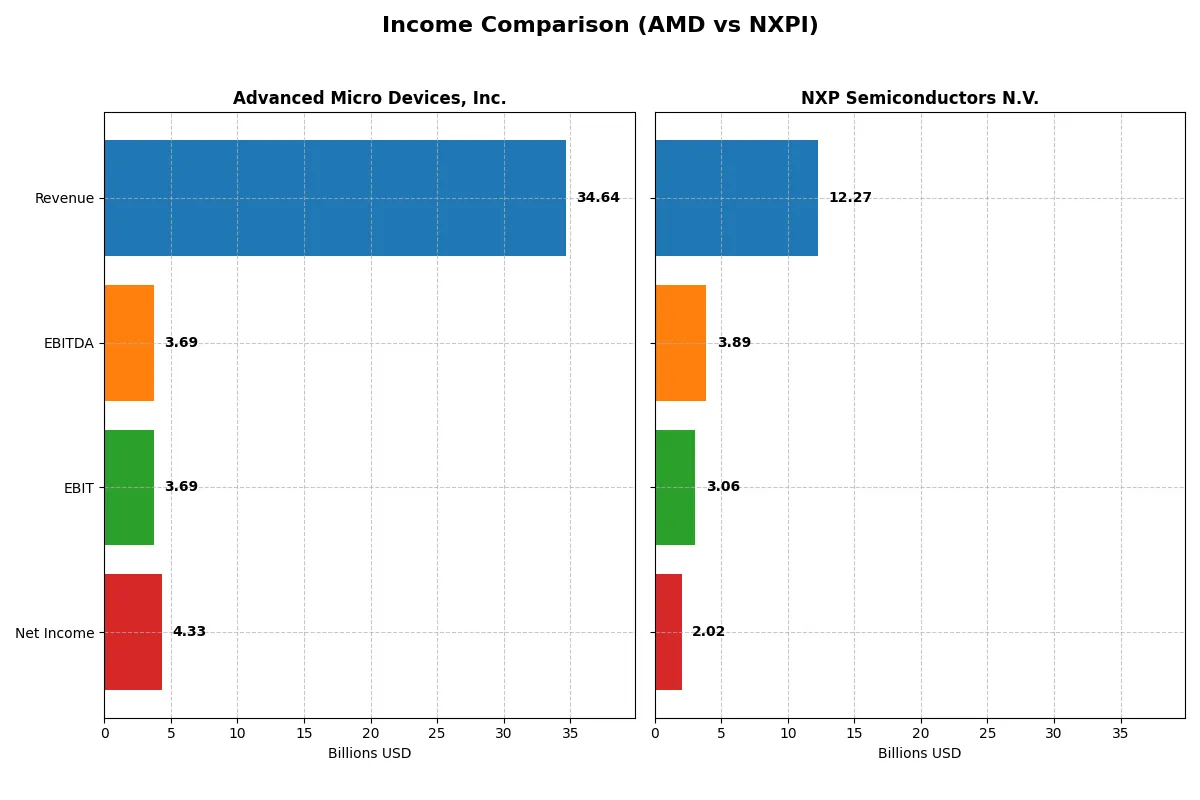
This data dissects the core profitability and scalability of both corporate engines to reveal who dominates the bottom line:
| Metric | Advanced Micro Devices, Inc. (AMD) | NXP Semiconductors N.V. (NXPI) |
|---|---|---|
| Revenue | 34.6B | 12.3B |
| Cost of Revenue | 17.5B | 5.6B |
| Operating Expenses | 13.5B | 3.4B |
| Gross Profit | 17.2B | 6.7B |
| EBITDA | 3.7B | 3.9B |
| EBIT | 3.7B | 3.1B |
| Interest Expense | 131M | 384M |
| Net Income | 4.3B | 2.0B |
| EPS | 2.67 | 8.00 |
| Fiscal Year | 2025 | 2025 |
Income Statement Analysis: The Bottom-Line Duel
This income statement comparison uncovers which company operates more efficiently and translates sales into profit most effectively.
Advanced Micro Devices, Inc. Analysis
AMD’s revenue surged from 16.4B in 2021 to 34.6B in 2025, nearly doubling over five years. Net income grew steadily, reaching 4.3B in 2025. Its gross margin holds strong near 49.5%, while net margin improved to 12.5%, reflecting efficient cost control and robust earnings momentum in the latest fiscal year.
NXP Semiconductors N.V. Analysis
NXP’s revenue climbed moderately from 11.1B in 2021 to 12.3B in 2025, showing slower growth. Net income advanced to 2.0B in 2025 but declined from prior years. The gross margin at 54.4% and net margin at 16.5% signal solid profitability, though recent declines in revenue and earnings growth suggest some operational headwinds.
Revenue Growth vs. Margin Strength
AMD outpaces NXP in revenue and net income growth, nearly doubling sales with a 34% one-year revenue jump and 97% net margin improvement. NXP boasts higher margins but suffers a 2.7% revenue contraction and profit declines last year. For investors seeking growth through expanding scale, AMD’s dynamic trajectory presents a more compelling profile than NXP’s margin-centric but slowing performance.
Financial Ratios Comparison
These vital ratios act as a diagnostic tool to expose the underlying fiscal health, valuation premiums, and capital efficiency of the companies compared below:
| Ratios | Advanced Micro Devices, Inc. (AMD) | NXP Semiconductors N.V. (NXPI) |
|---|---|---|
| ROE | 2.85% (2024) | 20.10% (2025) |
| ROIC | 2.49% (2024) | 11.03% (2025) |
| P/E | 124 (2024) | 27.14 (2025) |
| P/B | 3.52 (2024) | 5.45 (2025) |
| Current Ratio | 2.62 (2024) | 2.05 (2025) |
| Quick Ratio | 1.83 (2024) | 1.38 (2025) |
| D/E | 3.84% (2024) | 121.54% (2025) |
| Debt-to-Assets | 3.20% (2024) | 46.02% (2025) |
| Interest Coverage | 20.65 (2024) | 8.62 (2025) |
| Asset Turnover | 0.37 (2024) | 0.46 (2025) |
| Fixed Asset Turnover | 10.63 (2024) | 4.12 (2025) |
| Payout ratio | 0% (2024) | 50.72% (2025) |
| Dividend yield | 0% (2024) | 1.87% (2025) |
| Fiscal Year | 2024 | 2025 |
Efficiency & Valuation Duel: The Vital Signs
Ratios act as the company’s DNA, revealing hidden risks and operational excellence that raw financials alone cannot expose.
Advanced Micro Devices, Inc.
AMD displays a favorable net margin of 12.51% but suffers from zero return on equity and invested capital, indicating weak profitability. The stock trades at a stretched P/E of 80.54, suggesting high valuation risk. AMD offers no dividend, instead reinvesting heavily in R&D (25% of revenue), aiming for future growth.
NXP Semiconductors N.V.
NXP posts a stronger net margin of 16.47% and robust ROE of 20.1%, reflecting efficient capital use. Its P/E of 27.14 is elevated but more reasonable than AMD’s. NXP maintains a 1.87% dividend yield and healthy coverage ratios, balancing shareholder returns between income and growth investments.
Premium Valuation vs. Operational Safety
AMD’s valuation is significantly stretched, pairing limited profitability with aggressive growth reinvestment. NXP offers a better risk-reward balance with solid returns and dividend income. Growth-focused investors may tolerate AMD’s profile, while those seeking operational safety and income might prefer NXP.
Which one offers the Superior Shareholder Reward?
Advanced Micro Devices, Inc. (AMD) pays no dividends, focusing all free cash flow (3.4B in 2025) on aggressive R&D and growth, with no payout ratio and zero dividend yield. Its buyback program is minimal or absent, limiting direct shareholder cash returns. NXP Semiconductors N.V. (NXPI) pays a consistent dividend yield around 1.9% in 2025, with a payout ratio near 50%, reflecting a balanced distribution of profits. NXPI also executes substantial buybacks, complementing dividends with free cash flow of 9.6B, enhancing total returns. Historically in semiconductors, a mix of dividends and buybacks sustains shareholder value better than zero payouts. I see NXPI’s model as more sustainable and rewarding for 2026 investors seeking income plus growth. Therefore, NXPI offers the superior total shareholder reward.
Comparative Score Analysis: The Strategic Profile
The radar chart reveals the fundamental DNA and trade-offs of Advanced Micro Devices, Inc. and NXP Semiconductors N.V., highlighting their core financial strengths and vulnerabilities:
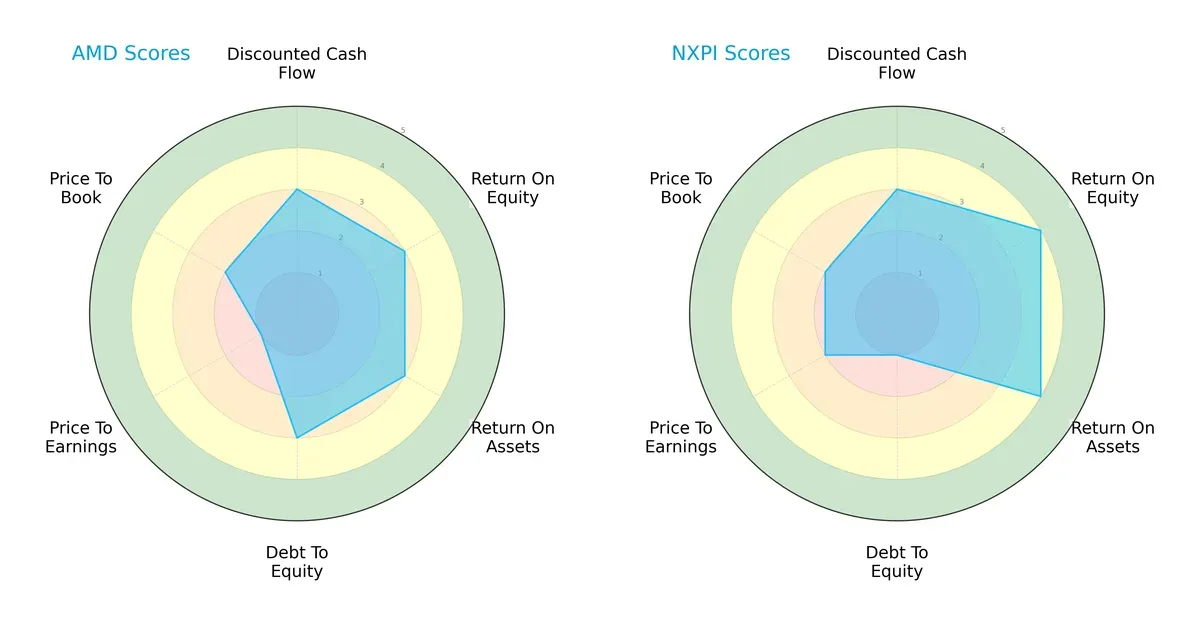
Both firms present a moderate overall score of 3, but NXP excels in profitability metrics with a ROE and ROA score of 4, outperforming AMD’s consistent score of 3. AMD shows a more balanced debt-to-equity profile with a score of 3 versus NXP’s weak 1, indicating NXP carries higher financial risk. Valuation-wise, both face moderate to unfavorable marks, with AMD’s P/E notably weaker at 1. NXP leverages a profitability edge, while AMD maintains steadier financial leverage.
—
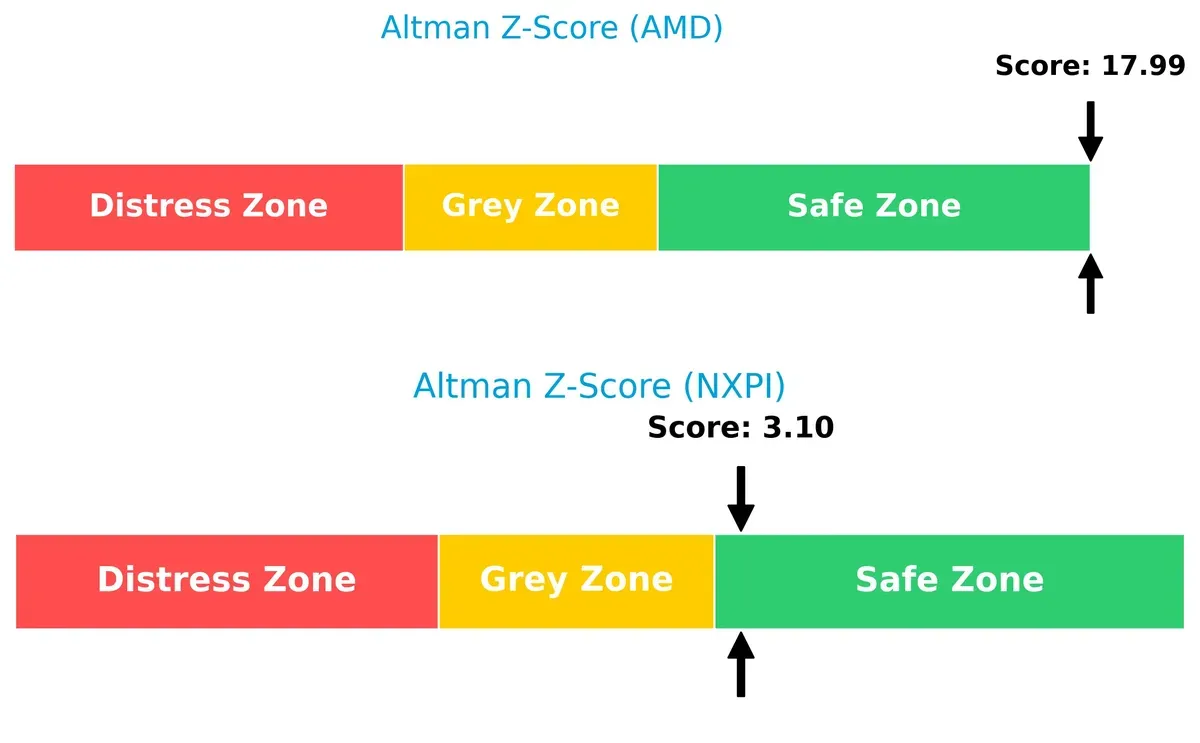
Bankruptcy Risk: Solvency Showdown
The Altman Z-Score gap between AMD (17.99) and NXP (3.10) indicates both companies reside in the safe zone, but AMD’s exceptionally high score signals a far stronger buffer against bankruptcy risk in this volatile market cycle:
—
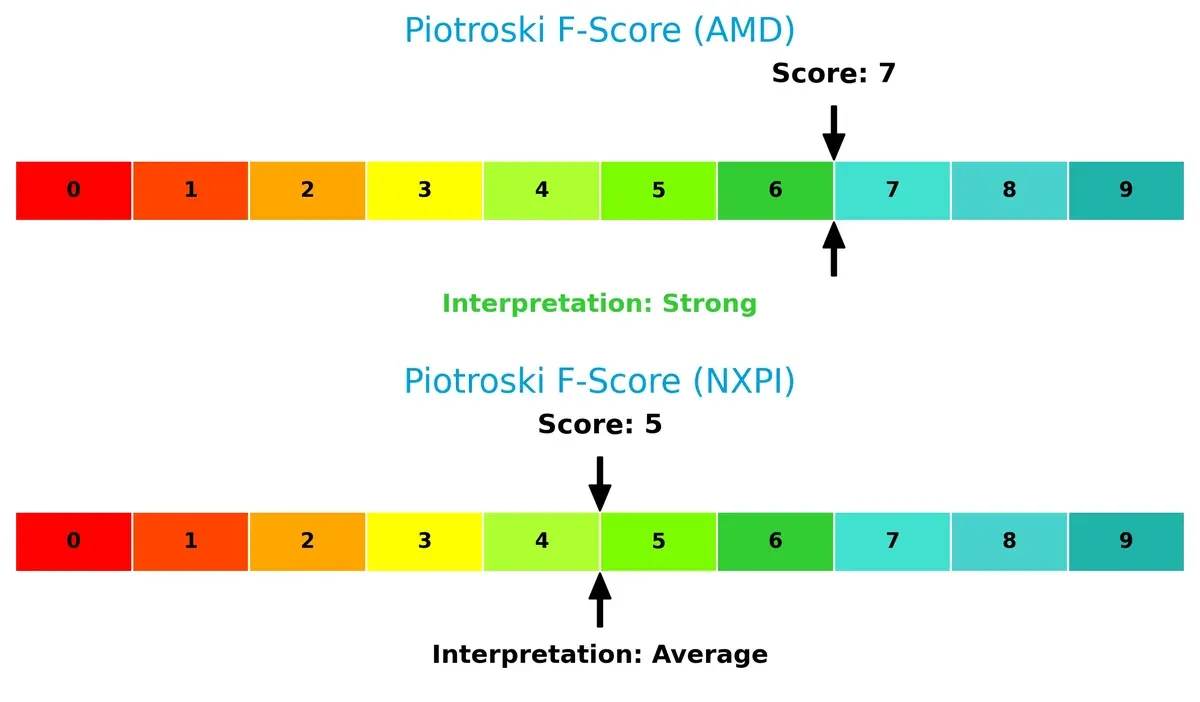
Financial Health: Quality of Operations
AMD’s Piotroski F-Score of 7 reflects strong financial health and robust internal operations, while NXP’s 5 suggests average stability with some red flags in operational efficiency and leverage ratios:
How are the two companies positioned?
This section dissects AMD and NXPI’s operational DNA by comparing their revenue distribution and internal dynamics. The goal is to confront their economic moats and identify which model offers the most resilient competitive advantage.
Revenue Segmentation: The Strategic Mix
This comparison dissects how Advanced Micro Devices and NXP Semiconductors diversify their income streams and where their primary sector bets lie:
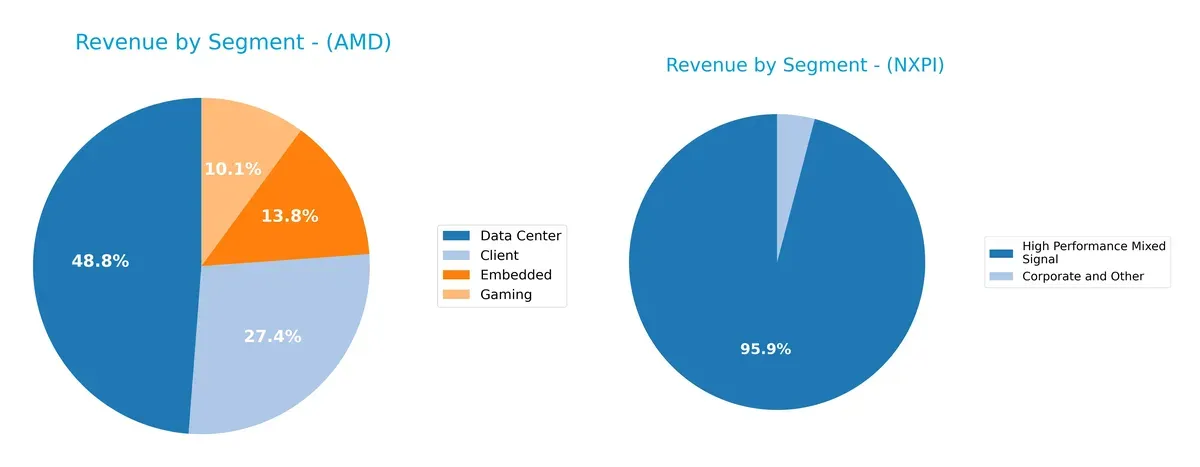
AMD’s 2024 revenue pivots around Data Center at $12.6B, with Client at $7.1B, Embedded $3.6B, and Gaming $2.6B. This mix shows solid diversification across high-growth and specialized markets. NXP leans heavily on High Performance Mixed Signal at $9.0B, dwarfing Corporate and Other at $385M. AMD’s broader segment spread reduces concentration risk, while NXP’s focus anchors it to mixed-signal dominance and automotive infrastructure exposure.
Strengths and Weaknesses Comparison
This table compares the Strengths and Weaknesses of AMD and NXPI based on diversification, profitability, financials, innovation, global reach, and market share:
AMD Strengths
- Diverse product segments including Client, Data Center, Embedded, Gaming
- Leading net margin at 12.51%
- Favorable debt-to-equity and interest coverage ratios
- Strong revenue from the United States and China
NXPI Strengths
- Higher net margin at 16.47% and solid ROE of 20.1%
- Favorable current and quick ratios indicate liquidity strength
- Robust fixed asset turnover at 4.12
- Well-diversified global sales across China, Europe, and USA
AMD Weaknesses
- Unfavorable ROIC below WACC at 12.94%
- High P/E of 80.54 suggests expensive valuation
- Poor liquidity with zero current and quick ratios
- Low asset turnover limits operational efficiency
NXPI Weaknesses
- Unfavorable P/B at 5.45 and elevated debt-to-equity of 1.22
- Moderate asset turnover at 0.46
- Slightly unfavorable P/E at 27.14
- Neutral dividend yield at 1.87%
Both companies exhibit solid global presence and product diversification. AMD’s challenges lie in liquidity and valuation metrics, while NXPI balances stronger profitability with higher leverage and valuation concerns. These factors shape their strategic financial positioning.
The Moat Duel: Analyzing Competitive Defensibility
A structural moat is the only thing protecting long-term profits from the erosion of competition. Let’s dissect how these two semiconductor giants defend their turf:
Advanced Micro Devices, Inc. (AMD): Innovation-Driven Cost Advantage
AMD’s moat stems from its aggressive cost advantage and product innovation, reflected in rising revenue and gross margins near 50%. However, declining ROIC signals weakening capital efficiency, threatening value creation in 2026.
NXP Semiconductors N.V. (NXPI): Niche Market Specialization
NXP relies on specialized automotive and IoT chips, boasting a higher gross margin of 54% and superior EBIT margin. Despite slight ROIC declines, its focused market positioning sustains moderate competitive strength amid industry headwinds.
Cost Leadership vs. Market Specialization: The Moat Face-Off
AMD’s broad cost advantage faces pressure from declining ROIC, while NXP’s niche specialization maintains steadier margins. NXP holds the deeper moat, better poised to defend market share through focused innovation and customer lock-in.
Which stock offers better returns?
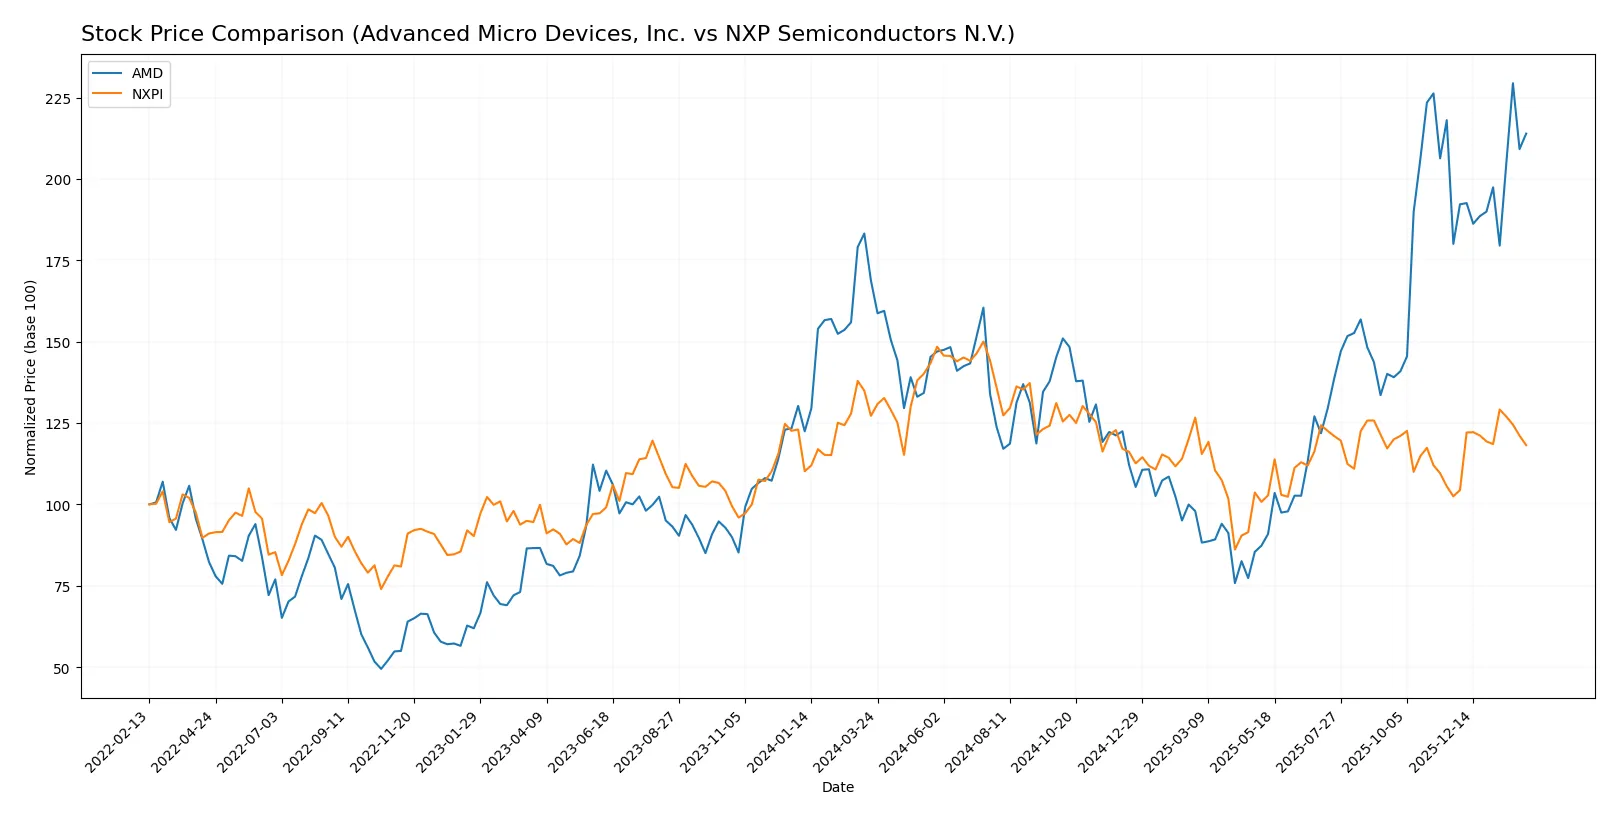
The past year reveals contrasting dynamics: AMD’s price surged notably, showing clear upward momentum, while NXPI experienced a decline despite recent positive moves.
Trend Comparison
Advanced Micro Devices, Inc. (AMD) posted a 26.72% price increase over the last 12 months, signaling a bullish trend with accelerating momentum and a high volatility standard deviation of 41.61. The stock reached a peak at 259.68 and bottomed at 85.76.
NXP Semiconductors N.V. (NXPI) faced a 7.11% decline over the same period, marking a bearish trend despite acceleration. Volatility was moderate with a 24.1 standard deviation, with prices ranging between 160.81 and 280.19.
Comparing trends, AMD outperformed NXPI with a strong positive return versus a negative one, delivering the highest market performance over the past year.
Target Prices
Analysts present a cautiously optimistic consensus on Advanced Micro Devices and NXP Semiconductors.
| Company | Target Low | Target High | Consensus |
|---|---|---|---|
| Advanced Micro Devices, Inc. | 225 | 380 | 291.56 |
| NXP Semiconductors N.V. | 215 | 280 | 245 |
The AMD consensus target of $291.56 sits well above its current $242, signaling expected growth. NXP’s $245 consensus target also exceeds its $220 price, indicating analyst confidence despite recent volatility.

Don’t Let Luck Decide Your Entry Point
Optimize your entry points with our advanced ProRealTime indicators. You’ll get efficient buy signals with precise price targets for maximum performance. Start outperforming now!
How do institutions grade them?
Here is a comparison of recent institutional grades for Advanced Micro Devices, Inc. and NXP Semiconductors N.V.:
Advanced Micro Devices, Inc. Grades
The table below summarizes recent grades from major financial institutions for AMD:
| Grading Company | Action | New Grade | Date |
|---|---|---|---|
| Wells Fargo | Maintain | Overweight | 2026-01-30 |
| Piper Sandler | Maintain | Overweight | 2026-01-26 |
| UBS | Maintain | Buy | 2026-01-26 |
| Bernstein | Maintain | Market Perform | 2026-01-21 |
| Keybanc | Upgrade | Overweight | 2026-01-13 |
| Truist Securities | Maintain | Buy | 2025-12-19 |
| Cantor Fitzgerald | Maintain | Overweight | 2025-12-16 |
| Morgan Stanley | Maintain | Equal Weight | 2025-11-12 |
| Wedbush | Maintain | Outperform | 2025-11-12 |
| Rosenblatt | Maintain | Buy | 2025-11-12 |
NXP Semiconductors N.V. Grades
Below is the recent grading summary for NXP Semiconductors from key financial firms:
| Grading Company | Action | New Grade | Date |
|---|---|---|---|
| Needham | Maintain | Buy | 2026-02-03 |
| Wells Fargo | Maintain | Overweight | 2026-01-15 |
| Citigroup | Maintain | Buy | 2026-01-15 |
| Truist Securities | Maintain | Buy | 2025-12-19 |
| JP Morgan | Maintain | Neutral | 2025-10-29 |
| Truist Securities | Maintain | Buy | 2025-10-29 |
| Truist Securities | Maintain | Buy | 2025-07-23 |
| Wells Fargo | Maintain | Overweight | 2025-07-23 |
| Susquehanna | Maintain | Neutral | 2025-07-23 |
| JP Morgan | Maintain | Neutral | 2025-07-23 |
Which company has the best grades?
Both companies have mostly positive grades, but AMD has a broader range including Buy and Outperform ratings, while NXP leans more toward Buy and Overweight with some Neutral ratings. This diversity in AMD’s grades may indicate stronger institutional conviction, potentially influencing investor confidence and valuation.
Risks specific to each company
The following categories highlight critical pressure points and systemic threats facing Advanced Micro Devices, Inc. (AMD) and NXP Semiconductors N.V. (NXPI) in the 2026 market environment:
1. Market & Competition
Advanced Micro Devices, Inc. (AMD)
- Faces intense competition from Intel and Nvidia, pressuring margins and market share.
NXP Semiconductors N.V. (NXPI)
- Competes strongly in automotive and IoT segments but faces competition from STMicroelectronics and Infineon.
2. Capital Structure & Debt
Advanced Micro Devices, Inc. (AMD)
- Maintains favorable debt ratios with strong interest coverage, signaling low financial risk.
NXP Semiconductors N.V. (NXPI)
- Exhibits higher debt-to-equity ratio (1.22), increasing leverage risk despite solid interest coverage.
3. Stock Volatility
Advanced Micro Devices, Inc. (AMD)
- High beta of 1.949 indicates above-average volatility relative to the market.
NXP Semiconductors N.V. (NXPI)
- Lower beta of 1.458 suggests more moderate stock volatility.
4. Regulatory & Legal
Advanced Micro Devices, Inc. (AMD)
- Subject to US export controls and antitrust scrutiny in semiconductor markets.
NXP Semiconductors N.V. (NXPI)
- Faces EU regulatory oversight and global trade compliance, with exposure in multiple jurisdictions.
5. Supply Chain & Operations
Advanced Micro Devices, Inc. (AMD)
- Relies on external foundries; supply chain disruptions could impact production.
NXP Semiconductors N.V. (NXPI)
- Diverse global manufacturing footprint mitigates risk but geopolitical tensions remain a concern.
6. ESG & Climate Transition
Advanced Micro Devices, Inc. (AMD)
- Increasing focus on energy-efficient processors but faces pressure to reduce carbon footprint.
NXP Semiconductors N.V. (NXPI)
- Leads in sensor technology for environmental monitoring, aligning well with climate transition goals.
7. Geopolitical Exposure
Advanced Micro Devices, Inc. (AMD)
- US-China tensions risk supply chain and market access disruptions.
NXP Semiconductors N.V. (NXPI)
- Exposure to EU, US, and Asia markets creates geopolitical complexity and trade risk.
Which company shows a better risk-adjusted profile?
AMD’s most impactful risk is its high market volatility and competitive pressure in core segments. NXPI’s principal risk is its elevated leverage, which could constrain flexibility in downturns. Overall, NXPI shows a better risk-adjusted profile due to stronger profitability and liquidity ratios despite its debt load. The recent leverage increase at NXPI demands cautious monitoring, but AMD’s valuation and volatility present a more immediate concern.
Final Verdict: Which stock to choose?
Advanced Micro Devices, Inc. (AMD) shines with its unmatched innovation and aggressive R&D investment, fueling rapid revenue growth and market share gains. Its main point of vigilance lies in declining profitability metrics, signaling challenges in capital efficiency. AMD suits investors chasing aggressive growth and technological disruption.
NXP Semiconductors N.V. (NXPI) offers a strategic moat through diversified semiconductor applications and solid recurring revenue streams. It displays better financial stability and consistent profitability than AMD, despite a modest recent revenue dip. NXPI fits investors seeking growth at a reasonable price with a more balanced risk profile.
If you prioritize rapid expansion and market disruption, AMD is the compelling choice due to its strong top-line momentum and innovation focus. However, if you seek better stability and a proven financial base, NXPI offers superior resilience and a steadier income profile. Both carry risks, so align your choice with your risk tolerance and investment horizon.
Disclaimer: Investment carries a risk of loss of initial capital. The past performance is not a reliable indicator of future results. Be sure to understand risks before making an investment decision.
Go Further
I encourage you to read the complete analyses of Advanced Micro Devices, Inc. and NXP Semiconductors N.V. to enhance your investment decisions: