Home > Comparison > Technology > AMD vs NVEC
The strategic rivalry between Advanced Micro Devices, Inc. (AMD) and NVE Corporation shapes the semiconductor sector’s innovation frontier. AMD operates as a diversified semiconductor powerhouse with a broad product portfolio and scale advantages. In contrast, NVE focuses on niche spintronic sensor technologies with a lean operational model. This analysis will assess which corporate trajectory offers a superior risk-adjusted return for a diversified portfolio amid evolving technology demands and market dynamics.
Table of contents
Companies Overview
Advanced Micro Devices and NVE Corporation play pivotal roles in the semiconductor sector with vastly different scales and scopes.
Advanced Micro Devices, Inc.: Industry Powerhouse in Semiconductor Innovation
Advanced Micro Devices dominates the semiconductor landscape with its diverse product portfolio spanning CPUs and GPUs. It generates revenue primarily from high-performance computing and graphics solutions, serving PCs, servers, and gaming consoles. In 2026, AMD focuses on expanding its data center and AI accelerator offerings to capture growth in cloud computing and professional graphics markets.
NVE Corporation: Specialist in Spintronic Sensor Technology
NVE Corporation operates as a niche semiconductor player specializing in spintronic sensor and coupler devices. Its revenue stems from selling magnetic sensors mainly for factory automation and medical devices, alongside licensing its spintronic technology. In 2026, NVE prioritizes advancing its industrial IoT applications and custom sensor development to deepen penetration in specialized markets.
Strategic Collision: Similarities & Divergences
AMD and NVE share a foundation in semiconductors but diverge sharply in scale and market approach. AMD pursues a broad, high-volume strategy with a focus on scalable computing platforms. NVE opts for a focused, technology-driven niche emphasizing specialized sensor solutions. Their competition unfolds in distinct arenas: AMD battles for leadership in mainstream computing, while NVE cultivates innovation in spintronics. This contrast defines their unique investment profiles—one a global tech giant, the other a specialized innovator.
Income Statement Comparison
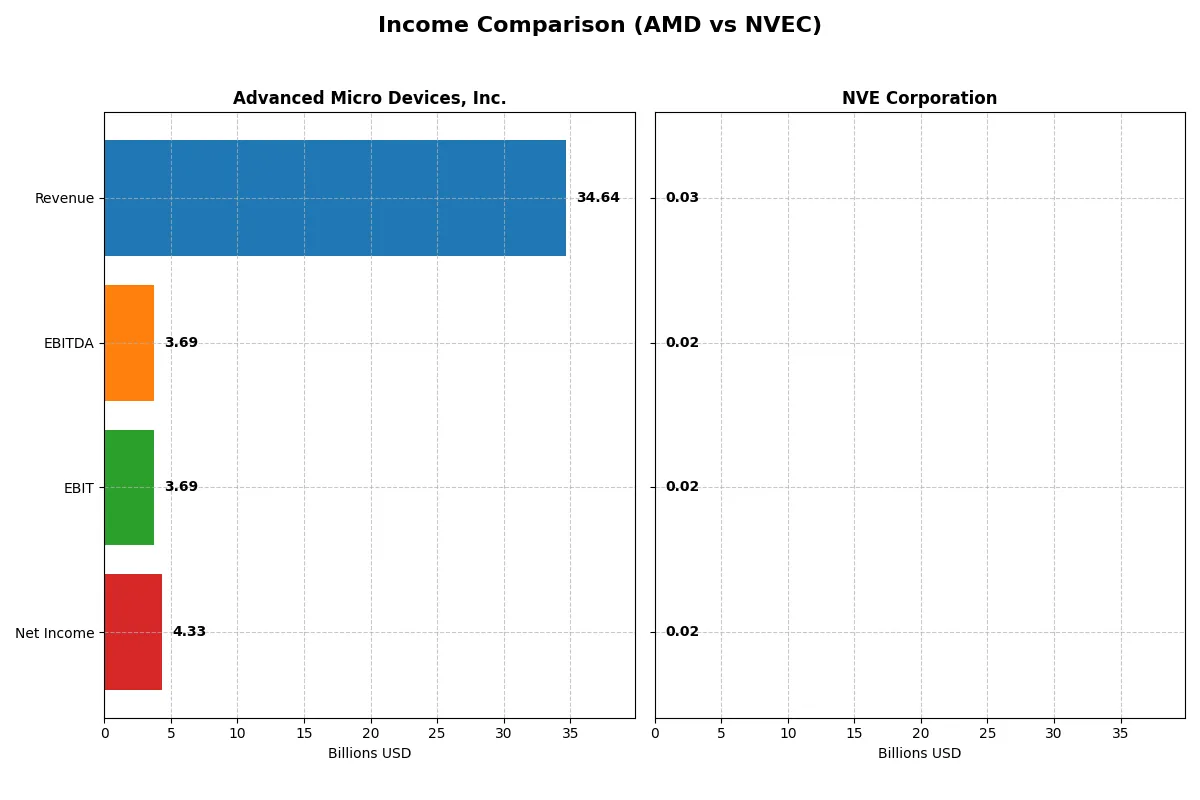
This data dissects the core profitability and scalability of both corporate engines to reveal who dominates the bottom line:
| Metric | Advanced Micro Devices, Inc. (AMD) | NVE Corporation (NVEC) |
|---|---|---|
| Revenue | 34.6B | 26M |
| Cost of Revenue | 17.5B | 4.2M |
| Operating Expenses | 13.5B | 5.6M |
| Gross Profit | 17.2B | 22M |
| EBITDA | 3.7B | 16.3M |
| EBIT | 3.7B | 16M |
| Interest Expense | 131M | 0 |
| Net Income | 4.3B | 15M |
| EPS | 2.67 | 3.12 |
| Fiscal Year | 2025 | 2025 |
Income Statement Analysis: The Bottom-Line Duel
This income statement comparison reveals which company drives greater efficiency and profitability through its core operations.
Advanced Micro Devices, Inc. Analysis
AMD’s revenue surged from 16.4B in 2021 to 34.6B in 2025, doubling over five years. Net income grew from 3.16B to 4.34B in 2025, with a strong net margin of 12.5%. Gross margin remained healthy near 50%, while EBIT margin improved to 10.7%. The 2025 jump in EBIT (+77.5%) signals accelerating operational leverage and efficiency.
NVE Corporation Analysis
NVE’s revenue climbed from 21.4M in 2021 to 29.8M in 2024 before dipping to 25.9M in 2025, showing some volatility. Net income rose from 11.7M to 17.1M in 2024, then dropped to 15.1M in 2025. Margins impress with a stellar 83.6% gross margin and 58.2% net margin in 2025, reflecting exceptional cost control and profitability despite recent revenue softness.
Margin Strength vs. Revenue Momentum
AMD demonstrates powerful revenue momentum and improving EBIT margins, doubling sales and nearly tripling net income since 2021. NVE excels in margin dominance, boasting exceptional profitability ratios but faces declining top-line momentum recently. For investors, AMD’s growth profile suits those seeking scale and expansion, while NVE appeals to those prioritizing margin quality and steady earnings.
Financial Ratios Comparison
These vital ratios act as a diagnostic tool to expose the underlying fiscal health, valuation premiums, and capital efficiency of the companies compared below:
| Ratios | Advanced Micro Devices, Inc. (AMD) | NVE Corporation (NVEC) |
|---|---|---|
| ROE | 2.85% (2024) | 24.19% (2025) |
| ROIC | 2.49% (2024) | 21.14% (2025) |
| P/E | 124x (2024) | 20.46x (2025) |
| P/B | 3.52 (2024) | 4.95 (2025) |
| Current Ratio | 2.62 (2024) | 28.40 (2025) |
| Quick Ratio | 1.83 (2024) | 22.03 (2025) |
| D/E | 3.84% (2024) | 1.48% (2025) |
| Debt-to-Assets | 3.20% (2024) | 1.43% (2025) |
| Interest Coverage | 20.65 (2024) | N/A (0) |
| Asset Turnover | 0.37 (2024) | 0.40 (2025) |
| Fixed Asset Turnover | 10.63 (2024) | 8.91 (2025) |
| Payout ratio | 0% (2024) | 128% (2025) |
| Dividend yield | 0% (2024) | 6.28% (2025) |
| Fiscal Year | 2024 | 2025 |
Efficiency & Valuation Duel: The Vital Signs
Financial ratios serve as a company’s DNA, unveiling hidden risks and operational strengths that shape investment decisions.
Advanced Micro Devices, Inc.
AMD posts a modest net margin of 12.5% but shows zero return on equity and invested capital, signaling weak profitability efficiency. Its P/E at 80.5 marks the stock as highly stretched. AMD does not pay dividends, opting instead for heavy reinvestment in R&D, dedicating roughly 25% of sales to innovation.
NVE Corporation
NVEC delivers a strong net margin of 58.2% and solid returns: 24.2% ROE and 21.1% ROIC, indicating operational efficiency. Its P/E ratio of 20.5 is reasonable, though a PB of 4.95 is relatively high. NVEC balances growth with shareholder returns, offering a 6.3% dividend yield alongside moderate reinvestment.
Operational Strength vs. Valuation Stretch
NVEC combines robust profitability with a fair valuation and attractive dividends, presenting a balanced risk-reward profile. AMD’s valuation appears stretched with weaker returns, relying heavily on R&D for future growth. Investors seeking income and operational efficiency may favor NVEC, while those betting on innovation might lean toward AMD’s growth focus.
Which one offers the Superior Shareholder Reward?
I observe AMD pays no dividends, focusing capital on growth and R&D, reflected in its zero payout ratio and high free cash flow per share of 3.4. AMD’s buyback program is modest but underlines reinvestment over immediate payouts. In contrast, NVE offers a 4.5% dividend yield with a payout ratio above 100%, signaling generous cash returns but potential sustainability risk. NVE’s buybacks complement its high dividend, boosting total shareholder return but raising caution on capital allocation efficiency. For 2026, I favor NVE’s aggressive shareholder distributions for income seekers, while AMD suits growth-oriented investors, making NVE superior for immediate total returns.
Comparative Score Analysis: The Strategic Profile
The radar chart reveals the fundamental DNA and trade-offs of Advanced Micro Devices, Inc. and NVE Corporation, highlighting their financial strengths and valuation nuances:
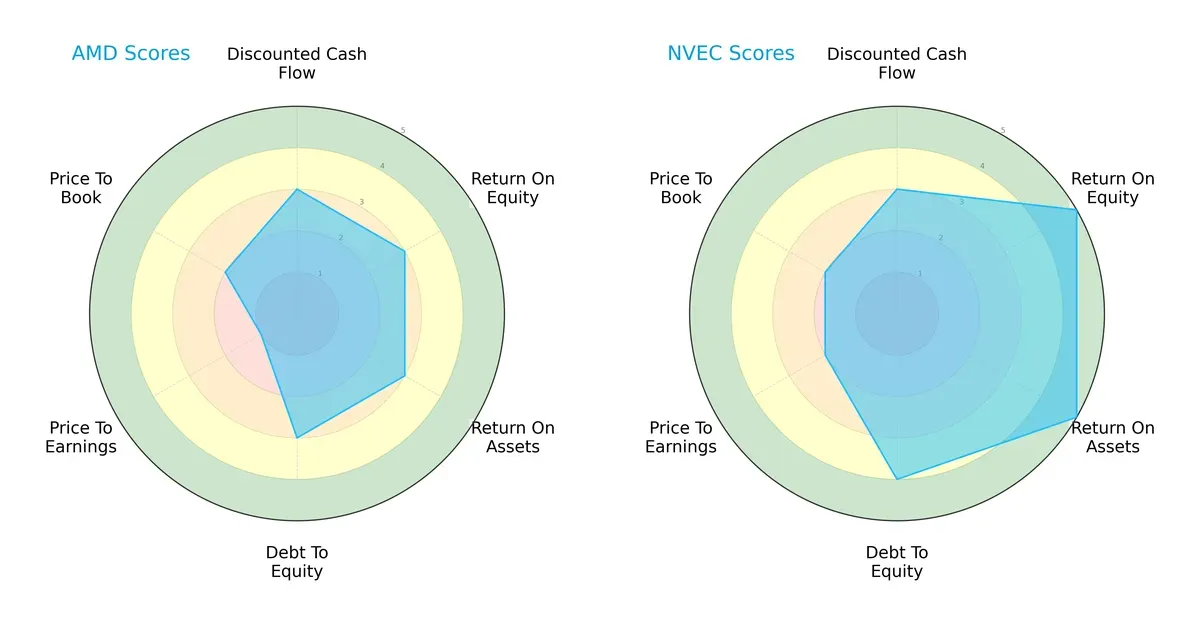
NVE demonstrates superior profitability with ROE and ROA scores at 5, compared to AMD’s moderate 3. NVE also holds a stronger balance sheet with a debt-to-equity score of 4 versus AMD’s 3. However, both firms share a moderate discounted cash flow outlook. AMD’s valuation appears more stretched, scoring just 1 on price-to-earnings against NVE’s 2. Overall, NVE presents a more balanced and robust financial profile, while AMD relies more on moderate operational metrics but suffers from valuation challenges.
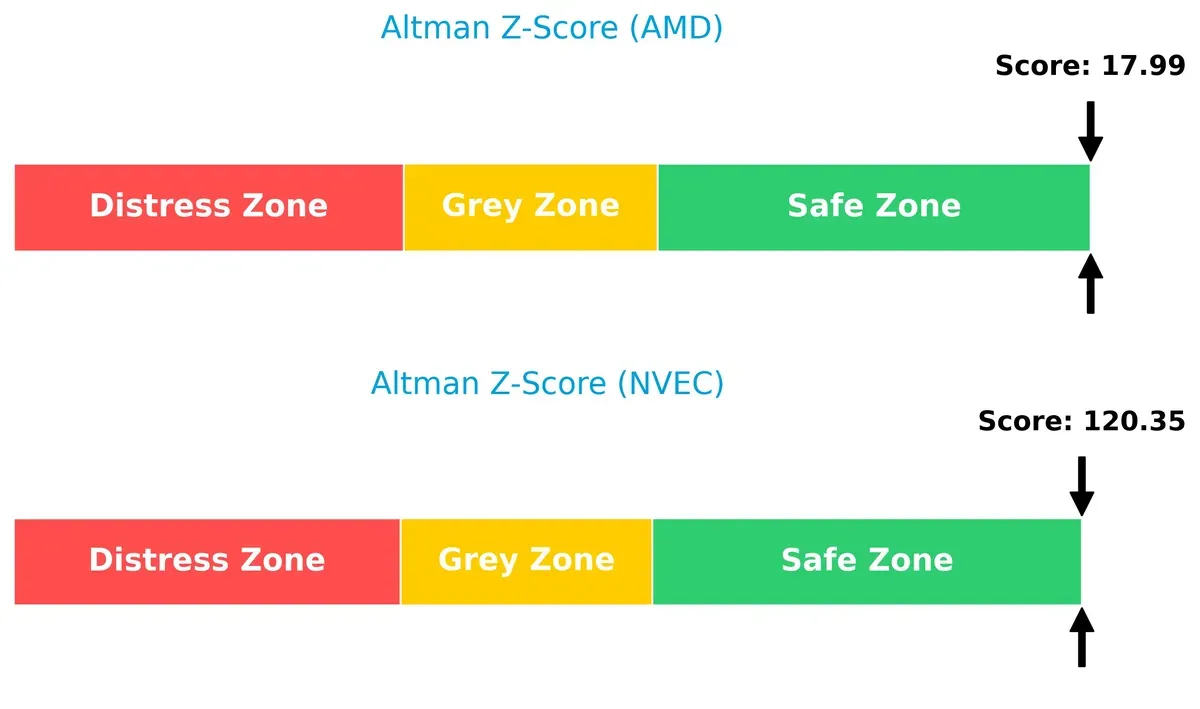
Bankruptcy Risk: Solvency Showdown
Both firms reside comfortably in the safe zone, but NVE’s Altman Z-Score of 120 far surpasses AMD’s 18, signaling significantly stronger solvency and a much lower bankruptcy risk in this cycle:
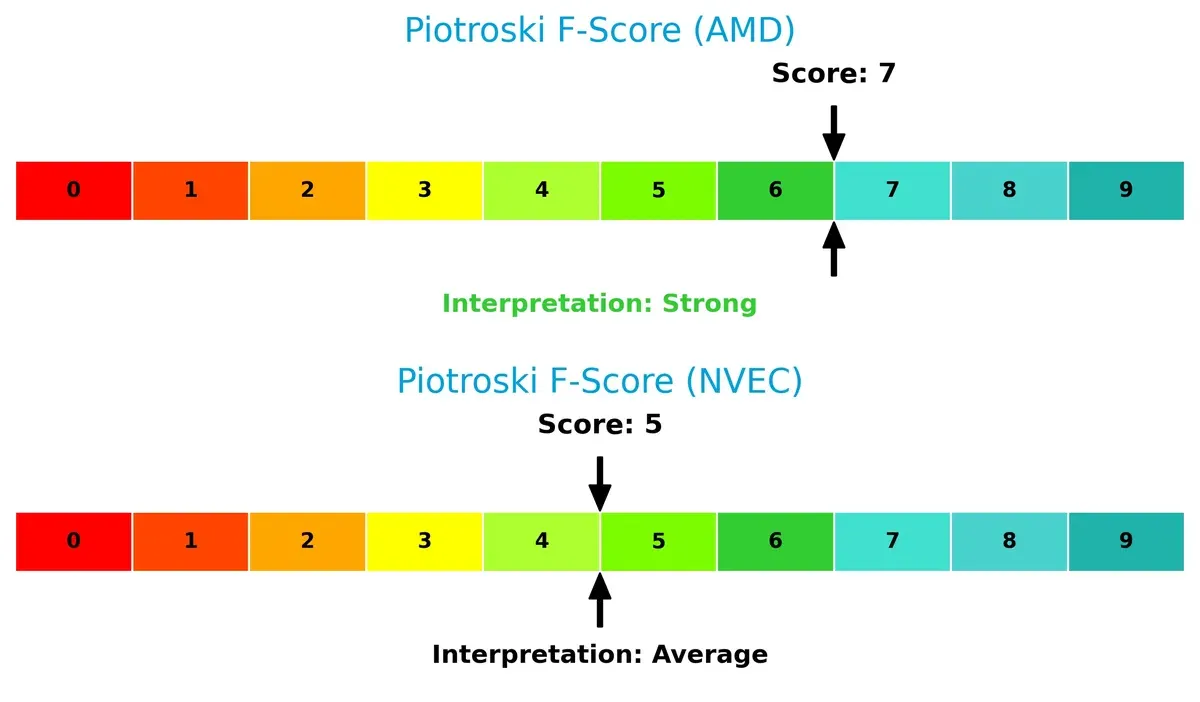
Financial Health: Quality of Operations
AMD’s Piotroski F-Score of 7 indicates strong operational quality, outperforming NVE’s average score of 5. This suggests AMD maintains healthier internal fundamentals, while NVE shows some internal metric weaknesses worth monitoring:
How are the two companies positioned?
This section dissects AMD and NVEC’s operational DNA by comparing their revenue distribution and internal dynamics, including strengths and weaknesses. The final objective is to confront their economic moats to identify which business model offers the most resilient and sustainable competitive advantage in today’s market.
Revenue Segmentation: The Strategic Mix
The following visual comparison dissects how Advanced Micro Devices, Inc. and NVE Corporation diversify their income streams and where their primary sector bets lie:
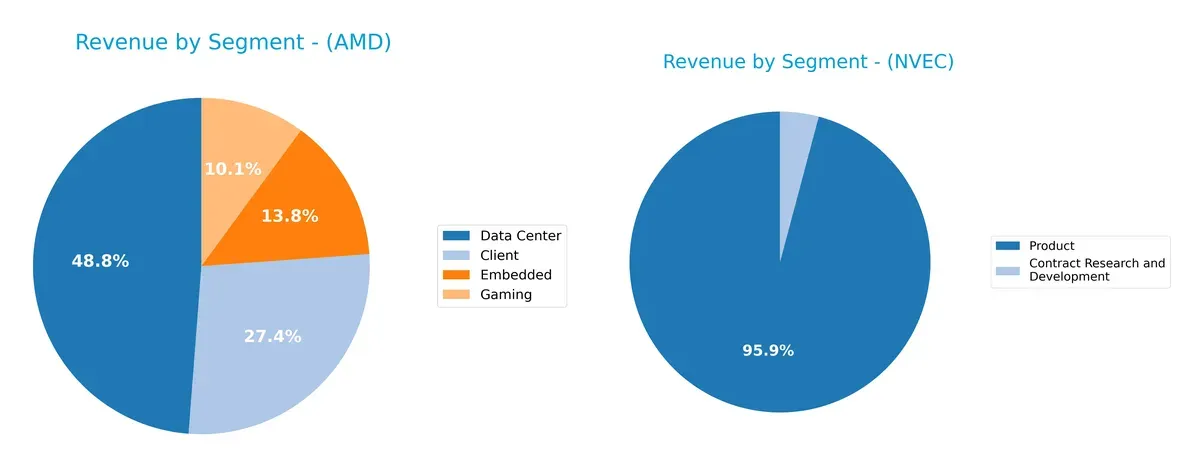
AMD’s revenue spreads across Client ($7.05B), Data Center ($12.58B), Embedded ($3.56B), and Gaming ($2.60B), showing a balanced mix anchored by Data Center. In contrast, NVE leans heavily on Product sales ($25.87M) with minimal Contract Research and Development ($1.12M), reflecting concentration risk. AMD’s diversified portfolio supports ecosystem lock-in, while NVE’s reliance signals dependence on product innovation and market demand.
Strengths and Weaknesses Comparison
This table compares the strengths and weaknesses of AMD and NVEC based on diversification, profitability, financials, innovation, global presence, and market share:
AMD Strengths
- Diverse product segments including Client, Data Center, Embedded, Gaming
- Significant revenue from the United States and China
- Favorable net margin at 12.51%
- Low debt levels and strong interest coverage ratio
NVEC Strengths
- High profitability metrics: net margin 58.22%, ROE 24.19%, ROIC 21.14%
- Strong quick ratio and low debt-to-assets
- Favorable fixed asset turnover rate of 8.91
- Solid global presence with significant US and European sales
AMD Weaknesses
- Unfavorable ROE, ROIC, and WACC indicating weak capital efficiency
- Poor liquidity ratios: current and quick ratios unfavorable
- High price-to-earnings ratio at 80.54 signals expensive valuation
- Low asset turnover ratios suggest inefficiency
NVEC Weaknesses
- Unfavorable current ratio indicating liquidity risk
- Unfavorable price-to-book ratio at 4.95
- Moderate asset turnover at 0.4 limits operational efficiency
- Dividend yield neutral, suggesting limited income return
Overall, NVEC demonstrates stronger profitability and financial health with more favorable capital efficiency metrics. AMD shows product and geographic diversification but faces challenges in profitability and liquidity metrics. Both companies have distinct financial profiles that may influence their strategic priorities.
The Moat Duel: Analyzing Competitive Defensibility
A structural moat is the only reliable shield protecting long-term profits from relentless competitive erosion. Here’s how AMD and NVE Corporation compare:
Advanced Micro Devices, Inc. (AMD): Innovation-Driven Scale Moat
AMD leverages product innovation and scale, driving strong revenue growth and margin stability. Yet, its declining ROIC signals weakening capital efficiency, challenging moat durability in 2026.
NVE Corporation: Niche Tech with High-Return Moat
NVE’s moat stems from proprietary spintronic technology, yielding exceptionally high margins and a growing ROIC. Despite modest revenue dips, its focused niche secures expanding profitability and market resilience.
Innovation Scale vs. Technology Focus: Who Holds the Competitive Edge?
NVE displays a wider and deeper moat, evidenced by a consistent ROIC above WACC and rising profitability. AMD’s scale advantage weakens as capital returns erode, leaving NVE better poised to defend market share.
Which stock offers better returns?
Over the past year, Advanced Micro Devices, Inc. (AMD) showed strong price appreciation with accelerating momentum, while NVE Corporation (NVEC) trended downward despite recent modest gains.
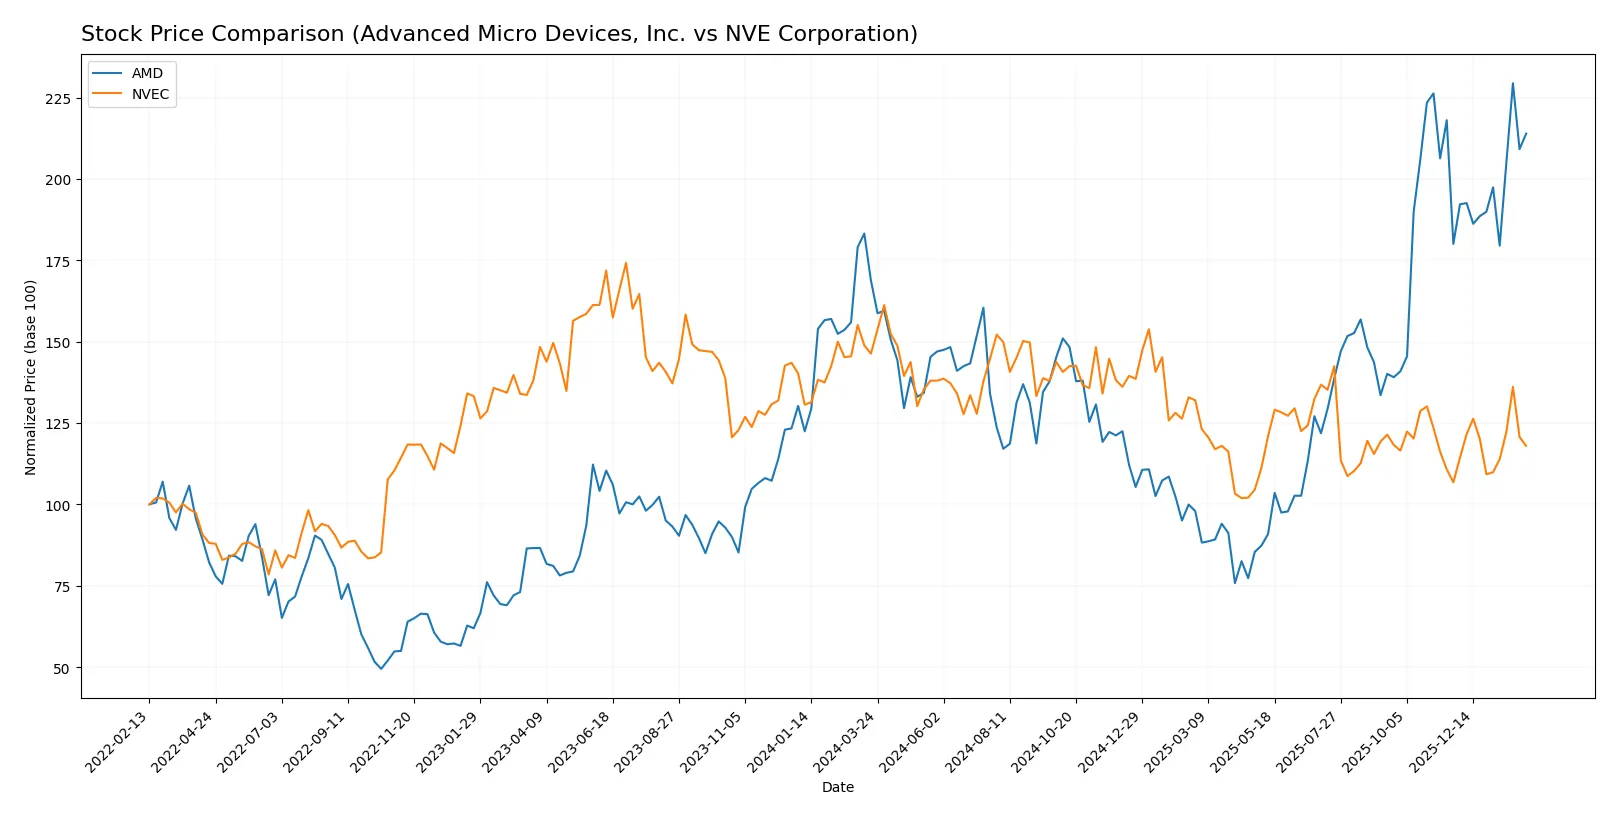
Trend Comparison
AMD’s stock price rose 26.72% over the past 12 months, marking a bullish trend with accelerating gains and a high volatility of 41.61%. The price ranged from 85.76 to 259.68.
NVEC’s stock declined 19.38% over the same period, reflecting a bearish trend despite an acceleration in the downward move. Volatility remained low at 7.56%, with prices between 56.99 and 90.18.
Comparing trends, AMD delivered the highest market performance with strong upward momentum, outpacing NVEC’s overall negative return despite recent mild recovery.
Target Prices
Analyst consensus on Advanced Micro Devices, Inc. (AMD) targets a robust upside from current levels.
| Company | Target Low | Target High | Consensus |
|---|---|---|---|
| Advanced Micro Devices, Inc. | 225 | 380 | 291.56 |
The target range for AMD indicates a potential 17% upside from the current price of $242.11, reflecting strong analyst confidence amid semiconductor sector volatility. No verified target price data is available for NVE Corporation.

Don’t Let Luck Decide Your Entry Point
Optimize your entry points with our advanced ProRealTime indicators. You’ll get efficient buy signals with precise price targets for maximum performance. Start outperforming now!
How do institutions grade them?
The following presents the latest institutional grades for Advanced Micro Devices, Inc. and NVE Corporation:
Advanced Micro Devices, Inc. Grades
Here are recent grades assigned by major grading companies for AMD:
| Grading Company | Action | New Grade | Date |
|---|---|---|---|
| Wells Fargo | Maintain | Overweight | 2026-01-30 |
| Piper Sandler | Maintain | Overweight | 2026-01-26 |
| UBS | Maintain | Buy | 2026-01-26 |
| Bernstein | Maintain | Market Perform | 2026-01-21 |
| Keybanc | Upgrade | Overweight | 2026-01-13 |
| Truist Securities | Maintain | Buy | 2025-12-19 |
| Cantor Fitzgerald | Maintain | Overweight | 2025-12-16 |
| Morgan Stanley | Maintain | Equal Weight | 2025-11-12 |
| Wedbush | Maintain | Outperform | 2025-11-12 |
| Rosenblatt | Maintain | Buy | 2025-11-12 |
NVE Corporation Grades
No reliable institutional grades are available for NVE Corporation as of the current date.
Which company has the best grades?
Advanced Micro Devices, Inc. has multiple recent positive grades, including several Buy and Overweight ratings. NVE Corporation lacks current institutional grades. This suggests greater analyst coverage and confidence in AMD, which could influence investor perceptions and liquidity.
Risks specific to each company
The following categories identify the critical pressure points and systemic threats facing both firms in the 2026 market environment:
1. Market & Competition
Advanced Micro Devices, Inc.
- Faces intense competition from industry giants like Intel and Nvidia, pressuring margins and market share.
NVE Corporation
- Operates in a niche spintronics market with limited direct competition but smaller scale limits influence.
2. Capital Structure & Debt
Advanced Micro Devices, Inc.
- Maintains favorable debt-to-equity ratios and strong interest coverage, signaling manageable leverage risk.
NVE Corporation
- Exhibits very low debt levels and excellent interest coverage, demonstrating a conservative capital structure.
3. Stock Volatility
Advanced Micro Devices, Inc.
- High beta of 1.95 indicates significant stock price volatility relative to the market, increasing investment risk.
NVE Corporation
- Moderate beta of 1.22 suggests lower but still notable volatility compared to the broader market.
4. Regulatory & Legal
Advanced Micro Devices, Inc.
- Subject to complex global semiconductor regulations and antitrust scrutiny, raising compliance risks.
NVE Corporation
- Faces standard regulatory risks for semiconductor device manufacturers but less exposure to global trade tensions.
5. Supply Chain & Operations
Advanced Micro Devices, Inc.
- Relies on global foundries and complex supply chains vulnerable to geopolitical disruptions and component shortages.
NVE Corporation
- Smaller scale and specialized product focus reduce exposure but also limit operational flexibility.
6. ESG & Climate Transition
Advanced Micro Devices, Inc.
- Increasing pressure to reduce carbon footprint amid semiconductor industry’s high energy consumption.
NVE Corporation
- Emerging focus on sustainable spintronic technologies but limited ESG reporting transparency.
7. Geopolitical Exposure
Advanced Micro Devices, Inc.
- High exposure to US-China trade tensions and export controls impacting semiconductor technology transfers.
NVE Corporation
- Lower geopolitical risk given niche market and less reliance on contentious international supply chains.
Which company shows a better risk-adjusted profile?
NVE Corporation’s most impactful risk lies in its limited scale and niche market, which restrict growth and bargaining power. AMD faces higher market competition and geopolitical risks, mainly from US-China tensions and complex supply chains. NVE’s conservative capital structure and lower volatility support a better risk-adjusted profile. Notably, AMD’s high beta of 1.95 signals elevated market sensitivity, justifying caution despite its industry stature.
Final Verdict: Which stock to choose?
Advanced Micro Devices, Inc. (AMD) wields unmatched innovation and growth momentum in semiconductors. Its strength lies in rapid revenue and earnings acceleration, fueled by aggressive R&D. A point of vigilance is AMD’s declining return on invested capital, signaling pressure on long-term value creation. It suits aggressive growth portfolios willing to navigate volatility.
NVE Corporation (NVEC) boasts a durable moat with high profitability and efficient capital use. Its strategic edge lies in superior net margins and a strong safety profile, backed by conservative leverage and robust free cash flow. Relative to AMD, NVEC offers better stability, fitting well within GARP (Growth at a Reasonable Price) portfolios targeting steady returns.
If you prioritize high-growth potential and are comfortable with cyclical risks, AMD stands out due to its innovation-driven expansion despite profitability headwinds. However, if you seek durable competitive advantage and financial resilience, NVEC offers better stability and consistent value creation, commanding a premium for quality and safety.
Disclaimer: Investment carries a risk of loss of initial capital. The past performance is not a reliable indicator of future results. Be sure to understand risks before making an investment decision.
Go Further
I encourage you to read the complete analyses of Advanced Micro Devices, Inc. and NVE Corporation to enhance your investment decisions: