Home > Comparison > Technology > AMD vs NVMI
The strategic rivalry between Advanced Micro Devices, Inc. and Nova Ltd. shapes the semiconductor industry’s evolution. AMD operates as a diversified chipmaker with broad computing and graphics solutions. Nova Ltd. specializes in precise process control systems for semiconductor manufacturing. This analysis explores their contrasting operational models and competitive dynamics to identify which company offers superior risk-adjusted returns for investors seeking exposure to semiconductor innovation and growth.
Table of contents
Companies Overview
Advanced Micro Devices, Inc. and Nova Ltd. stand as pivotal players in the semiconductor industry, shaping technology worldwide.
Advanced Micro Devices, Inc.: Semiconductor Powerhouse
Advanced Micro Devices, Inc. dominates the semiconductor market with its diverse CPU and GPU portfolio. Its revenue stems from computing and graphics products, including Ryzen processors and Radeon GPUs. In 2026, AMD’s strategic focus lies in expanding data center solutions and advancing high-performance computing technologies to capture growing cloud and enterprise demand.
Nova Ltd.: Precision Metrology Specialist
Nova Ltd. specializes in process control systems essential for semiconductor manufacturing. Its core revenue comes from metrology platforms used in lithography, etch, and deposition steps. In 2026, Nova concentrates on enhancing measurement accuracy and supporting advanced packaging processes to meet evolving foundry and logic manufacturer needs.
Strategic Collision: Similarities & Divergences
AMD and Nova approach the semiconductor space differently; AMD drives broad product innovation in computing and graphics, while Nova focuses on niche manufacturing precision. They primarily compete indirectly, with AMD targeting end-product performance and Nova enabling manufacturing efficiency. Their investment profiles diverge sharply—AMD offers scale and market breadth; Nova emphasizes specialized technology leadership.
Income Statement Comparison
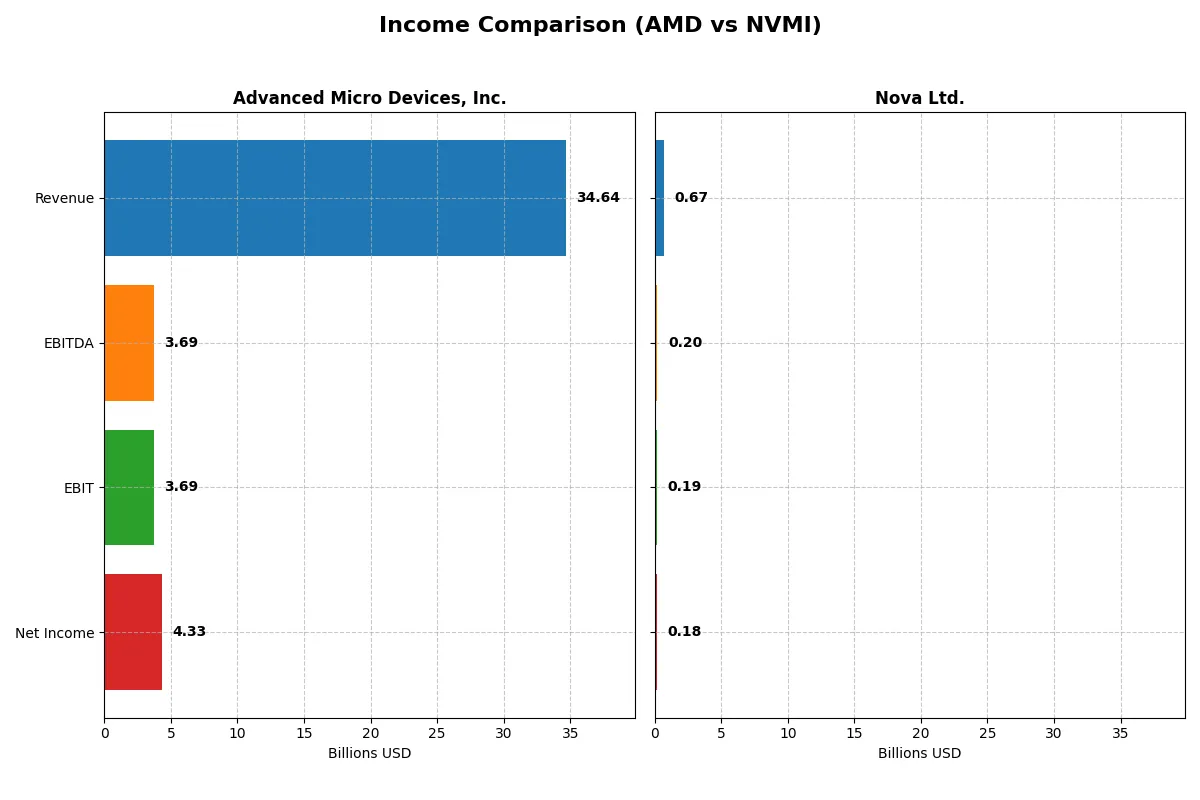
This data dissects the core profitability and scalability of both corporate engines to reveal who dominates the bottom line:
| Metric | Advanced Micro Devices, Inc. (AMD) | Nova Ltd. (NVMI) |
|---|---|---|
| Revenue | 34.6B | 672M |
| Cost of Revenue | 17.5B | 285M |
| Operating Expenses | 13.5B | 200M |
| Gross Profit | 17.2B | 387M |
| EBITDA | 3.7B | 205M |
| EBIT | 3.7B | 188M |
| Interest Expense | 131M | 1.6M |
| Net Income | 4.3B | 185M |
| EPS | 2.67 | 6.31 |
| Fiscal Year | 2025 | 2024 |
Income Statement Analysis: The Bottom-Line Duel
The following income statement comparison reveals the true efficiency and profitability of Advanced Micro Devices and Nova Ltd.’s corporate engines.
Advanced Micro Devices, Inc. Analysis
AMD’s revenue surged 34% to $34.6B in 2025, fueling a robust net income jump to $4.34B. Gross margin held strong at 49.5%, while net margin expanded to a favorable 12.5%. The company’s operating income more than doubled year-over-year, reflecting improved cost control and significant momentum in profitability.
Nova Ltd. Analysis
Nova Ltd. posted a 30% revenue rise to $672M in 2024, supporting a net income of $185M. Its gross margin of 57.6% and net margin near 27.3% illustrate superior profitability compared to peers. Despite a smaller scale, Nova’s steady EBIT margin of 27.9% highlights operational efficiency and consistent earnings growth over five years.
Scale vs. Margin: The Profitability Face-Off
AMD dominates in scale with $34.6B revenue and strong profit growth, while Nova excels in margin efficiency, boasting nearly double AMD’s net margin percentage. AMD’s aggressive expansion offers growth potential, but Nova’s lean cost structure delivers higher profitability per dollar earned. Investors must weigh growth scale against margin strength when assessing these profiles.
Financial Ratios Comparison
These vital ratios act as a diagnostic tool to expose the underlying fiscal health, valuation premiums, and capital efficiency of each company:
| Ratios | Advanced Micro Devices, Inc. (AMD) | Nova Ltd. (NVMI) |
|---|---|---|
| ROE | 2.85% (2024) | 19.81% (2024) |
| ROIC | 2.49% (2024) | 13.39% (2024) |
| P/E | 124x (2024) | 31.20x (2024) |
| P/B | 3.52x (2024) | 6.18x (2024) |
| Current Ratio | 2.62 (2024) | 2.32 (2024) |
| Quick Ratio | 1.83 (2024) | 1.92 (2024) |
| D/E | 3.84% (2024) | 25.45% (2024) |
| Debt-to-Assets | 3.20% (2024) | 16.98% (2024) |
| Interest Coverage | 20.65 (2024) | 116.20 (2024) |
| Asset Turnover | 0.37 (2024) | 0.48 (2024) |
| Fixed Asset Turnover | 10.63 (2024) | 5.06 (2024) |
| Payout ratio | 0% (2024) | 0% (2024) |
| Dividend yield | 0% (2024) | 0% (2024) |
| Fiscal Year | 2024 | 2024 |
Efficiency & Valuation Duel: The Vital Signs
Financial ratios act as the company’s DNA, exposing hidden risks and revealing operational strengths through key profitability and valuation metrics.
Advanced Micro Devices, Inc.
AMD shows a favorable net margin of 12.51% but struggles with zero returns on equity and invested capital, signaling operational challenges. The stock trades at a stretched P/E of 80.54, indicating high market expectations. AMD offers no dividends, focusing instead on reinvestment in R&D, dedicating 25% of revenue to innovation.
Nova Ltd.
NVMI delivers solid profitability with a 27.33% net margin and a strong 19.81% ROE, reflecting efficient capital use. Its P/E of 31.2 is high but more reasonable than AMD’s. NVMI maintains a healthy balance sheet with favorable liquidity ratios and interest coverage. It currently pays no dividends, likely reinvesting to support growth and operational efficiency.
Operational Strength Meets Valuation Pressure
NVMI presents a better balance of profitability and financial health, despite a still-elevated valuation. In contrast, AMD’s high valuation contrasts with weak returns, increasing risk. Growth-oriented investors may prefer AMD’s reinvestment profile, while those seeking operational stability might lean toward NVMI.
Which one offers the Superior Shareholder Reward?
I observe that neither AMD nor NVMI paid dividends in recent years, so their shareholder rewards rely solely on share buybacks and reinvestment. AMD shows no dividend yield or payout ratio, focusing on robust free cash flow of 3.4/share in 2025 and moderate buyback activity. NVMI also pays no dividend but generates a stronger free cash flow of 7.5/share in 2024, combined with consistent operating margins above 27%. Both emphasize buybacks, but NVMI’s superior free cash flow and higher net profit margin suggest a more sustainable distribution capacity. I conclude NVMI offers superior total shareholder reward in 2026, balancing buybacks with solid reinvestment for growth.
Comparative Score Analysis: The Strategic Profile
The radar chart reveals the fundamental DNA and trade-offs of Advanced Micro Devices, Inc. and Nova Ltd., highlighting their core financial strengths and weaknesses:
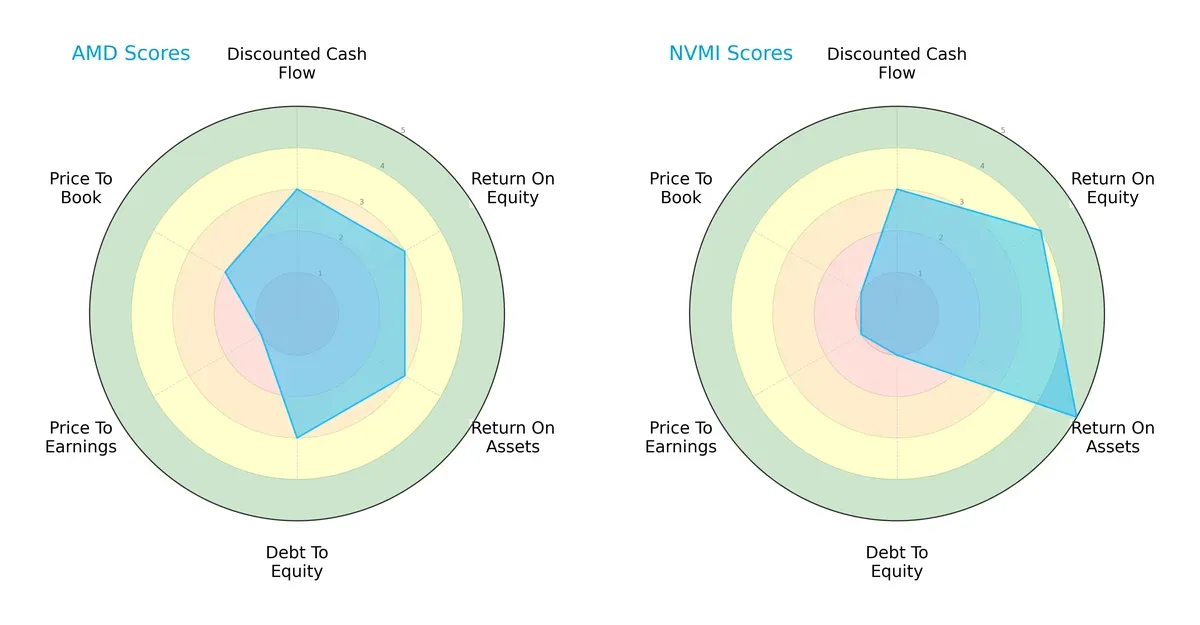
Both firms share a moderate overall score, but Nova Ltd. excels in profitability with higher ROE (4 vs. 3) and ROA (5 vs. 3) scores. Conversely, Advanced Micro Devices shows a more balanced debt profile (Debt/Equity score of 3 vs. 1), indicating lower financial risk. Valuation metrics (P/E and P/B) remain challenging for both, with Nova Ltd. facing very unfavorable scores, reflecting possible overvaluation or market skepticism.
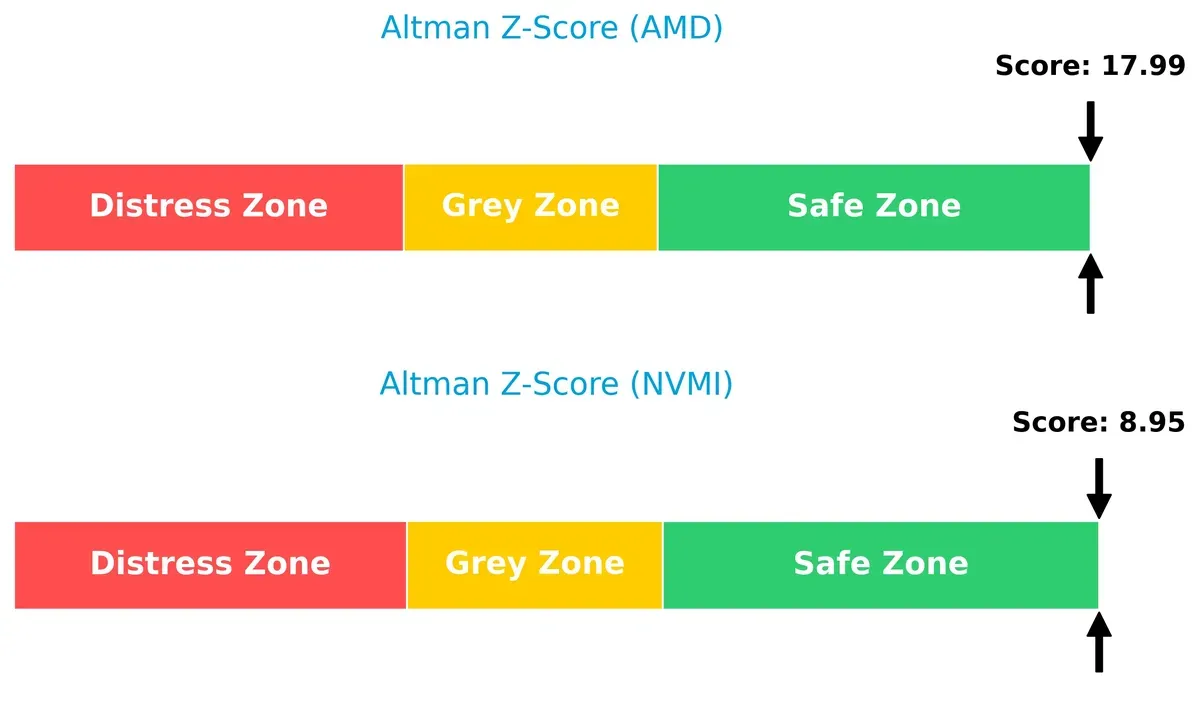
Bankruptcy Risk: Solvency Showdown
Advanced Micro Devices holds a significantly higher Altman Z-Score (18.0 vs. 8.95), signaling superior long-term solvency and a robust buffer against bankruptcy risk in this volatile cycle:
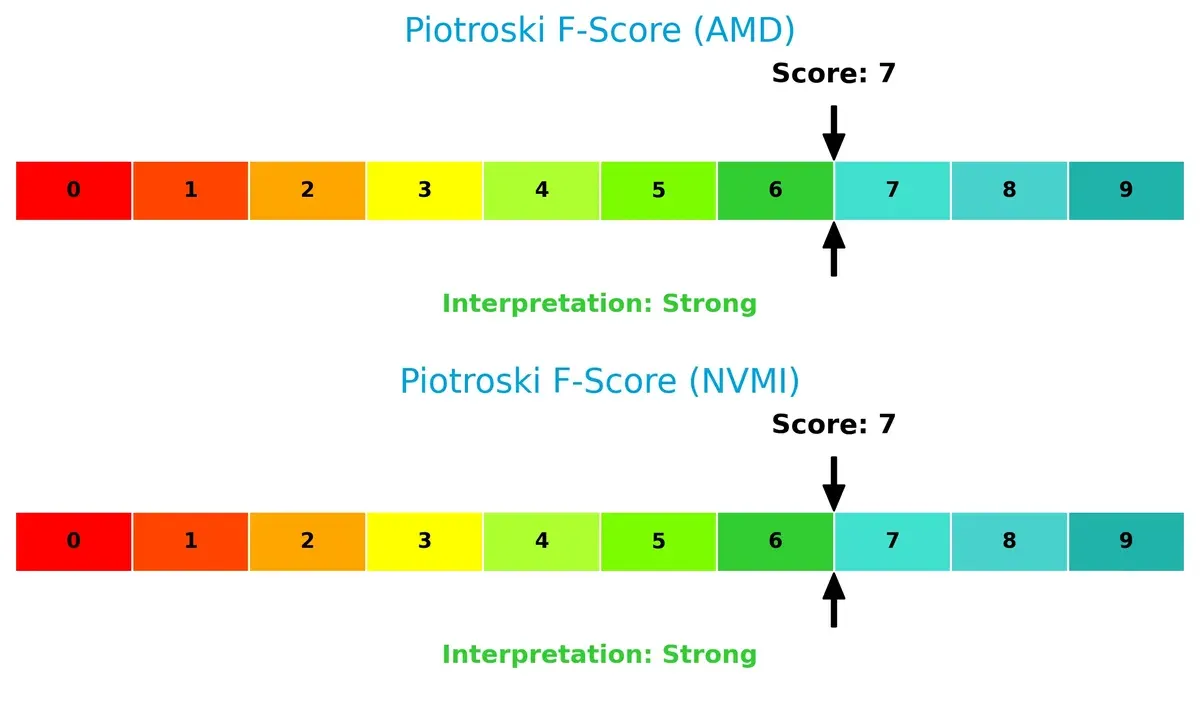
Financial Health: Quality of Operations
Both companies share a Piotroski F-Score of 7, indicating strong financial health. Neither shows red flags, but investors should watch for how operational efficiencies evolve amid sector headwinds:
How are the two companies positioned?
This section dissects the operational DNA of AMD and NVMI by comparing their revenue distribution and internal dynamics, including strengths and weaknesses. The goal is to confront their economic moats and identify which business model offers the most resilient competitive advantage today.
Revenue Segmentation: The Strategic Mix
The following visual comparison dissects how both firms diversify their income streams and where their primary sector bets lie:
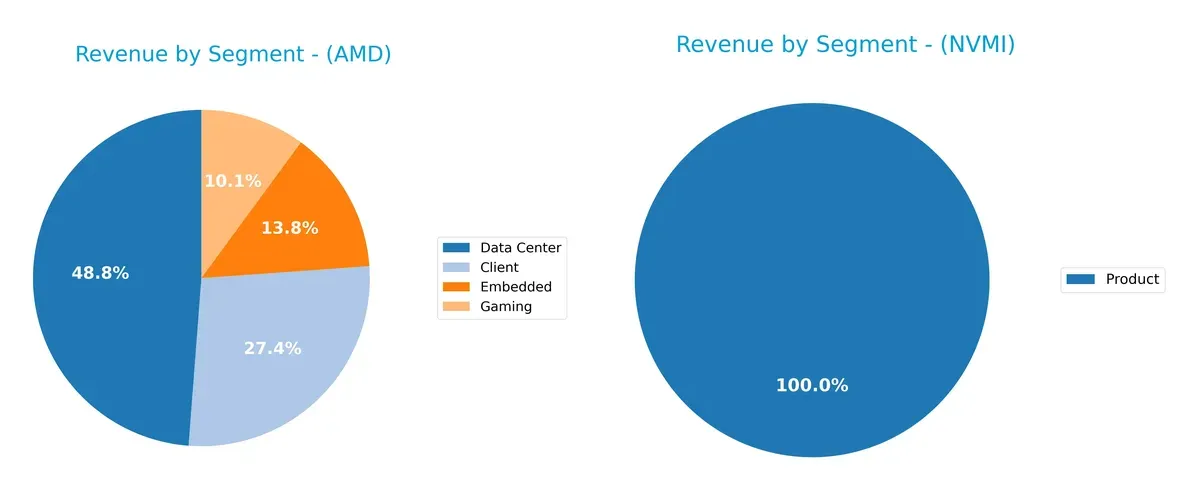
Advanced Micro Devices, Inc. (AMD) shows a well-diversified revenue base with $12.6B in Data Center, $7.1B in Client, $3.6B in Embedded, and $2.6B in Gaming segments. In contrast, Nova Ltd. (NVMI) relies entirely on a single $538M Product segment. AMD’s broad mix anchors it across multiple growth vectors, reducing concentration risk. NVMI, however, faces higher vulnerability due to its dependence on one core business line.
Strengths and Weaknesses Comparison
This table compares the strengths and weaknesses of Advanced Micro Devices, Inc. (AMD) and Nova Ltd. (NVMI):
AMD Strengths
- Diversified revenue across Client, Data Center, Embedded, and Gaming segments
- Strong global presence with significant sales in the United States, China, and Singapore
- Favorable net margin at 12.51%
- Low debt-to-assets ratio and strong interest coverage
NVMI Strengths
- High profitability with net margin of 27.33% and ROE of 19.81%
- Favorable ROIC above WACC, showing efficient capital allocation
- Strong liquidity ratios with current ratio 2.32 and quick ratio 1.92
- Low leverage with debt/equity of 0.25 and strong interest coverage
AMD Weaknesses
- Unfavorable ROE and ROIC at zero indicating weak returns on equity and invested capital
- High WACC at 12.94% exceeds ROIC, suggesting capital inefficiency
- Unfavorable liquidity ratios including current and quick ratios at zero
- Very high P/E ratio of 80.54 indicates overvaluation risk
- Low asset turnover ratios reflecting inefficient asset use
- No dividend yield
NVMI Weaknesses
- WACC at 12.26% is slightly unfavorable compared to ROIC
- Elevated P/E of 31.2 and high price-to-book at 6.18 may indicate valuation concerns
- Asset turnover below 0.5 suggests moderate asset utilization
- No dividend yield
Both companies exhibit contrasting profiles. AMD boasts broad diversification and global reach but struggles with returns and liquidity. NVMI excels in profitability and financial health but shows signs of valuation risk and moderate asset efficiency. These factors shape their strategic priorities differently.
The Moat Duel: Analyzing Competitive Defensibility
A structural moat is the only reliable defense against profit erosion from competition over the long term. Let’s compare two semiconductor firms’ moats:
Advanced Micro Devices, Inc. (AMD): Innovation-Driven Scale Moat
AMD’s primary moat stems from product innovation and scale in CPUs and GPUs. Despite strong revenue growth (110% over five years), its declining ROIC erodes value. In 2026, new data center products may deepen its moat, but profitability challenges persist.
Nova Ltd. (NVMI): Precision Metrology Expertise
Nova’s moat lies in niche process control systems with high gross margins (58%) and expanding ROIC (+70% trend). Unlike AMD, NVMI shows improving profitability and value creation. Its specialized tech supports steady expansion into foundry and memory sectors.
Verdict: Innovation Scale vs. Precision Niche
AMD’s broad market presence is offset by declining capital efficiency, while NVMI’s focused expertise delivers rising returns. NVMI holds the deeper moat today, better positioned to defend and grow its market share in 2026.
Which stock offers better returns?
The past year shows strong bullish momentum for both stocks, with Advanced Micro Devices, Inc. (AMD) and Nova Ltd. exhibiting accelerating price gains and distinct trading volume trends.
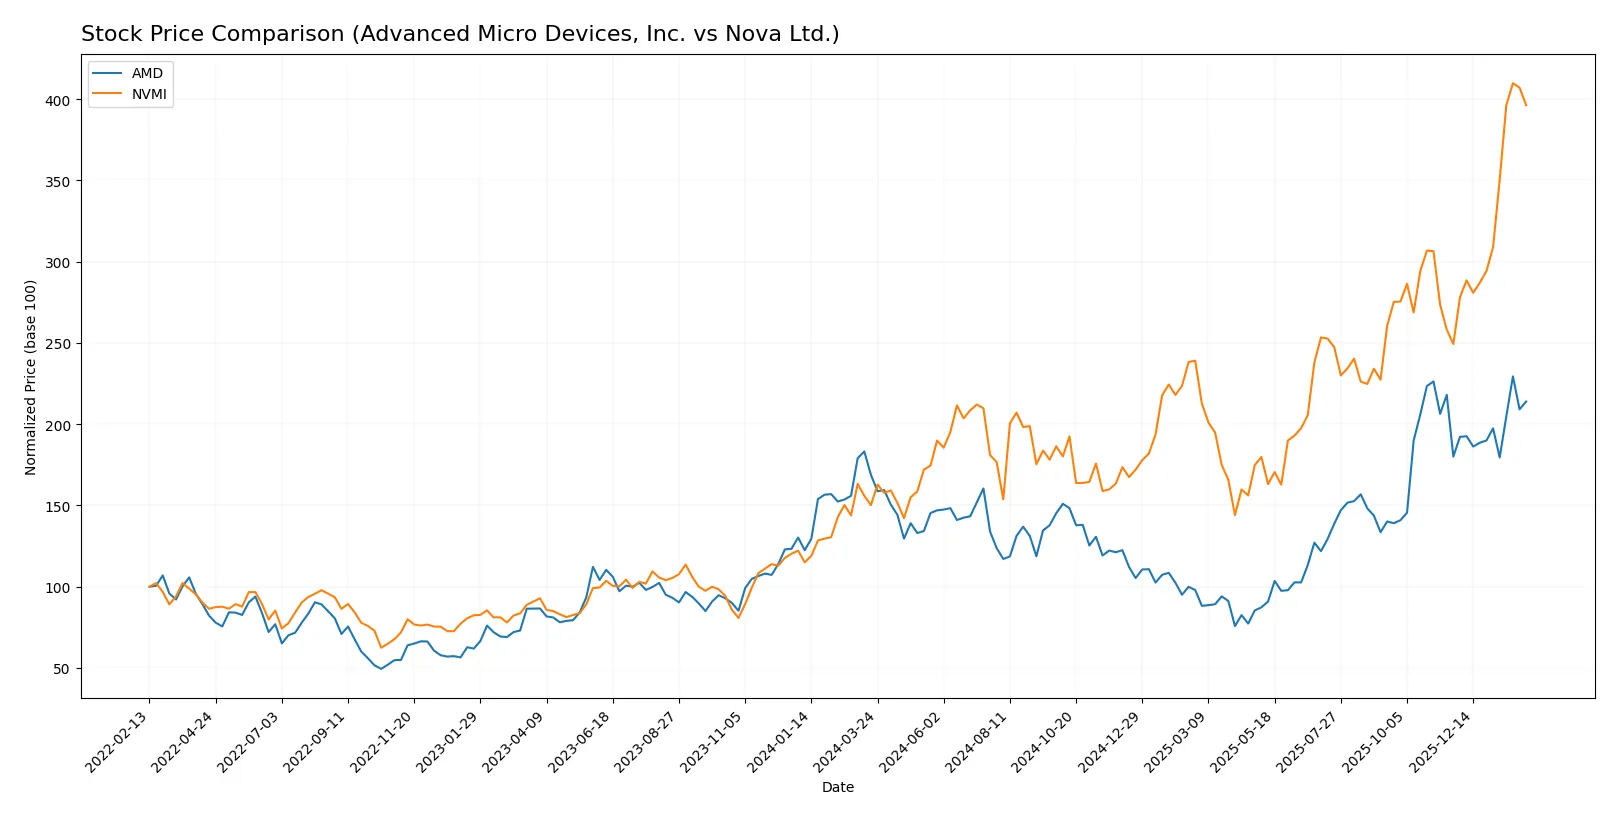
Trend Comparison
AMD’s stock rose 26.72% over the past year, marking a bullish trend with acceleration. It reached a high of 259.68 and a low of 85.76, showing moderate volatility with a 41.61 standard deviation.
NVMI’s stock surged 163.81% during the same period, also bullish with acceleration. It hit a peak of 460.91 and a trough of 159.92, exhibiting higher volatility at 66.63 standard deviation.
NVMI significantly outperformed AMD, delivering the highest market returns and stronger recent price appreciation, supported by an increasing volume trend.
Target Prices
Analyst consensus projects solid upside potential for both Advanced Micro Devices, Inc. (AMD) and Nova Ltd. (NVMI).
| Company | Target Low | Target High | Consensus |
|---|---|---|---|
| Advanced Micro Devices, Inc. | 225 | 380 | 291.56 |
| Nova Ltd. | 335 | 500 | 408.33 |
Both stocks trade below their consensus targets, indicating room for growth. AMD’s consensus target exceeds its current 242 price by 20%, while NVMI’s 408 consensus remains roughly 8% below its 446 current price, suggesting mixed near-term expectations.

Don’t Let Luck Decide Your Entry Point
Optimize your entry points with our advanced ProRealTime indicators. You’ll get efficient buy signals with precise price targets for maximum performance. Start outperforming now!
How do institutions grade them?
Advanced Micro Devices, Inc. Grades
The following table shows recent grades and actions from established grading companies for AMD.
| Grading Company | Action | New Grade | Date |
|---|---|---|---|
| Wells Fargo | Maintain | Overweight | 2026-01-30 |
| Piper Sandler | Maintain | Overweight | 2026-01-26 |
| UBS | Maintain | Buy | 2026-01-26 |
| Bernstein | Maintain | Market Perform | 2026-01-21 |
| Keybanc | Upgrade | Overweight | 2026-01-13 |
| Truist Securities | Maintain | Buy | 2025-12-19 |
| Cantor Fitzgerald | Maintain | Overweight | 2025-12-16 |
| Morgan Stanley | Maintain | Equal Weight | 2025-11-12 |
| Wedbush | Maintain | Outperform | 2025-11-12 |
| Rosenblatt | Maintain | Buy | 2025-11-12 |
Nova Ltd. Grades
Below is a summary of Nova Ltd.’s recent grades from recognized grading companies.
| Grading Company | Action | New Grade | Date |
|---|---|---|---|
| Needham | Upgrade | Buy | 2026-01-20 |
| B of A Securities | Maintain | Buy | 2026-01-13 |
| Jefferies | Maintain | Buy | 2025-12-15 |
| Evercore ISI Group | Maintain | Outperform | 2025-11-07 |
| Benchmark | Maintain | Buy | 2025-11-07 |
| Cantor Fitzgerald | Maintain | Overweight | 2025-06-24 |
| B of A Securities | Maintain | Buy | 2025-06-24 |
| Citigroup | Maintain | Buy | 2025-05-09 |
| Benchmark | Maintain | Buy | 2025-05-09 |
| B of A Securities | Maintain | Buy | 2025-04-16 |
Which company has the best grades?
Both companies receive predominantly positive grades. AMD has several “Buy” and “Overweight” ratings with a few “Market Perform” and “Equal Weight” grades. Nova Ltd. shows a consistent series of “Buy,” “Outperform,” and “Overweight” ratings, with recent upgrades. Investors may view Nova Ltd.’s steadier positive trend as a signal of sustained confidence from institutions.
Risks specific to each company
The following categories identify critical pressure points and systemic threats facing Advanced Micro Devices, Inc. (AMD) and Nova Ltd. (NVMI) in the 2026 market environment:
1. Market & Competition
Advanced Micro Devices, Inc. (AMD)
- Faces intense rivalry in the semiconductor sector with rapid innovation cycles and strong competitors like Intel and Nvidia.
Nova Ltd. (NVMI)
- Operates in a niche semiconductor metrology segment but competes with specialized global firms and emerging technologies.
2. Capital Structure & Debt
Advanced Micro Devices, Inc. (AMD)
- Exhibits a favorable debt profile with strong interest coverage and low leverage, enhancing financial stability.
Nova Ltd. (NVMI)
- Maintains low debt levels and excellent interest coverage, though a slightly higher debt-to-equity ratio requires monitoring.
3. Stock Volatility
Advanced Micro Devices, Inc. (AMD)
- Displays high beta (1.95), indicating above-market volatility and sensitivity to sector swings.
Nova Ltd. (NVMI)
- Also volatile with beta at 1.82, reflecting exposure to semiconductor cycle fluctuations and market sentiment.
4. Regulatory & Legal
Advanced Micro Devices, Inc. (AMD)
- Subject to U.S. and international tech regulations, including export controls and antitrust scrutiny.
Nova Ltd. (NVMI)
- Faces complex regulatory regimes across Israel, Taiwan, and China, with potential geopolitical legal risks.
5. Supply Chain & Operations
Advanced Micro Devices, Inc. (AMD)
- Relies on global foundries and component suppliers; vulnerable to chip shortages and logistical disruptions.
Nova Ltd. (NVMI)
- Dependent on precision manufacturing and global supply chains, with risks in raw material access and geopolitical tensions.
6. ESG & Climate Transition
Advanced Micro Devices, Inc. (AMD)
- Increasing ESG commitments but faces pressure to reduce carbon footprint in energy-intensive chip production.
Nova Ltd. (NVMI)
- Emerging ESG policies; must manage environmental impact amid growing climate transition demands in tech manufacturing.
7. Geopolitical Exposure
Advanced Micro Devices, Inc. (AMD)
- Significant U.S.-China tensions affect supply chains and market access, posing strategic risks.
Nova Ltd. (NVMI)
- High geopolitical risk due to Israel base and exposure to Asian manufacturing hubs amid regional instability.
Which company shows a better risk-adjusted profile?
AMD’s most impactful risk lies in fierce market competition and high stock volatility. NVMI’s key risk stems from geopolitical exposure and regulatory complexity. Despite AMD’s unfavorable financial ratios, it benefits from robust scale and debt control. NVMI shows stronger profitability and financial metrics but faces higher geopolitical uncertainty. Overall, AMD offers a better risk-adjusted profile due to its scale, liquidity, and capital structure resilience, offsetting market and volatility risks seen in 2026 trading data.
Final Verdict: Which stock to choose?
Advanced Micro Devices, Inc. (AMD) shines with its rapid revenue growth and strong income quality, demonstrating a cash-generating engine fueled by aggressive R&D. However, its declining return on invested capital signals caution. AMD suits investors targeting aggressive growth but willing to tolerate operational risks.
Nova Ltd. (NVMI) offers a strategic moat through steadily improving profitability and a favorable capital structure. Its robust margins and growing ROIC suggest increasing efficiency and competitive strength. NVMI fits well in GARP portfolios seeking a balance of growth potential and financial stability.
If you prioritize aggressive expansion and innovation, AMD’s dynamic growth trajectory outshines due to its strong income momentum despite weakening capital returns. However, if you seek a more stable investment with improving profitability and a clearer path to value creation, NVMI offers better stability and an emerging competitive advantage. Both present analytical scenarios for distinct investor profiles.
Disclaimer: Investment carries a risk of loss of initial capital. The past performance is not a reliable indicator of future results. Be sure to understand risks before making an investment decision.
Go Further
I encourage you to read the complete analyses of Advanced Micro Devices, Inc. and Nova Ltd. to enhance your investment decisions: