Home > Comparison > Technology > AMD vs MU
The strategic rivalry between Advanced Micro Devices, Inc. and Micron Technology, Inc. shapes the semiconductor sector’s evolution. AMD operates as a diversified chip designer with strong computing and graphics segments. Micron focuses on memory and storage manufacturing, emphasizing high-volume production. This analysis pits AMD’s innovation-driven growth against Micron’s scale-driven value, aiming to identify which offers a superior risk-adjusted return for a diversified portfolio.
Table of contents
Companies Overview
Advanced Micro Devices and Micron Technology anchor the semiconductor sector with complementary yet distinct market roles.
Advanced Micro Devices, Inc.: Semiconductor Innovator in Computing and Graphics
Advanced Micro Devices dominates as a global semiconductor company focused on processors and graphics solutions. Its revenue engine drives from two segments: Computing and Graphics, plus Enterprise, Embedded, and Semi-Custom. In 2026, AMD sharpens its strategic focus on high-performance CPUs and GPUs for PCs, servers, and consoles, leveraging its Ryzen and EPYC brands to capture premium market share.
Micron Technology, Inc.: Memory and Storage Specialist
Micron Technology leads as a specialist in memory and storage products with a diverse portfolio including DRAM, NAND, and NOR products. Its revenue streams flow from four business units targeting cloud, mobile, storage, and embedded markets. In 2026, Micron intensifies development in high-speed memory technologies, emphasizing enterprise SSDs and mobile solutions under its Micron and Crucial brands to strengthen market penetration.
Strategic Collision: Similarities & Divergences
Both companies thrive in semiconductors but diverge sharply: AMD competes on advanced processor and graphics architectures, while Micron excels in memory and storage innovation. Their primary battleground lies in supplying critical components to cloud data centers and consumer devices. AMD offers a growth profile focused on product innovation and integration; Micron presents a more capital-intensive model driven by memory cycle dynamics and scale efficiencies.
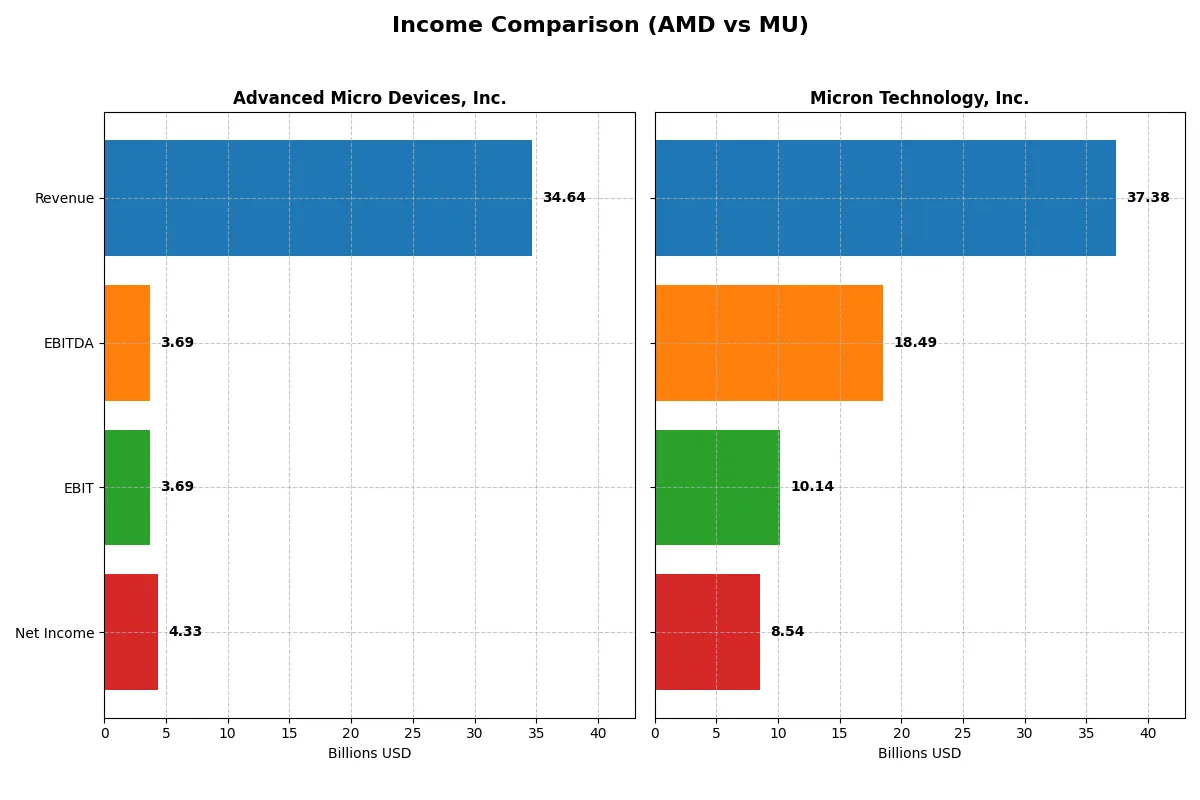
Income Statement Comparison
This data dissects the core profitability and scalability of both corporate engines to reveal who dominates the bottom line:
| Metric | Advanced Micro Devices, Inc. (AMD) | Micron Technology, Inc. (MU) |
|---|---|---|
| Revenue | 34.6B | 37.4B |
| Cost of Revenue | 17.5B | 22.5B |
| Operating Expenses | 13.5B | 5.0B |
| Gross Profit | 17.2B | 14.9B |
| EBITDA | 3.7B | 18.5B |
| EBIT | 3.7B | 10.1B |
| Interest Expense | 131M | 477M |
| Net Income | 4.3B | 8.5B |
| EPS | 2.67 | 7.65 |
| Fiscal Year | 2025 | 2025 |
Income Statement Analysis: The Bottom-Line Duel
This income statement comparison reveals which company operates with greater efficiency and sustainable profit generation.
Advanced Micro Devices, Inc. (AMD) Analysis
AMD’s revenue surged from $16.4B in 2021 to $34.6B in 2025, doubling over five years. Net income rose sharply to $4.3B in 2025, reflecting strong momentum. Gross margin held steady near 49.5%, signaling efficient cost control. The 2025 net margin at 12.5% points to solid profitability despite rising expenses.
Micron Technology, Inc. (MU) Analysis
Micron’s revenue expanded from $27.7B in 2021 to $37.4B in 2025, a 35% growth. Net income rebounded impressively to $8.5B in 2025 after a volatile period. Gross margin at nearly 40% and a robust net margin of 22.8% in 2025 highlight superior operational leverage. MU’s EBIT margin soared to 27.1%, underscoring strong cost efficiency.
Margin Strength vs. Revenue Momentum
Both firms exhibit favorable growth, but Micron commands higher margins and net income in 2025, reflecting superior capital efficiency. AMD shows rapid revenue expansion but with thinner margins. For investors focused on profitability and margin resilience, Micron’s profile appears more attractive, while AMD suits those prioritizing top-line growth.
Financial Ratios Comparison
These vital ratios act as a diagnostic tool to expose the underlying fiscal health, valuation premiums, and capital efficiency of the companies compared below:
| Ratios | Advanced Micro Devices, Inc. (AMD) | Micron Technology, Inc. (MU) |
|---|---|---|
| ROE | 2.85% (2024) | 15.76% (2025) |
| ROIC | 2.49% (2024) | 12.12% (2025) |
| P/E | 124 (2024) | 15.94 (2025) |
| P/B | 3.52 (2024) | 2.51 (2025) |
| Current Ratio | 2.62 (2024) | 2.52 (2025) |
| Quick Ratio | 1.83 (2024) | 1.79 (2025) |
| D/E | 0.038 (2024) | 0.282 (2025) |
| Debt-to-Assets | 3.20% (2024) | 18.45% (2025) |
| Interest Coverage | 20.65 (2024) | 20.69 (2025) |
| Asset Turnover | 0.37 (2024) | 0.45 (2025) |
| Fixed Asset Turnover | 10.63 (2024) | 0.79 (2025) |
| Payout ratio | 0% (2024) | 6.11% (2025) |
| Dividend yield | 0% (2024) | 0.38% (2025) |
| Fiscal Year | 2024 | 2025 |
Efficiency & Valuation Duel: The Vital Signs
Financial ratios act as the company’s DNA, uncovering hidden risks and revealing operational excellence beyond headline figures.
Advanced Micro Devices, Inc.
AMD shows a favorable net margin of 12.51%, yet its return on equity and invested capital stand at zero, signaling weak profitability efficiency. The stock appears stretched with a P/E of 80.54, far above industry norms. It pays no dividend, relying heavily on research and development, which consumes about 25% of revenue, to fuel growth.
Micron Technology, Inc.
Micron delivers a robust net margin of 22.84% and a solid ROE of 15.76%, reflecting efficient capital use. Its P/E ratio at 15.94 looks fairly valued compared to peers. Micron maintains a modest dividend yield of 0.38%, balancing shareholder returns with reinvestment in R&D, which accounts for roughly 10% of revenue, supporting sustainable innovation.
Valuation Stretch vs. Profitability Balance
Micron offers a better balance of profitability and valuation, with more favorable ratios and shareholder returns. AMD’s stretched valuation and lack of profitability metrics present higher risk. Investors seeking operational safety may prefer Micron’s steadier profile, while growth-focused investors might tolerate AMD’s premium valuation.
Which one offers the Superior Shareholder Reward?
I compare AMD and Micron’s shareholder reward through their dividend policies and buybacks. AMD pays no dividends, focusing on reinvestment with free cash flow per share of 3.4 and zero payout ratio. Micron yields 0.38–0.48%, with a modest payout ratio near 6%, signaling steady income. AMD’s aggressive reinvestment supports growth in a capital-intensive sector, enhancing long-term value. Micron’s consistent dividend and moderate buybacks offer immediate, albeit smaller, returns. AMD shows no buybacks recently, while Micron maintains active buybacks aligned with its dividend. I judge AMD’s model more sustainable for total return in 2026, given its robust free cash flow and growth focus, despite a lack of direct income. Investors seeking capital appreciation prefer AMD; income-focused investors may lean toward Micron. Overall, I favor AMD for superior shareholder reward in this market cycle.
Comparative Score Analysis: The Strategic Profile
The radar chart reveals the fundamental DNA and trade-offs of Advanced Micro Devices, Inc. and Micron Technology, Inc., highlighting their financial strengths and valuation nuances:
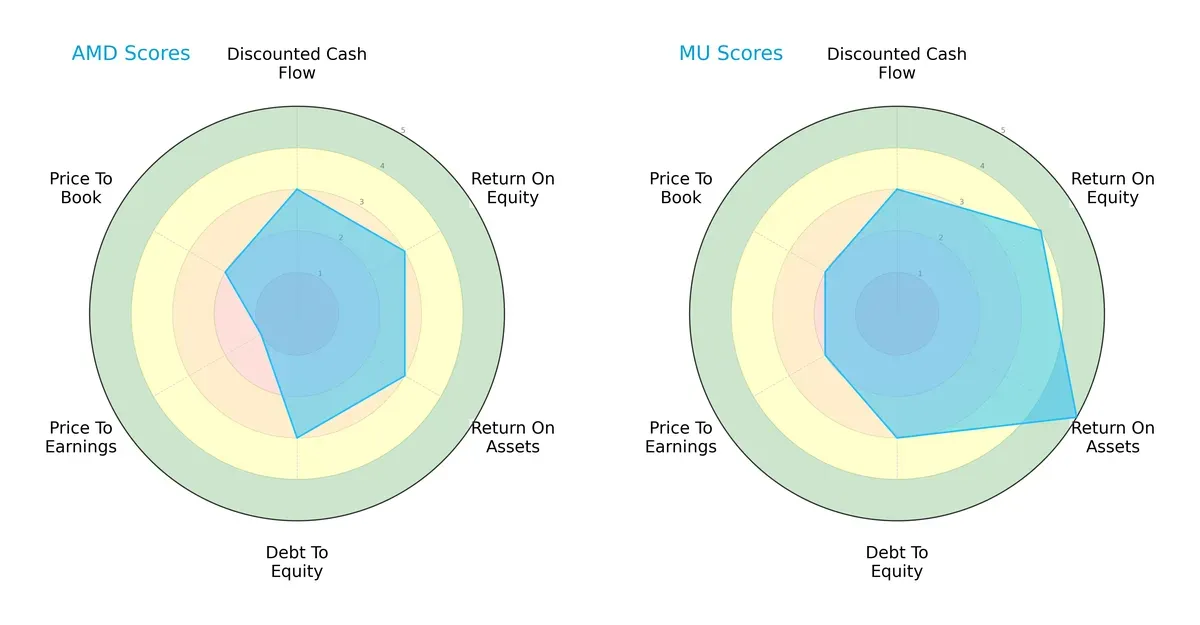
Both companies share moderate scores in DCF and debt-to-equity, indicating balanced capital allocation and financial risk. Micron leads with superior profitability metrics—ROE (4 vs. 3) and ROA (5 vs. 3)—showcasing more efficient asset and equity utilization. However, AMD’s valuation scores lag, especially in P/E (1 vs. 2), signaling possible overvaluation risks. Micron presents a more balanced profile, while AMD relies on specific operational strengths overshadowed by valuation concerns.
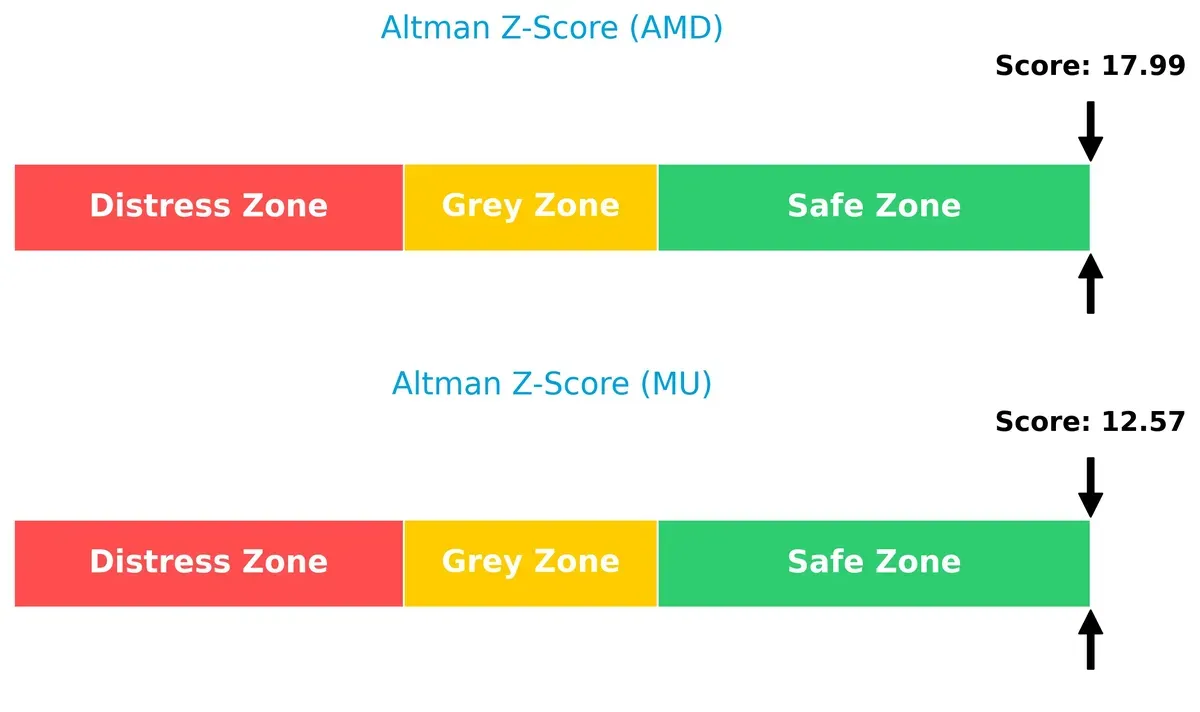
Bankruptcy Risk: Solvency Showdown
Micron’s Altman Z-Score of 12.6 versus AMD’s 18.0 places both firmly in the safe zone, underlining robust solvency and low bankruptcy risk in this cycle:
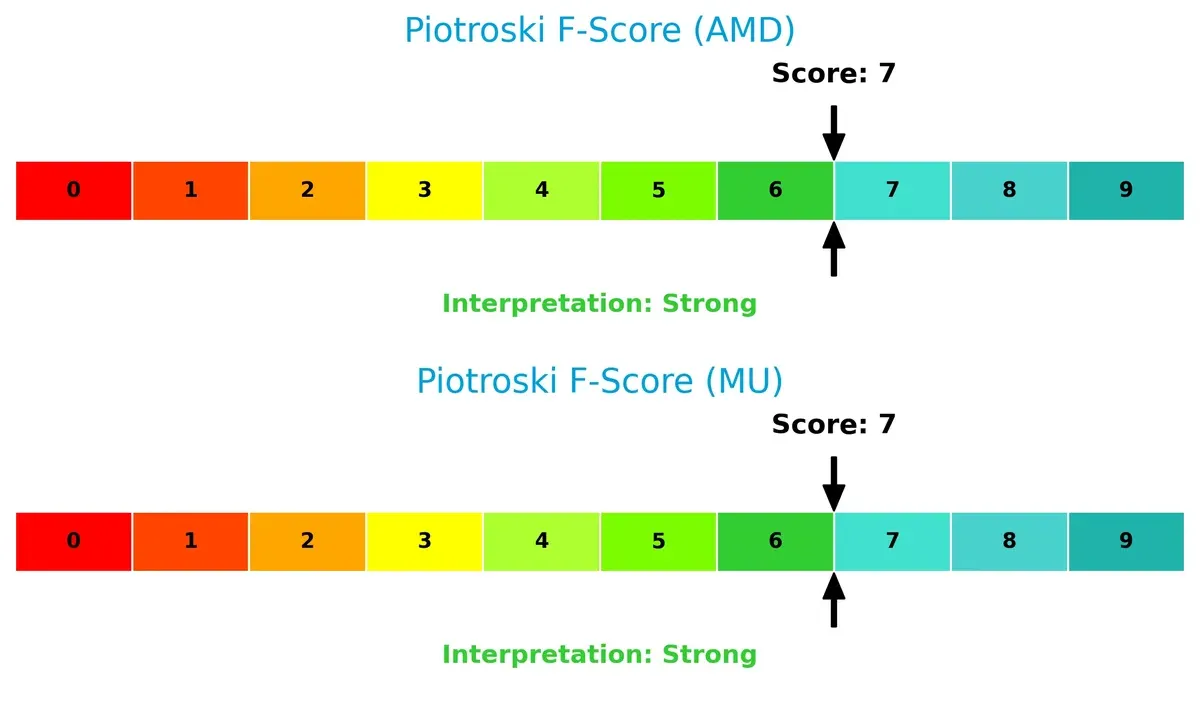
Financial Health: Quality of Operations
Both firms score a strong 7 on the Piotroski F-Score, reflecting solid internal financial health with no immediate red flags in profitability, leverage, or liquidity metrics:
How are the two companies positioned?
This section dissects the operational DNA of AMD and Micron by comparing their revenue distribution by segment and internal dynamics. The goal is to confront their economic moats and identify which business model offers the most resilient, sustainable competitive advantage today.
Revenue Segmentation: The Strategic Mix
This visual comparison dissects how Advanced Micro Devices and Micron Technology diversify their income streams and where their primary sector bets lie:
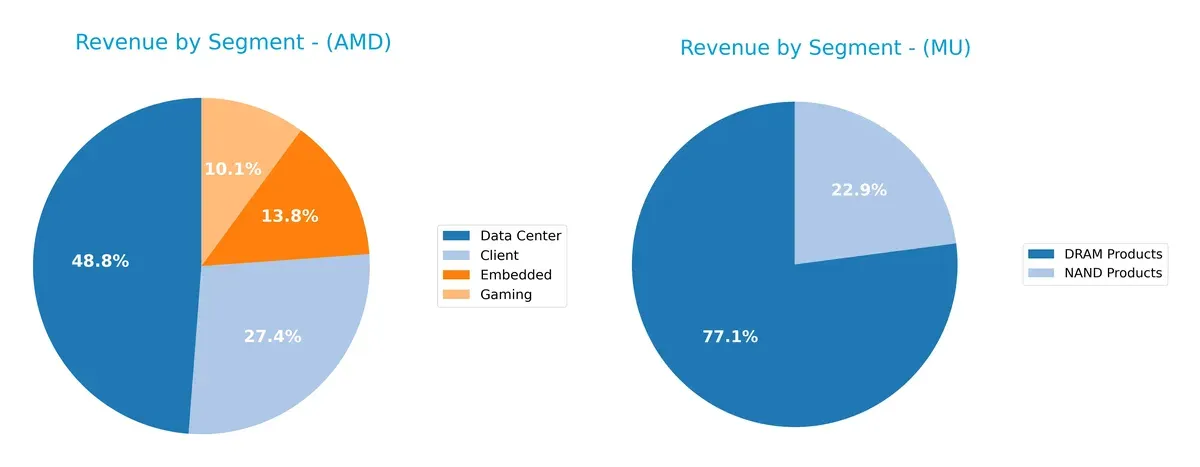
AMD’s revenue pivots on Data Center at $12.6B, with robust Client ($7.1B), Embedded ($3.6B), and Gaming ($2.6B) segments, showing a balanced portfolio. Micron leans heavily on DRAM Products at $28.6B, dwarfing NAND at $8.5B, indicating concentration risk but infrastructure dominance. AMD’s diversified mix supports ecosystem lock-in, while Micron’s reliance on memory chips exposes it to market cyclicality.
Strengths and Weaknesses Comparison
This table compares the strengths and weaknesses of Advanced Micro Devices, Inc. (AMD) and Micron Technology, Inc. (MU):
AMD Strengths
- Diversified revenue streams across Client, Data Center, Embedded, and Gaming segments
- Favorable net margin at 12.51%
- Strong interest coverage ratio of 28.2 indicates solid debt servicing ability
- Low debt-to-assets ratio reflecting prudent leverage management
MU Strengths
- Higher net margin at 22.84% and favorable ROE of 15.76%
- Strong liquidity with current ratio 2.52 and quick ratio 1.79
- Diversified product segments including DRAM and NAND
- Favorable debt metrics with 0.28 debt-to-equity and 18.45% debt-to-assets ratios
AMD Weaknesses
- Unfavorable ROE and ROIC of 0% indicating weak capital efficiency
- High WACC at 12.94% exceeding ROIC
- Unfavorable liquidity ratios with zero current and quick ratios reported
- High P/E ratio at 80.54 suggests overvaluation risk
- Weak asset turnover metrics reflecting inefficiency
- No dividend yield
MU Weaknesses
- ROIC of 12.12% below WACC of 22.1% signals value destruction
- Unfavorable asset and fixed asset turnover ratios
- Slightly unfavorable dividend yield at 0.38%
- Neutral valuation metrics with P/E 15.94 and PB 2.51
- Lower interest coverage than AMD at 21.26
Both companies demonstrate diversification and solid profitability in key product segments. AMD faces challenges in capital efficiency and liquidity, while MU shows stronger profitability but struggles with asset utilization and capital returns versus cost of capital. These factors shape their strategic focus on operational efficiency and financial structure optimization.
The Moat Duel: Analyzing Competitive Defensibility
A structural moat is the only reliable shield protecting long-term profits from relentless competition erosion. Let’s dissect how these two semiconductor giants defend their turf:
Advanced Micro Devices, Inc. (AMD): Innovation-Driven Intangible Asset Moat
AMD’s competitive edge lies in its cutting-edge chip designs and ecosystem partnerships. Despite strong revenue growth and margin stability, its declining ROIC signals weakening capital efficiency. In 2026, new product launches must reverse this trend to sustain profitability.
Micron Technology, Inc. (MU): Scale-Enabled Cost Advantage Moat
Micron leverages large-scale memory manufacturing to drive cost leadership, contrasting AMD’s innovation moat. Its improving ROIC and robust margin expansion confirm strengthening competitive positioning. Expansion into emerging memory markets could deepen MU’s moat further in 2026.
Innovation Moat vs. Scale Moat: Who Holds the Defensive Advantage?
MU’s growing ROIC and cost advantage build a deeper moat than AMD’s eroding intangible asset moat. Therefore, Micron appears better equipped to defend and expand its market share amid intensifying sector competition.
Which stock offers better returns?
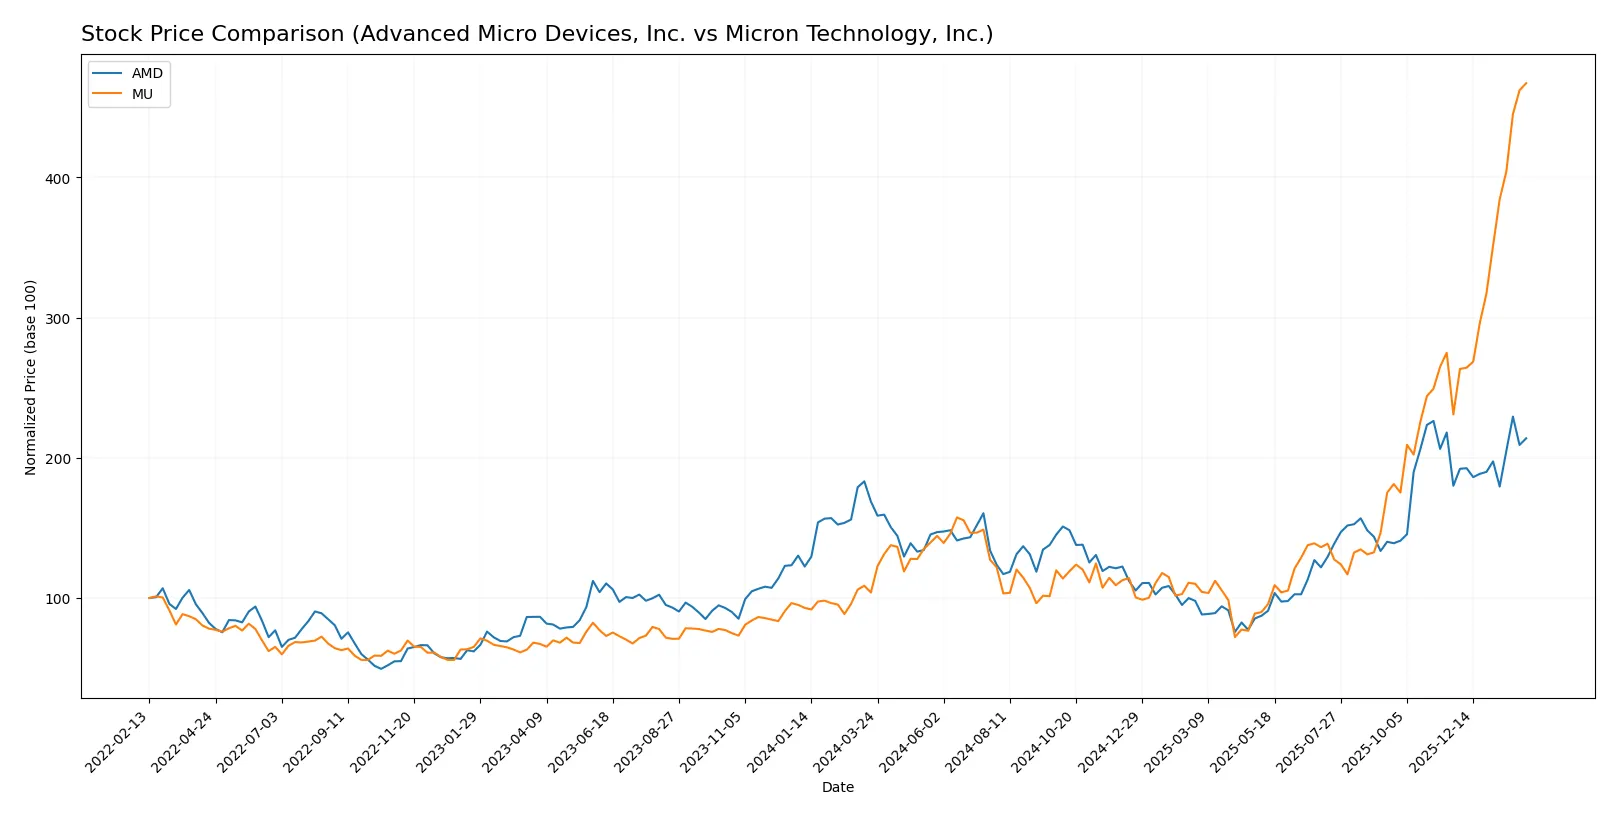
The past year reveals distinct trading dynamics, with both AMD and MU showing notable price appreciation and acceleration in their upward trends, reflecting strong investor interest.
Trend Comparison
Advanced Micro Devices, Inc. (AMD) posted a bullish trend with a 26.72% price increase over 12 months. The trend accelerated, marked by a high of 259.68 and a low of 85.76, with moderate volatility (std dev 41.61).
Micron Technology, Inc. (MU) recorded an even stronger bullish trend, surging 349.8% over the same period. The trend shows acceleration with higher volatility (std dev 75.37), reaching a peak of 419.44 and a trough of 64.72.
Comparing both, MU delivered the highest market performance with a substantially larger price gain and stronger recent acceleration, outperforming AMD clearly in 2026.
Target Prices
Analysts present a bullish consensus for both Advanced Micro Devices and Micron Technology with significant upside potential.
| Company | Target Low | Target High | Consensus |
|---|---|---|---|
| Advanced Micro Devices, Inc. | 225 | 380 | 291.56 |
| Micron Technology, Inc. | 190 | 480 | 345.61 |
The consensus target prices suggest upside of approximately 20% for AMD and about 18% for MU versus current prices, reflecting strong sector momentum and growth expectations.

Don’t Let Luck Decide Your Entry Point
Optimize your entry points with our advanced ProRealTime indicators. You’ll get efficient buy signals with precise price targets for maximum performance. Start outperforming now!
How do institutions grade them?
Institutional grades provide an overview of analyst sentiment for both companies:
Advanced Micro Devices, Inc. Grades
This table summarizes recent analyst grades for Advanced Micro Devices, Inc.
| Grading Company | Action | New Grade | Date |
|---|---|---|---|
| Wells Fargo | Maintain | Overweight | 2026-01-30 |
| Piper Sandler | Maintain | Overweight | 2026-01-26 |
| UBS | Maintain | Buy | 2026-01-26 |
| Bernstein | Maintain | Market Perform | 2026-01-21 |
| Keybanc | Upgrade | Overweight | 2026-01-13 |
| Truist Securities | Maintain | Buy | 2025-12-19 |
| Cantor Fitzgerald | Maintain | Overweight | 2025-12-16 |
| Morgan Stanley | Maintain | Equal Weight | 2025-11-12 |
| Wedbush | Maintain | Outperform | 2025-11-12 |
| Rosenblatt | Maintain | Buy | 2025-11-12 |
Micron Technology, Inc. Grades
This table summarizes recent analyst grades for Micron Technology, Inc.
| Grading Company | Action | New Grade | Date |
|---|---|---|---|
| Mizuho | Maintain | Outperform | 2026-01-27 |
| Stifel | Maintain | Buy | 2026-01-20 |
| Rosenblatt | Maintain | Buy | 2026-01-20 |
| TD Cowen | Maintain | Buy | 2026-01-20 |
| Citigroup | Maintain | Buy | 2026-01-15 |
| Wells Fargo | Maintain | Overweight | 2026-01-15 |
| Cantor Fitzgerald | Maintain | Overweight | 2026-01-14 |
| Keybanc | Maintain | Overweight | 2026-01-13 |
| B of A Securities | Maintain | Buy | 2026-01-13 |
| Lynx Global | Maintain | Buy | 2026-01-12 |
Which company has the best grades?
Both companies receive predominantly positive grades, but Micron Technology holds a slight edge with multiple “Outperform” and consistent “Buy” ratings. This could suggest stronger analyst confidence, potentially influencing investor sentiment favorably.
Risks specific to each company
The following categories identify the critical pressure points and systemic threats facing both firms in the 2026 market environment:
1. Market & Competition
Advanced Micro Devices, Inc.
- Faces fierce competition in CPUs and GPUs with high innovation demands.
Micron Technology, Inc.
- Dominates memory and storage markets but faces pricing pressure and cyclical demand.
2. Capital Structure & Debt
Advanced Micro Devices, Inc.
- Maintains favorable debt ratios; strong interest coverage at 28.2x.
Micron Technology, Inc.
- Also shows favorable debt levels with 18.45% debt-to-assets and solid interest coverage.
3. Stock Volatility
Advanced Micro Devices, Inc.
- High beta at 1.949 indicates elevated stock price volatility.
Micron Technology, Inc.
- Moderate beta at 1.505 suggests lower relative volatility than AMD.
4. Regulatory & Legal
Advanced Micro Devices, Inc.
- Subject to semiconductor export controls and IP litigation risks.
Micron Technology, Inc.
- Faces similar regulatory scrutiny and potential anti-trust concerns globally.
5. Supply Chain & Operations
Advanced Micro Devices, Inc.
- Relies on external foundries; supply chain disruptions impact production.
Micron Technology, Inc.
- Controls manufacturing but exposed to raw material cost fluctuations and capacity constraints.
6. ESG & Climate Transition
Advanced Micro Devices, Inc.
- Increasing pressure to improve sustainability in semiconductor fabrication.
Micron Technology, Inc.
- Focused on reducing environmental footprint but faces challenges in energy-intensive memory production.
7. Geopolitical Exposure
Advanced Micro Devices, Inc.
- Significant exposure to US-China trade tensions affecting supply and sales.
Micron Technology, Inc.
- Also highly vulnerable to geopolitical risks impacting global memory demand and supply chains.
Which company shows a better risk-adjusted profile?
Micron’s strongest risk is cyclical market and pricing pressure, while AMD’s lies in volatile stock behavior and high valuation multiples. Micron’s balanced capital structure and moderate beta yield a better risk-adjusted profile. AMD’s elevated beta and stretched valuation metrics raise caution despite strong innovation. Recent declines in Micron’s stock (-4.18%) reflect sensitivity to market cycles, underscoring its key risk but still presenting a more stable risk/reward balance.
Final Verdict: Which stock to choose?
Advanced Micro Devices, Inc. (AMD) excels as a high-octane growth engine fueled by rapid revenue expansion and robust cash generation. Its main point of vigilance is declining capital efficiency, signaling caution on long-term value creation. AMD suits aggressive growth portfolios willing to embrace operational risks for outsized upside.
Micron Technology, Inc. (MU) benefits from a solid strategic moat anchored in consistent profitability and improving returns on capital. Compared to AMD, MU offers a more balanced risk profile with steadier income and financial stability. It fits well within a GARP portfolio aiming for reliable growth at a reasonable price.
If you prioritize aggressive growth and can tolerate capital efficiency challenges, AMD outshines with its dynamic expansion and cash flow strength. However, if you seek better stability and a proven profitability track record, MU offers superior financial discipline and margin resilience. Each stock caters to distinct investor profiles with contrasting risk-reward trade-offs.
Disclaimer: Investment carries a risk of loss of initial capital. The past performance is not a reliable indicator of future results. Be sure to understand risks before making an investment decision.
Go Further
I encourage you to read the complete analyses of Advanced Micro Devices, Inc. and Micron Technology, Inc. to enhance your investment decisions: