Home > Comparison > Technology > AMD vs MCHP
The strategic rivalry between Advanced Micro Devices, Inc. (AMD) and Microchip Technology Incorporated (MCHP) shapes the semiconductor industry’s future. AMD operates as a diversified, high-performance chipmaker spanning computing and graphics, while Microchip focuses on embedded control solutions with broad industrial applications. This head-to-head contrasts AMD’s growth-driven innovation with Microchip’s steady, specialized market approach. This analysis will determine which trajectory offers superior risk-adjusted returns for a diversified technology portfolio.
Table of contents
Companies Overview
Advanced Micro Devices, Inc. and Microchip Technology Incorporated stand as pivotal players in the semiconductor market.
Advanced Micro Devices, Inc.: High-Performance Computing Leader
Advanced Micro Devices, Inc. dominates as a semiconductor giant, generating revenue primarily through processors and graphics units for PCs, servers, and gaming consoles. Its 2026 strategy emphasizes innovation in x86 microprocessors and accelerated processing units, leveraging its computing and graphics segments to capture high-growth tech markets.
Microchip Technology Incorporated: Embedded Control Solutions Specialist
Microchip Technology Incorporated excels in embedded control solutions, selling microcontrollers and analog products across automotive, industrial, and communication sectors. In 2026, it focuses on expanding its footprint in specialized microcontrollers and mixed-signal devices, aiming to strengthen its position in secure, connected embedded systems worldwide.
Strategic Collision: Similarities & Divergences
Both companies operate in semiconductors but pursue distinct philosophies: AMD leads with high-performance computing and graphics, while Microchip targets embedded and specialized control markets. Their primary battleground is the growing demand for smart, connected devices. Each offers a contrasting investment profile: AMD pursues aggressive innovation and scale, whereas Microchip focuses on steady niche dominance and secure embedded applications.
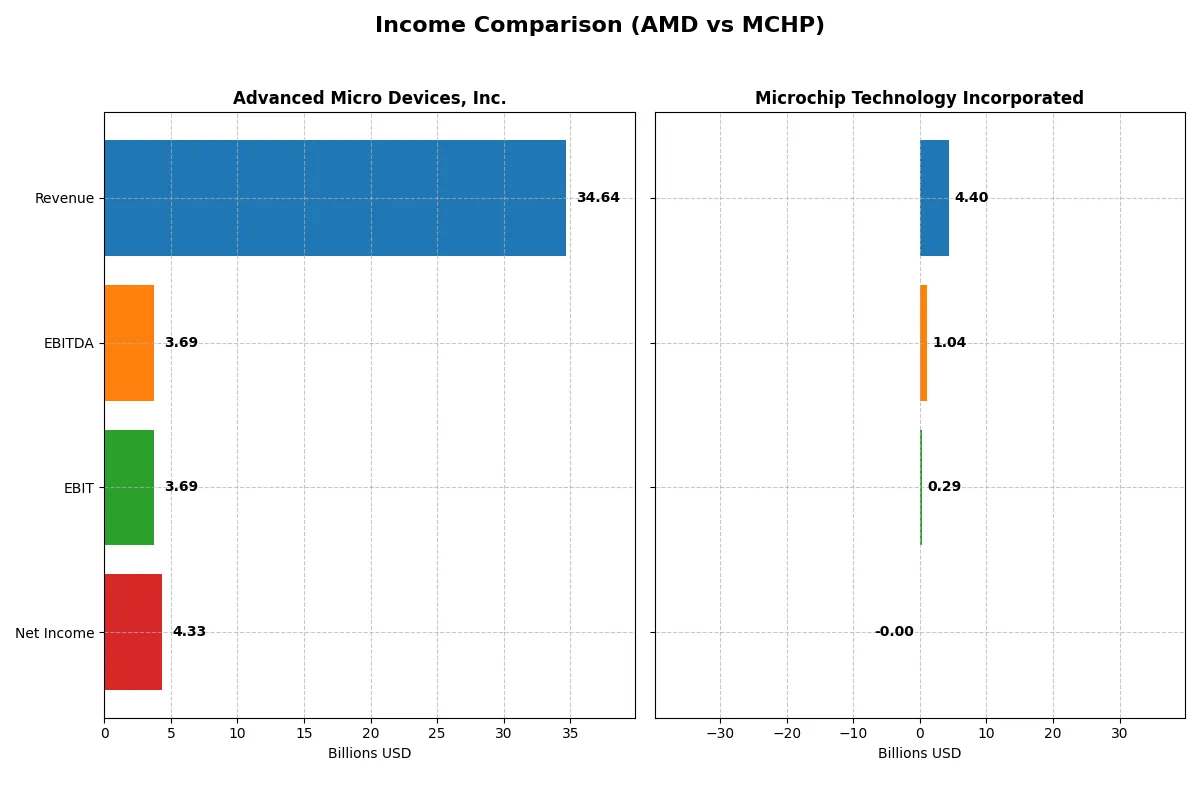
Income Statement Comparison
This data dissects the core profitability and scalability of both corporate engines to reveal who dominates the bottom line:
| Metric | Advanced Micro Devices, Inc. (AMD) | Microchip Technology Incorporated (MCHP) |
|---|---|---|
| Revenue | 34.6B | 4.4B |
| Cost of Revenue | 17.5B | 1.9B |
| Operating Expenses | 13.5B | 2.2B |
| Gross Profit | 17.2B | 2.5B |
| EBITDA | 3.7B | 1.0B |
| EBIT | 3.7B | 290M |
| Interest Expense | 131M | 251M |
| Net Income | 4.3B | -2.7M |
| EPS | 2.67 | -0.005 |
| Fiscal Year | 2025 | 2025 |
Income Statement Analysis: The Bottom-Line Duel
This income statement comparison reveals which company drives greater efficiency and profitability through its core business operations.
Advanced Micro Devices, Inc. (AMD) Analysis
AMD shows a robust revenue climb from $16.4B in 2021 to $34.6B in 2025, nearly doubling over five years. Net income surged from $3.16B to $4.34B, reflecting solid profit expansion. Its gross margin remains strong at 49.5%, with net margin at a healthy 12.5% in 2025, signaling efficient cost control and improving operational momentum.
Microchip Technology Incorporated (MCHP) Analysis
MCHP’s revenue peaked at $8.44B in 2023 but fell sharply to $4.4B by 2025, marking a significant contraction. The company swung from a $2.24B net income in 2023 to a $2.7M net loss in 2025. Despite a healthy gross margin of 56%, the net margin turned negative in 2025, indicating rising costs and deteriorating profitability amid declining sales.
Growth and Margin Strength vs. Decline and Margin Pressure
AMD outpaces MCHP with sustained revenue growth and expanding net income, driven by strong margin management and operational efficiency. MCHP faces severe revenue and profit declines, eroding its net margin despite decent gross margins. For investors, AMD’s profile offers a clearer trajectory of profitability and growth resilience.
Financial Ratios Comparison
These vital ratios act as a diagnostic tool to expose the underlying fiscal health, valuation premiums, and capital efficiency of the companies compared below:
| Ratios | Advanced Micro Devices, Inc. (AMD) | Microchip Technology Incorporated (MCHP) |
|---|---|---|
| ROE | 2.85% (2024) | 28.64% (2024) |
| ROIC | 2.49% (2024) | 14.40% (2024) |
| P/E | 124 (2024) | 25.51 (2024) |
| P/B | 3.52 (2024) | 7.31 (2024) |
| Current Ratio | 2.62 (2024) | 1.20 (2024) |
| Quick Ratio | 1.83 (2024) | 0.67 (2024) |
| D/E | 0.04 (2024) | 0.91 (2024) |
| Debt-to-Assets | 3.20% (2024) | 38.00% (2024) |
| Interest Coverage | 20.65 (2024) | 12.97 (2024) |
| Asset Turnover | 0.37 (2024) | 0.48 (2024) |
| Fixed Asset Turnover | 10.63 (2024) | 6.39 (2024) |
| Payout Ratio | 0% (2024) | 48% (2024) |
| Dividend Yield | 0% (2024) | 1.87% (2024) |
| Fiscal Year | 2024 | 2024 |
Efficiency & Valuation Duel: The Vital Signs
Ratios act as a company’s DNA, uncovering hidden risks and operational strengths critical for investment insight.
Advanced Micro Devices, Inc.
AMD posts a favorable net margin of 12.51% but suffers from zero ROE and ROIC, flagging profitability concerns versus its 12.94% WACC. The stock trades at a stretched P/E of 80.54, indicating high growth expectations. AMD reinvests heavily in R&D (25% of revenue), foregoing dividends to fuel innovation and future expansion.
Microchip Technology Incorporated
MCHP shows negative profitability metrics with a net margin near zero and unfavorable ROE and ROIC. Its P/E is artificially favorable due to negative earnings, while a 3.67 P/B ratio suggests valuation pressure. The company maintains solid liquidity with a 2.59 current ratio and pays a 3.75% dividend yield, returning cash directly to shareholders amid operational challenges.
Premium Valuation vs. Operational Safety
AMD’s premium valuation reflects aggressive growth bets offset by weak returns on capital. MCHP offers stronger liquidity and shareholder income but struggles with profitability and operational efficiency. Investors seeking growth might lean toward AMD’s innovation profile; those prioritizing income and stability may prefer MCHP’s dividend and balance sheet resilience.
Which one offers the Superior Shareholder Reward?
I compare Advanced Micro Devices (AMD) and Microchip Technology (MCHP) by their shareholder reward strategies. AMD pays no dividends and focuses on reinvestment, evident in a 0% dividend yield and zero payout ratio. Its free cash flow per share rose to 3.4 in 2025, supporting growth investments. Buybacks are critical for AMD’s total return but data on buyback intensity is limited. MCHP yields 1.87% in 2025, with a moderate payout ratio near 48%, balancing income with retained earnings. Its free cash flow per share stands at 4.8, funding consistent dividends and buybacks. MCHP’s leverage is higher (debt-to-equity ~0.8), adding risk but enabling distributions. I see MCHP’s distribution as more tangible and sustainable in 2026, offering superior total return for income-focused investors, while AMD suits growth-oriented portfolios.
Comparative Score Analysis: The Strategic Profile
The radar chart reveals the fundamental DNA and trade-offs of Advanced Micro Devices, Inc. (AMD) and Microchip Technology Incorporated (MCHP):
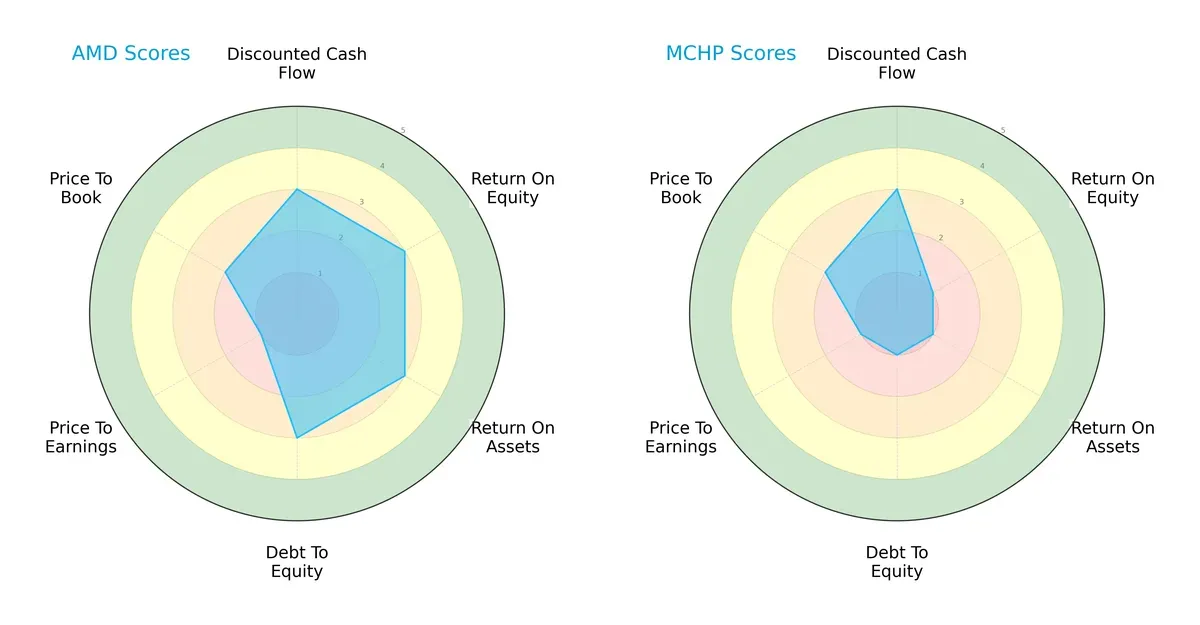
AMD presents a balanced profile with moderate scores in DCF, ROE, ROA, and Debt/Equity, signaling steady operational efficiency and manageable leverage. MCHP, however, relies heavily on its DCF score while lagging significantly in profitability and financial risk metrics. AMD’s diversified strengths contrast with MCHP’s concentrated weakness, making AMD the more resilient choice.
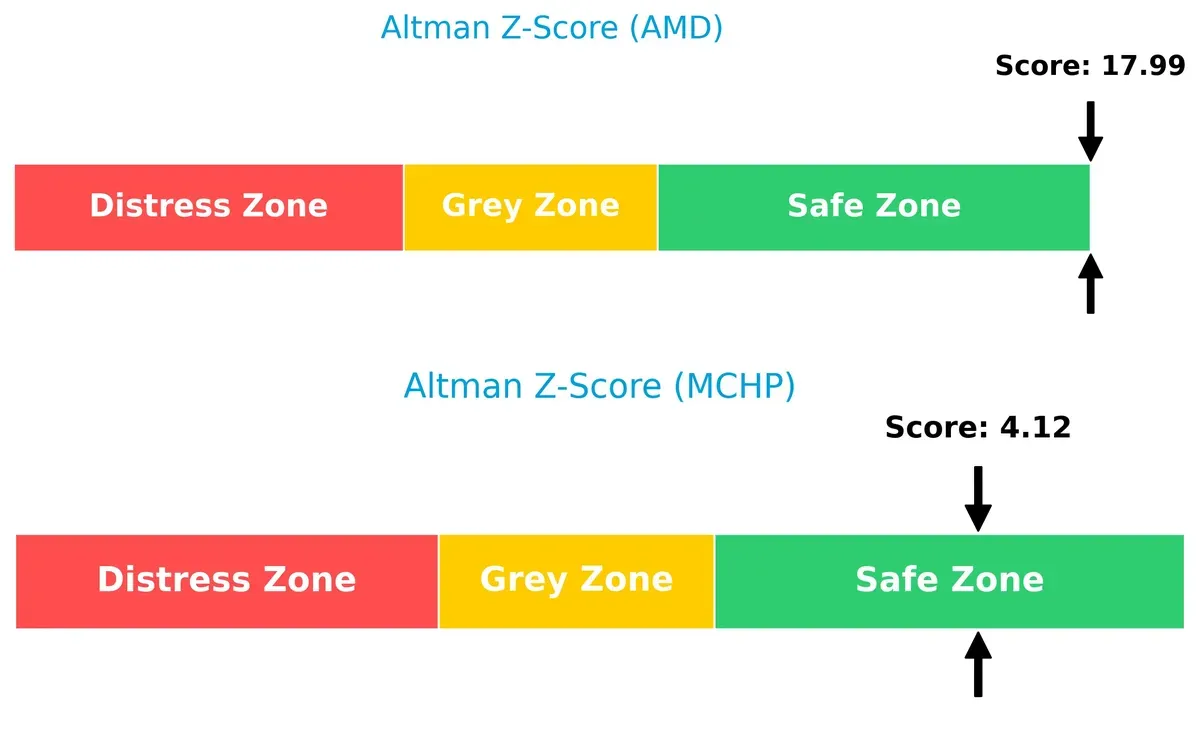
Bankruptcy Risk: Solvency Showdown
The Altman Z-Score gap shows AMD’s exceptional solvency, with a score near 18, vastly outperforming MCHP’s safer but modest 4.1 score, indicating AMD’s stronger long-term survival potential:
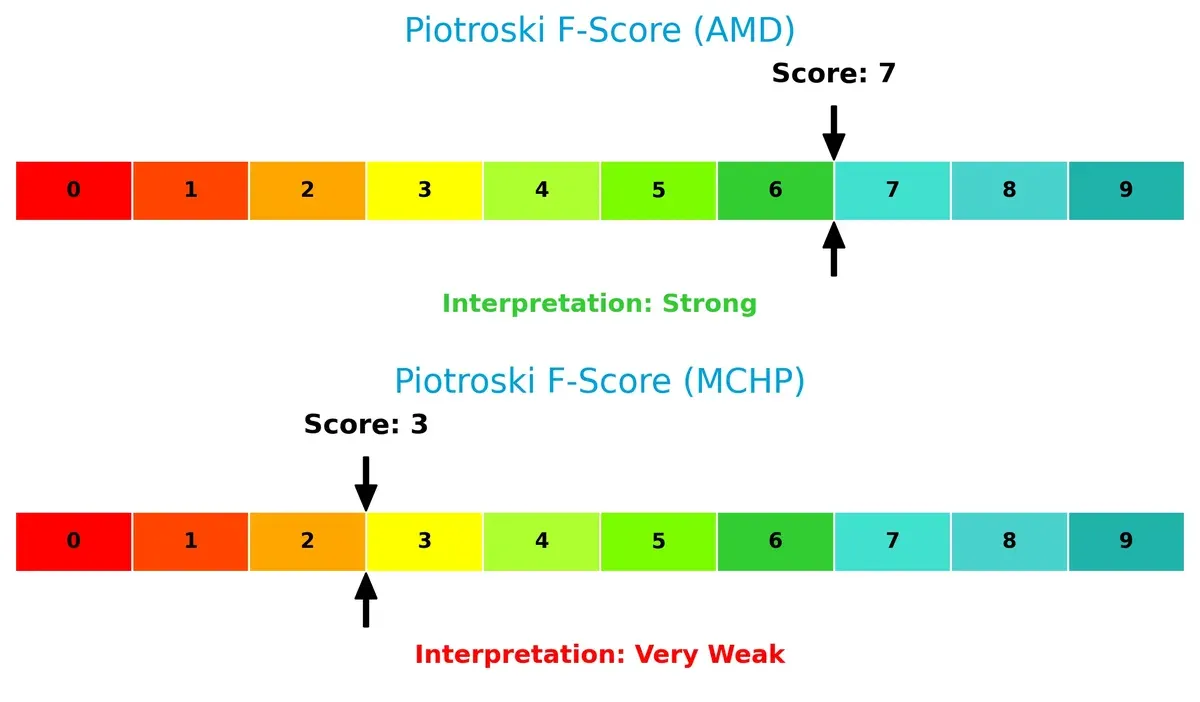
Financial Health: Quality of Operations
AMD’s Piotroski F-Score of 7 signals strong financial health, while MCHP’s score of 3 highlights internal weaknesses and potential red flags in operational quality:
How are the two companies positioned?
This section dissects AMD and MCHP’s operational DNA by comparing revenue distribution and internal dynamics. The goal is to confront their economic moats to identify which model offers the most resilient, sustainable advantage today.
Revenue Segmentation: The Strategic Mix
This comparison dissects how Advanced Micro Devices and Microchip Technology diversify their income streams and where their primary sector bets lie:
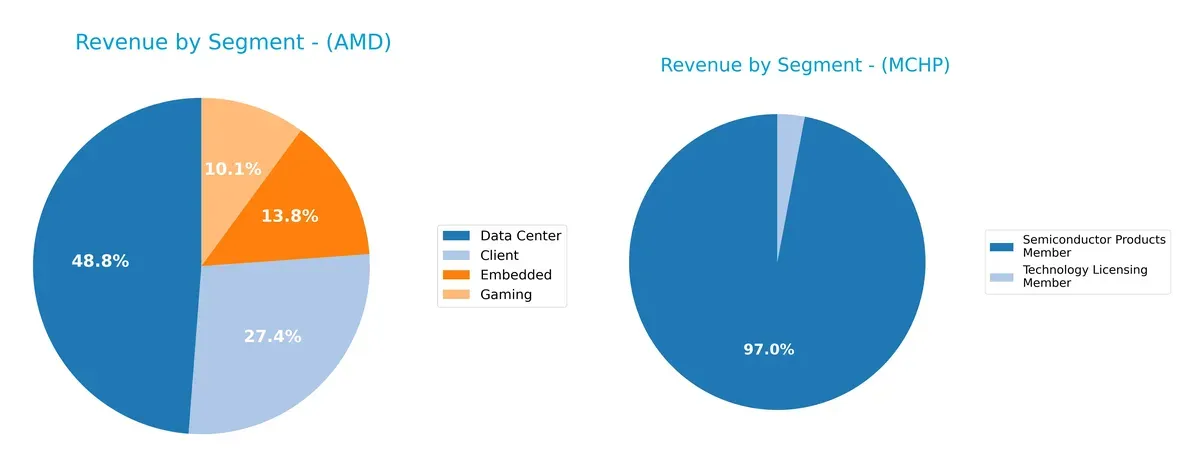
AMD’s revenue splits across four robust segments, led by Data Center at $12.6B and Client at $7.1B, showcasing a balanced, multi-pronged growth strategy. In contrast, Microchip leans heavily on its Semiconductor Products segment with $7.5B in 2024, while Technology Licensing remains a minor $100M stream. AMD’s diversified mix mitigates concentration risk and leverages ecosystem lock-in. Microchip’s reliance on one core segment signals infrastructure dominance but also potential vulnerability to market shifts.
Strengths and Weaknesses Comparison
This table compares the strengths and weaknesses of AMD and MCHP based on diversification, profitability, financials, innovation, global presence, and market share:
AMD Strengths
- Diversified revenues across Client, Data Center, Embedded, Gaming segments
- Favorable net margin at 12.51%
- Low debt-to-assets ratio and strong interest coverage at 28.2
- Significant global presence, especially in the US and China markets
MCHP Strengths
- Favorable current and quick ratios indicating strong liquidity
- Positive dividend yield at 3.75%
- Favorable fixed asset turnover suggests efficient use of assets
- Technology Licensing provides additional revenue stream
AMD Weaknesses
- Unfavorable ROE and ROIC indicate weak capital returns
- High WACC at 12.94% surpasses ROIC, signaling value destruction
- Unfavorable current and quick ratios imply liquidity concerns
- High P/E ratio at 80.54 suggests overvaluation risk
MCHP Weaknesses
- Negative net margin, ROE, and ROIC reflect profitability struggles
- Low interest coverage at 1.15 points to potential debt service risk
- Unfavorable asset turnover signals inefficiency
- Higher P/B ratio at 3.67 may indicate overvaluation
Overall, AMD shows strength in diversified revenue and financial stability but faces challenges in capital efficiency and liquidity. MCHP demonstrates solid liquidity and asset use but struggles with profitability and debt coverage. These contrasts highlight differing strategic focuses and risk profiles.
The Moat Duel: Analyzing Competitive Defensibility
A structural moat is the only barrier protecting long-term profits from relentless competitive erosion in technology sectors:
Advanced Micro Devices, Inc.: Innovation-Driven Product Ecosystem
AMD’s moat stems from its cutting-edge CPU and GPU architectures, driving high gross margins near 50%. Despite declining ROIC, strong revenue growth and expanding data center presence could deepen its moat in 2026.
Microchip Technology Incorporated: Specialized Embedded Solutions
Microchip’s moat relies on deep customer integration via specialized microcontrollers and analog products, supporting stable gross margins above 56%. However, shrinking revenue and negative net margins signal weakening defensibility compared to AMD’s dynamic innovation.
Innovation Velocity vs. Embedded Specialization
AMD’s broader and growth-oriented moat outpaces Microchip’s niche focus, despite both showing declining ROIC trends. AMD is better positioned to defend and expand market share through product innovation and global scale.
Which stock offers better returns?
The past year reveals contrasting dynamics: AMD’s stock price surged notably, while Microchip Technology saw a significant decline followed by a sharp recent rebound.
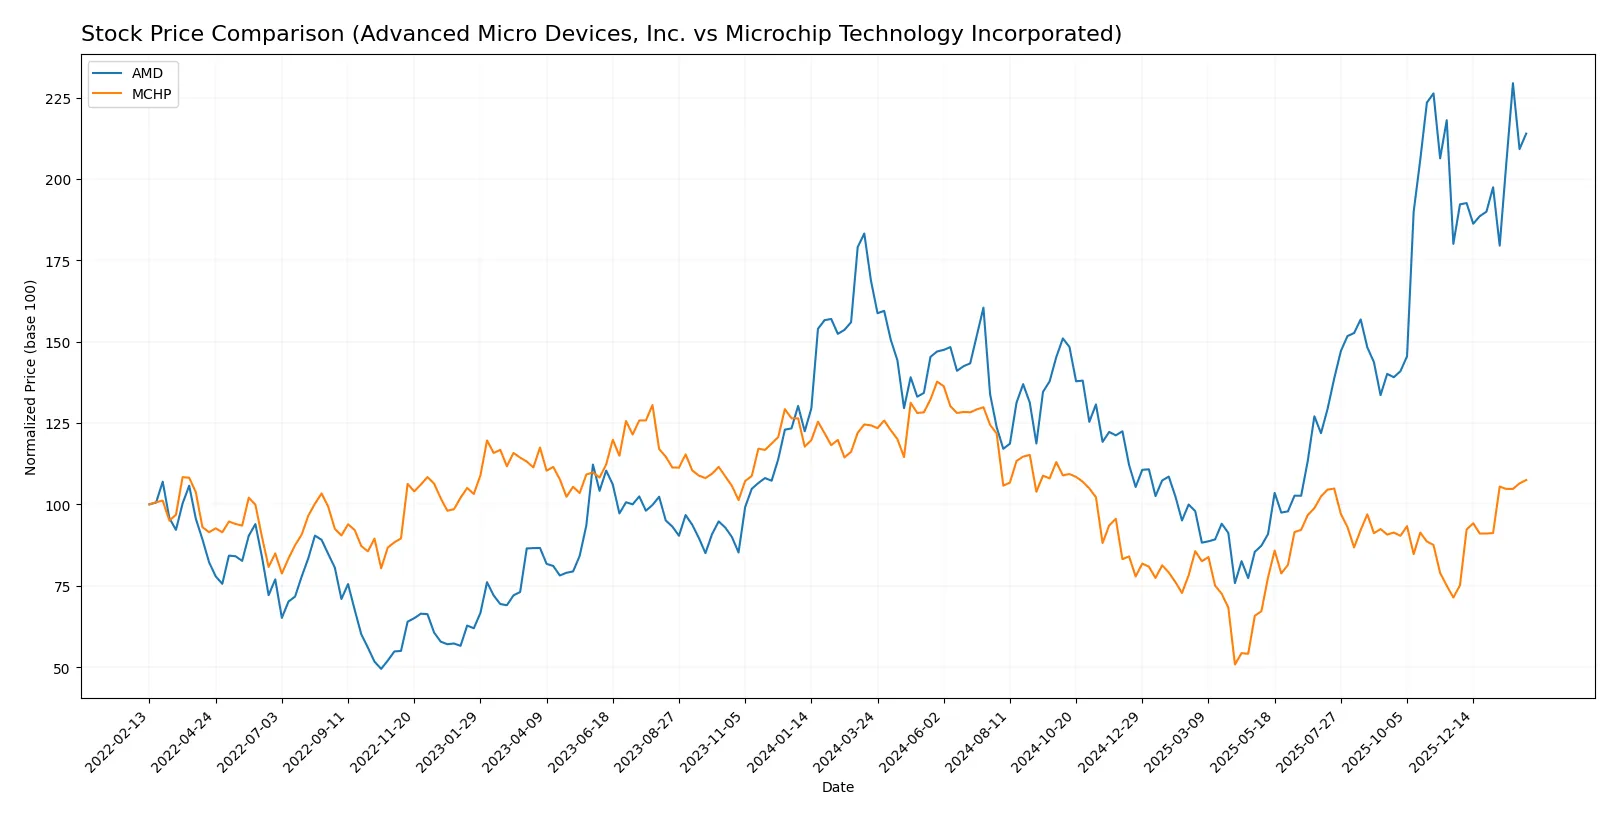
Trend Comparison
Advanced Micro Devices, Inc. (AMD) shows a strong bullish trend with a 26.72% price increase over the past 12 months. The trend accelerates, peaking at $259.68 and bottoming at $85.76.
Microchip Technology Incorporated (MCHP) experienced a bearish trend, dropping 13.52% over 12 months despite recent acceleration. The stock ranged between $36.22 and $98.23, showing volatility.
AMD’s consistent bullish momentum outperformed MCHP’s overall negative trend, delivering the highest market returns during this period.
Target Prices
Analysts set a clear target consensus for Advanced Micro Devices and Microchip Technology.
| Company | Target Low | Target High | Consensus |
|---|---|---|---|
| Advanced Micro Devices, Inc. | 225 | 380 | 291.56 |
| Microchip Technology Incorporated | 60 | 100 | 82.46 |
The consensus target for AMD at 291.56 suggests a 20% upside from the current 242.11 price. For Microchip, the 82.46 target implies modest upside from 76.66. Analysts expect steady gains but underline semiconductor sector volatility.

Don’t Let Luck Decide Your Entry Point
Optimize your entry points with our advanced ProRealTime indicators. You’ll get efficient buy signals with precise price targets for maximum performance. Start outperforming now!
How do institutions grade them?
Institutional grades for Advanced Micro Devices, Inc. and Microchip Technology Incorporated are summarized below:
Advanced Micro Devices, Inc. Grades
The following table shows recent grades from notable grading companies for AMD:
| Grading Company | Action | New Grade | Date |
|---|---|---|---|
| Wells Fargo | maintain | Overweight | 2026-01-30 |
| Piper Sandler | maintain | Overweight | 2026-01-26 |
| UBS | maintain | Buy | 2026-01-26 |
| Bernstein | maintain | Market Perform | 2026-01-21 |
| Keybanc | upgrade | Overweight | 2026-01-13 |
| Truist Securities | maintain | Buy | 2025-12-19 |
| Cantor Fitzgerald | maintain | Overweight | 2025-12-16 |
| Morgan Stanley | maintain | Equal Weight | 2025-11-12 |
| Wedbush | maintain | Outperform | 2025-11-12 |
| Rosenblatt | maintain | Buy | 2025-11-12 |
Microchip Technology Incorporated Grades
Below is a summary of recent institutional grades for Microchip Technology Incorporated:
| Grading Company | Action | New Grade | Date |
|---|---|---|---|
| Cantor Fitzgerald | maintain | Overweight | 2026-02-02 |
| UBS | maintain | Buy | 2026-01-26 |
| Susquehanna | maintain | Positive | 2026-01-22 |
| B of A Securities | maintain | Neutral | 2026-01-21 |
| Piper Sandler | maintain | Overweight | 2026-01-15 |
| Citigroup | maintain | Buy | 2026-01-15 |
| B. Riley Securities | maintain | Buy | 2026-01-12 |
| Mizuho | maintain | Outperform | 2026-01-09 |
| Wells Fargo | maintain | Equal Weight | 2026-01-07 |
| Needham | maintain | Buy | 2026-01-06 |
Which company has the best grades?
Both companies hold generally positive grades, with multiple “Buy” and “Overweight” ratings. AMD shows a slightly more diverse range of ratings, while MCHP maintains consistently bullish grades. Investors might interpret these consistent positive signals as institutional confidence, though nuances in rating scales should be considered.
Risks specific to each company
The following categories identify the critical pressure points and systemic threats facing both firms in the 2026 market environment:
1. Market & Competition
Advanced Micro Devices, Inc.
- Operates in highly competitive semiconductor markets with strong exposure to cutting-edge CPU and GPU segments.
Microchip Technology Incorporated
- Focuses on embedded control solutions with intense competition in microcontrollers and analog components.
2. Capital Structure & Debt
Advanced Micro Devices, Inc.
- Strong interest coverage ratio (28.2) and favorable debt metrics indicate solid financial stability.
Microchip Technology Incorporated
- Moderate debt-to-assets (37%) and weak interest coverage (1.15) raise concerns about debt servicing capacity.
3. Stock Volatility
Advanced Micro Devices, Inc.
- High beta of 1.95 reflects significant stock price volatility above market average.
Microchip Technology Incorporated
- Lower beta of 1.44 suggests less volatility but still above market average for tech sector.
4. Regulatory & Legal
Advanced Micro Devices, Inc.
- Exposed to global tech regulations, export controls, and IP-related legal risks.
Microchip Technology Incorporated
- Faces regulatory scrutiny mainly in embedded and automotive markets, with potential compliance costs.
5. Supply Chain & Operations
Advanced Micro Devices, Inc.
- Complex global supply chain for advanced semiconductor fabrication, vulnerable to geopolitical tensions.
Microchip Technology Incorporated
- Relies on foundry subcontracting, which can cause operational delays and quality control risks.
6. ESG & Climate Transition
Advanced Micro Devices, Inc.
- Increasing pressure to reduce emissions and manage resource-intensive chip manufacturing.
Microchip Technology Incorporated
- Faces ESG challenges in sustainable materials sourcing and energy use in manufacturing.
7. Geopolitical Exposure
Advanced Micro Devices, Inc.
- High exposure to US-China tech tensions impacting supply chains and sales channels.
Microchip Technology Incorporated
- Moderate exposure with diversified geographic sales but still impacted by global trade policies.
Which company shows a better risk-adjusted profile?
AMD’s strongest risk is its stock volatility and market competition in a fast-evolving segment. Microchip’s critical risk lies in its weaker debt servicing and operational dependencies. AMD’s balance sheet strength and Altman Z-score of 18 signal superior financial health. Microchip’s lower Piotroski score (3 vs. 7 for AMD) highlights operational and profitability challenges. Recent data confirm Microchip’s fragile interest coverage ratio as a red flag, underscoring AMD’s comparatively better risk-adjusted profile.
Final Verdict: Which stock to choose?
Advanced Micro Devices, Inc. (AMD) shines with its superpower in innovation and rapid revenue growth, driving strong income quality despite a challenging capital efficiency profile. Its point of vigilance remains the declining ROIC relative to cost of capital, suggesting caution on value creation. AMD fits well in an aggressive growth portfolio seeking market leadership.
Microchip Technology Incorporated (MCHP) holds a strategic moat in its steady free cash flow and dividend yield, appealing to income-focused investors. While it shows weakening profitability and a high debt load, its current and quick ratios indicate better short-term liquidity than AMD. MCHP suits a GARP (Growth at a Reasonable Price) portfolio aiming for income with moderate risk.
If you prioritize aggressive growth and innovation, AMD is the compelling choice due to its dynamic top-line expansion and income quality. However, if you seek income stability and moderate growth with a focus on cash flow, MCHP offers better short-term liquidity and dividend yield despite its profitability headwinds. Both present risks in value creation, warranting careful portfolio fit analysis.
Disclaimer: Investment carries a risk of loss of initial capital. The past performance is not a reliable indicator of future results. Be sure to understand risks before making an investment decision.
Go Further
I encourage you to read the complete analyses of Advanced Micro Devices, Inc. and Microchip Technology Incorporated to enhance your investment decisions: