Home > Comparison > Technology > AMD vs MRVL
The strategic rivalry between Advanced Micro Devices, Inc. (AMD) and Marvell Technology, Inc. shapes the semiconductor industry’s evolution. AMD operates as a diversified semiconductor powerhouse, specializing in high-performance computing and graphics solutions. Marvell Technology, in contrast, focuses on analog and mixed-signal integrated circuits with a strong emphasis on networking and storage. This analysis will weigh their contrasting operational models to identify which company offers a superior risk-adjusted return for a balanced portfolio.
Table of contents
Companies Overview
Advanced Micro Devices and Marvell Technology drive innovation in the semiconductor industry with distinct market roles and competitive strengths.
Advanced Micro Devices, Inc.: Leading High-Performance Computing Innovator
AMD dominates the semiconductor space with a diverse product portfolio spanning CPUs, GPUs, and semi-custom SoCs. Its core revenue comes from processors powering desktops, notebooks, servers, and gaming consoles. In 2026, AMD focuses strategically on expanding its data center presence and leveraging cutting-edge chip architectures to capture premium market segments.
Marvell Technology, Inc.: Specialist in Integrated Circuit Solutions
Marvell excels in designing and selling analog and digital integrated circuits for networking, storage, and communications. Its revenue engine relies on Ethernet controllers, storage controllers, and ASICs. In 2026, Marvell prioritizes broadening its footprint in cloud infrastructure and 5G networking, aiming to deepen customer integration and diversify its product applications.
Strategic Collision: Similarities & Divergences
Both companies compete in semiconductors but differ fundamentally: AMD embraces a high-performance computing ecosystem, while Marvell targets infrastructure with specialized IC solutions. They clash primarily in the data center and cloud markets, where performance and integration matter most. AMD offers a growth profile tied to computing innovation; Marvell presents a stable, niche-focused investment with exposure to networking expansion.
Income Statement Comparison
This data dissects the core profitability and scalability of both corporate engines to reveal who dominates the bottom line:
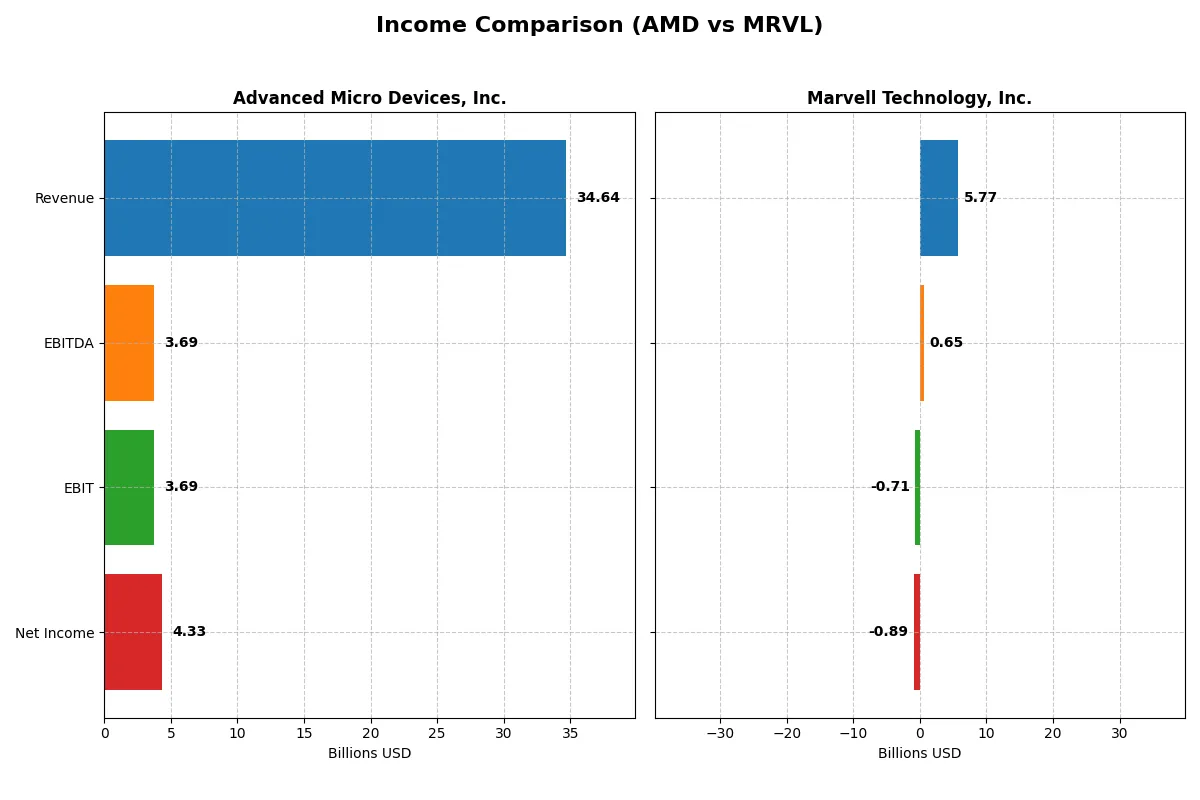
| Metric | Advanced Micro Devices, Inc. (AMD) | Marvell Technology, Inc. (MRVL) |
|---|---|---|
| Revenue | 34.6B | 5.77B |
| Cost of Revenue | 17.5B | 3.39B |
| Operating Expenses | 13.5B | 3.10B |
| Gross Profit | 17.2B | 2.38B |
| EBITDA | 3.69B | 652M |
| EBIT | 3.69B | -705M |
| Interest Expense | 131M | 189M |
| Net Income | 4.34B | -885M |
| EPS | 2.67 | -1.02 |
| Fiscal Year | 2025 | 2025 |
Income Statement Analysis: The Bottom-Line Duel
This income statement comparison reveals how efficiently each company converts revenue into profit, shedding light on their core operational strengths.
Advanced Micro Devices, Inc. Analysis
AMD’s revenue surged from $16.4B in 2021 to $34.6B in 2025, doubling over five years. Net income rose impressively to $4.3B in 2025, reflecting a healthy net margin of 12.5%. Gross margin stands strong at 49.5%, while EBIT margin hit 10.7%. The latest year showed momentum with a 34% revenue growth and a near doubling in net income, signaling robust operational efficiency and scalable profitability.
Marvell Technology, Inc. Analysis
Marvell’s revenue grew moderately from $3B in 2021 to $5.8B in 2025, a slower pace than AMD. The company reported a net loss of $885M in 2025, with a negative net margin of -15.4%. Gross margin at 41.3% is decent, but an EBIT margin of -12.2% highlights persistent profitability challenges. Recent years show operating losses deepening despite slight revenue growth, indicating margin compression and weak cost control.
Margin Dominance vs. Revenue Expansion
AMD clearly leads with superior margin health and accelerating profit growth, underpinning its industry-leading efficiency. Marvell’s modest revenue gains contrast with widening losses and negative returns. For investors prioritizing fundamental strength and profitability, AMD’s profile offers a more attractive and reliable growth trajectory.
Financial Ratios Comparison
These vital ratios act as a diagnostic tool to expose the underlying fiscal health, valuation premiums, and capital efficiency of the companies compared below:
| Ratios | Advanced Micro Devices, Inc. (AMD) | Marvell Technology, Inc. (MRVL) |
|---|---|---|
| ROE | 2.85% (2024) | -6.59% (2025) |
| ROIC | 2.49% (2024) | -3.88% (2025) |
| P/E | 123.59 (2024) | -110.37 (2025) |
| P/B | 3.52 (2024) | 7.27 (2025) |
| Current Ratio | 2.62 (2024) | 1.54 (2025) |
| Quick Ratio | 1.83 (2024) | 1.03 (2025) |
| D/E (Debt-to-Equity) | 3.84% (2024) | 32.35% (2025) |
| Debt-to-Assets | 3.20% (2024) | 21.50% (2025) |
| Interest Coverage | 20.65 (2024) | -3.80 (2025) |
| Asset Turnover | 0.37 (2024) | 0.29 (2025) |
| Fixed Asset Turnover | 10.63 (2024) | 5.56 (2025) |
| Payout ratio | 0% (2024) | -23.45% (2025) |
| Dividend yield | 0% (2024) | 0.21% (2025) |
| Fiscal Year | 2024 | 2025 |
Efficiency & Valuation Duel: The Vital Signs
Financial ratios serve as a company’s DNA, unlocking insights into hidden risks and operational excellence that numbers alone cannot reveal.
Advanced Micro Devices, Inc.
AMD shows a favorable net margin of 12.51%, signaling core profitability strength, yet its ROE and ROIC are zero, indicating inefficiency in capital returns. The stock trades at a stretched P/E of 80.54, reflecting high market expectations. AMD offers no dividend, instead channeling cash into R&D, with a strong interest coverage ratio of 28.2 supporting financial stability.
Marvell Technology, Inc.
Marvell suffers from negative net margin (-15.35%) and ROE (-6.59%), exposing operational struggles and weak profitability. Despite a negative P/E, it has a more reasonable current ratio of 1.54 and manageable debt levels, with some efficiency in fixed asset turnover (5.56). The modest dividend yield of 0.21% contrasts with its negative earnings, highlighting a riskier shareholder return profile.
Premium Valuation vs. Operational Challenges
AMD commands a premium valuation supported by healthy margins but lacks capital efficiency, while Marvell shows operational weakness despite better liquidity. AMD’s profile suits investors prioritizing growth with tolerance for valuation risk. Marvell fits those accepting financial distress for potential turnaround opportunities.
Which one offers the Superior Shareholder Reward?
I observe AMD pays no dividends but generates strong free cash flow (3.4/share in 2025) to fuel aggressive buybacks. Marvell yields a modest 0.2%, but its payout exceeds net income, signaling unsustainable dividends. AMD’s buyback intensity and FCF coverage make it the superior long-term total return choice in 2026.
Comparative Score Analysis: The Strategic Profile
The radar chart reveals the fundamental DNA and trade-offs of Advanced Micro Devices, Inc. (AMD) and Marvell Technology, Inc. (MRVL):
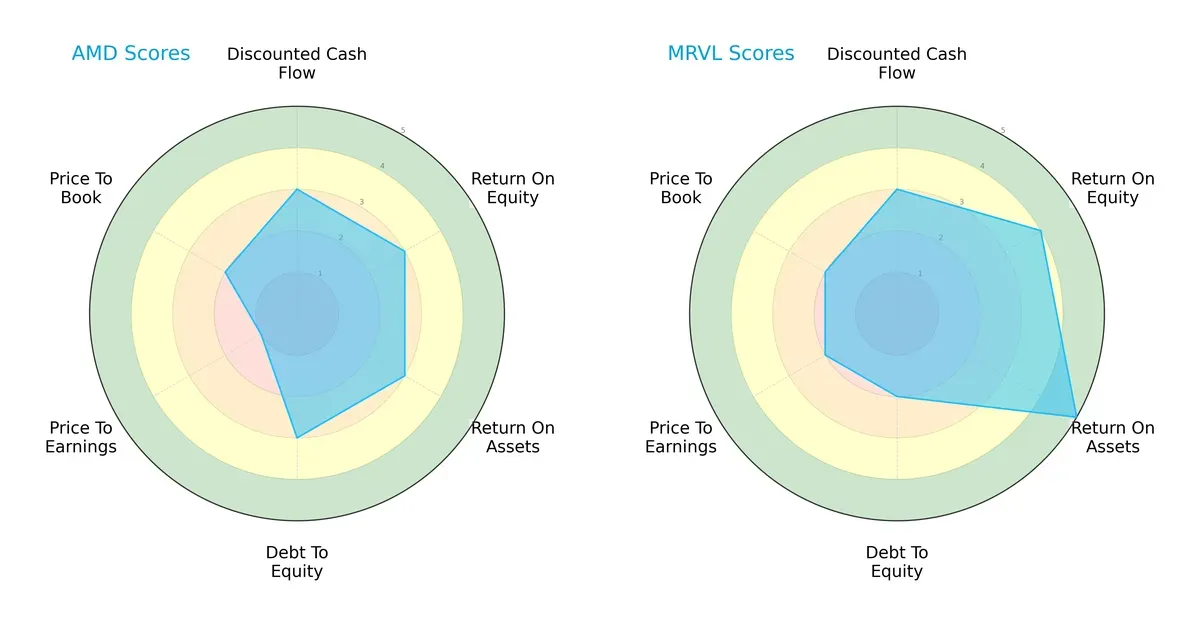
AMD and MRVL share a balanced overall score of 3, but MRVL edges ahead in profitability with ROE and ROA scores of 4 and 5 versus AMD’s 3 each. AMD shows a stronger debt-to-equity profile at 3 versus MRVL’s 2, indicating a more conservative leverage stance. Valuation scores favor MRVL with a better P/E score (2 vs. 1). MRVL’s profile relies on operational efficiency, while AMD’s strength lies in financial stability.
Bankruptcy Risk: Solvency Showdown
The Altman Z-Scores place both firms safely above distress thresholds, with AMD scoring an exceptional 18.0 versus MRVL’s 6.8:
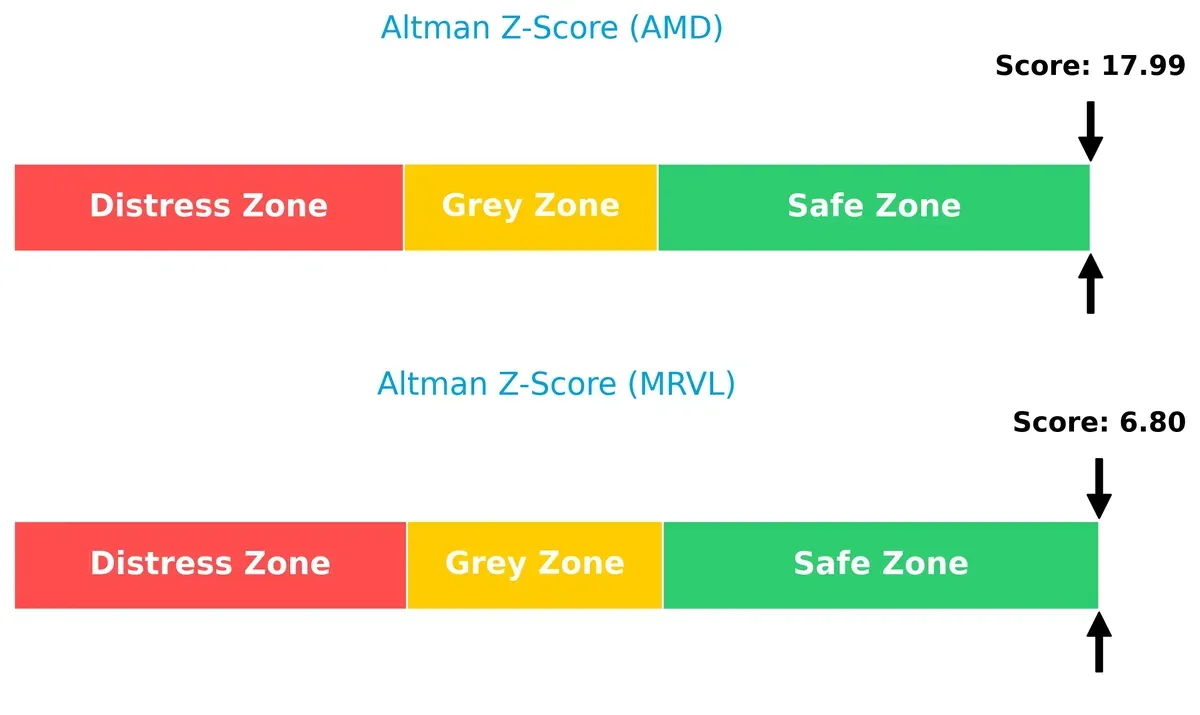
AMD’s extremely high Z-Score signals robust solvency and negligible bankruptcy risk in this cycle. MRVL, while in the safe zone, presents a higher but manageable risk profile. This gap reflects AMD’s superior balance sheet resilience under economic stress.
Financial Health: Quality of Operations
Both AMD and MRVL post strong Piotroski F-Scores of 7, indicating solid operational quality and financial health:
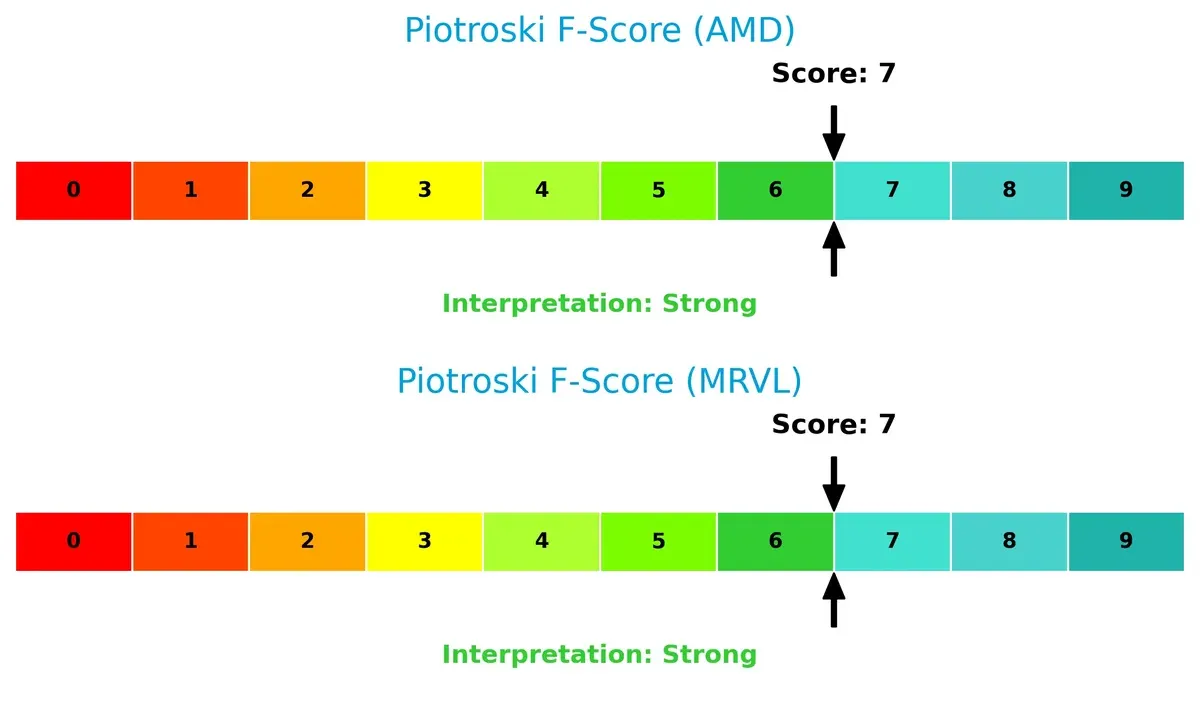
A score of 7 signals strong profitability, liquidity, and efficiency metrics for both companies. Neither shows red flags, but parity here suggests investors should focus on other factors like valuation and leverage to differentiate risk-return profiles.
How are the two companies positioned?
This section dissects AMD and Marvell’s operational DNA by comparing their revenue distribution and internal dynamics. The goal is to confront their economic moats and identify which business model offers the most resilient competitive advantage today.
Revenue Segmentation: The Strategic Mix
This visual comparison dissects how Advanced Micro Devices, Inc. and Marvell Technology, Inc. diversify their income streams and where their primary sector bets lie:
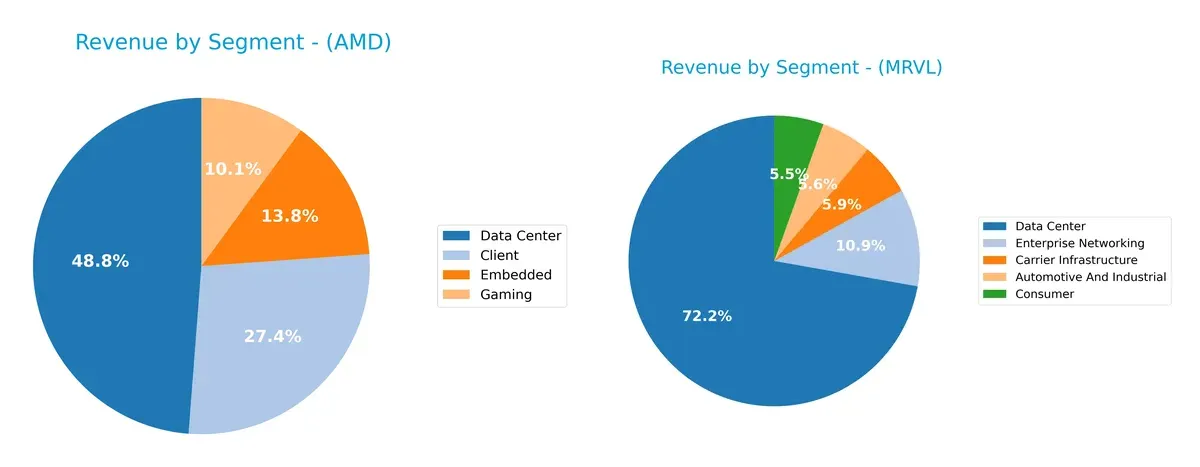
AMD anchors its revenue heavily in Data Center at $12.6B, dwarfing Gaming at $2.6B and Client at $7.1B, showing moderate diversification. Marvell pivots around Data Center too, with $4.16B, but spreads more evenly across Enterprise Networking ($626M), Carrier Infrastructure ($338M), and Automotive & Industrial ($322M). AMD’s concentration signals exposure to data infrastructure growth, while Marvell’s broader mix reduces reliance risk but may dilute focus.
Strengths and Weaknesses Comparison
This table compares the strengths and weaknesses of AMD and MRVL based on diversification, profitability, financials, innovation, global presence, and market share:
AMD Strengths
- Diversified products across Client, Data Center, Embedded, and Gaming segments
- Favorable net margin at 12.51%
- Strong interest coverage ratio at 28.2
- Low debt levels with favorable debt-to-assets ratio
- Significant global presence with high revenue in US and China
MRVL Strengths
- Diverse revenue streams including Data Center, Enterprise Networking, Automotive, and Consumer
- Favorable price-to-earnings ratio despite negative earnings
- Healthy current and quick ratios indicating liquidity
- Moderate debt with favorable debt-to-assets ratio
- Strong fixed asset turnover ratio at 5.56
AMD Weaknesses
- Unfavorable ROE and ROIC at 0% indicating weak capital returns
- High weighted average cost of capital (12.94%) above ROIC
- Poor liquidity ratios with zero current and quick ratio values
- High price-to-earnings ratio at 80.54 implies overvaluation risk
- Negative asset turnover ratios indicating low efficiency
- No dividend yield present
MRVL Weaknesses
- Negative profitability metrics including net margin (-15.35%) and ROE (-6.59%)
- Unfavorable interest coverage at -3.72 signals financial stress
- Price-to-book ratio at 7.27 indicates potential overvaluation
- Low asset turnover at 0.29 suggests weak asset utilization
- Minimal dividend yield of 0.21%
Both companies show diversification and global reach but struggle with profitability and capital efficiency. AMD’s strong liquidity and interest coverage contrast with MRVL’s liquidity strength but weaker profitability. These factors highlight strategic challenges in balancing growth and financial health.
The Moat Duel: Analyzing Competitive Defensibility
A structural moat is the only thing protecting long-term profits from relentless competition erosion. Here’s how AMD and Marvell Technology compare:
Advanced Micro Devices, Inc. (AMD): Innovation-Driven Intangible Assets
AMD’s moat stems from its cutting-edge processor designs and brand power. It shows solid margin stability but suffers from declining ROIC, indicating weakening capital efficiency in 2026. New data center and AI product launches could deepen this moat if execution improves.
Marvell Technology, Inc. (MRVL): Niche Market Expertise and Cost Advantage
Marvell relies on specialized analog and mixed-signal chips, differing from AMD’s broad CPU/GPU focus. However, its negative EBIT margin and deteriorating ROIC reveal struggles to convert expertise into profits. Expansion into storage and networking fabrics offers potential but remains a high-risk bet.
Innovation Intensity vs. Specialized Execution: Who Holds the Moat Edge?
Both firms face value destruction with declining ROIC trends. AMD’s broader product ecosystem grants it a deeper moat despite current capital inefficiencies. Marvell’s narrower niche and weaker profitability limit its moat breadth, leaving AMD better positioned to defend market share long term.
Which stock offers better returns?
Over the past 12 months, Advanced Micro Devices, Inc. (AMD) and Marvell Technology, Inc. (MRVL) showed distinct price movements and trading dynamics, with AMD accelerating its gains while MRVL decelerated.
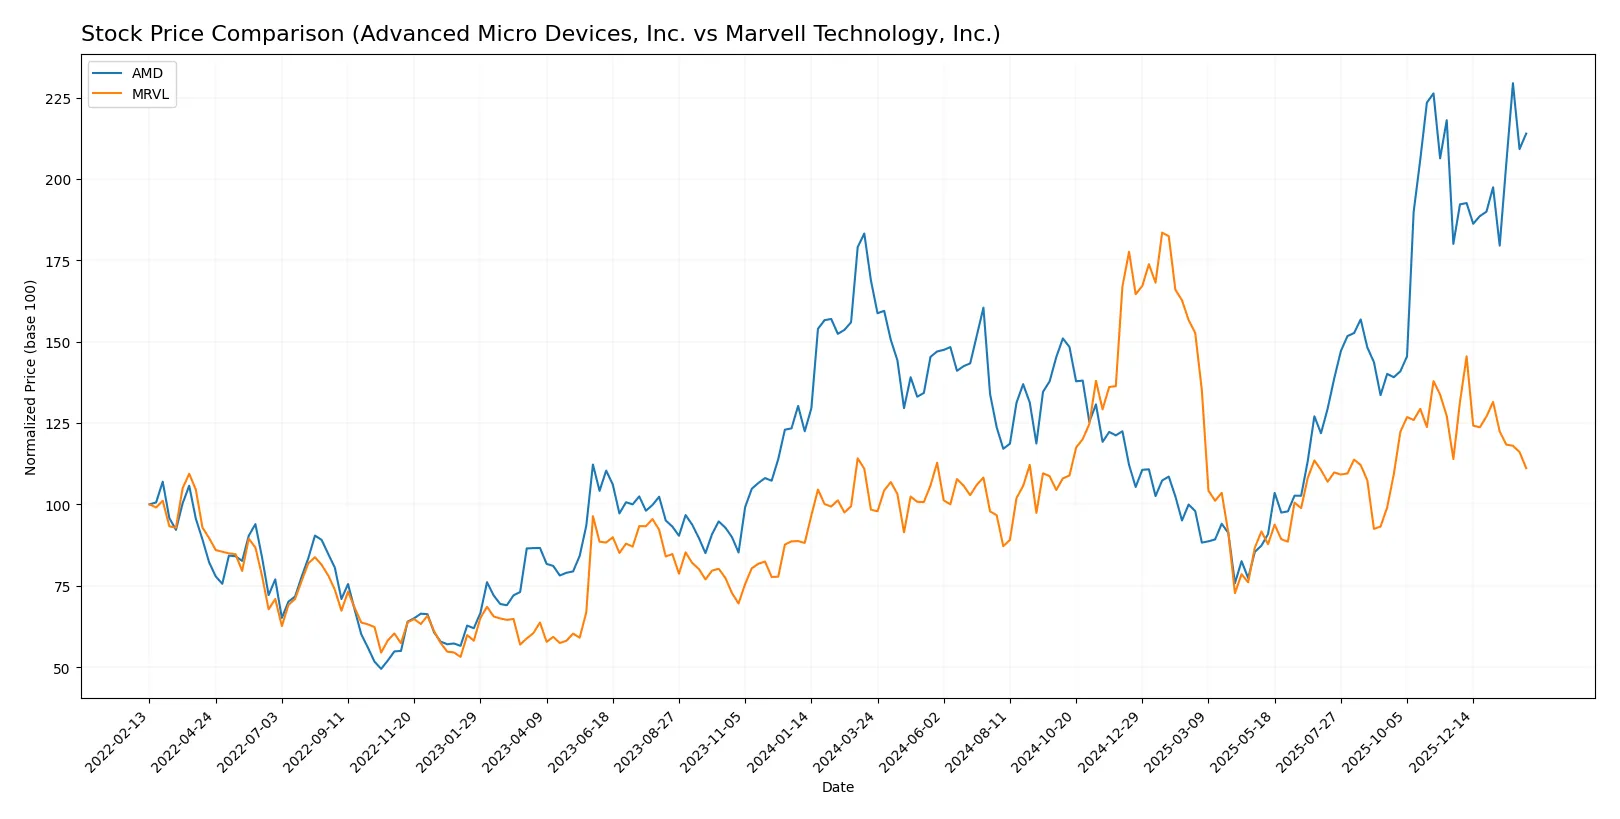
Trend Comparison
AMD’s stock rose 26.72% over the past year, marking a bullish trend with accelerating momentum and a high volatility level (41.61 std deviation). The price ranged from 85.76 to 259.68, showing strong upward dynamics.
MRVL gained 12.97% overall, also bullish but with decelerating momentum. Volatility was lower (16.42 std deviation), with prices between 49.43 and 124.76. Recent months saw a slight bearish retracement of -2.47%.
AMD outperformed MRVL by a wide margin in total price appreciation and showed accelerating strength, while MRVL’s trend slowed and slightly reversed recently, confirming AMD’s superior market performance.
Target Prices
Analysts present a solid bullish consensus for both Advanced Micro Devices, Inc. and Marvell Technology, Inc.
| Company | Target Low | Target High | Consensus |
|---|---|---|---|
| Advanced Micro Devices, Inc. | 225 | 380 | 291.56 |
| Marvell Technology, Inc. | 80 | 156 | 117.68 |
The consensus target prices indicate upside potential, with AMD’s target consensus about 20% above its current price of 242.11. Marvell’s consensus target suggests a nearly 56% gain from its current price of 75.54.

Don’t Let Luck Decide Your Entry Point
Optimize your entry points with our advanced ProRealTime indicators. You’ll get efficient buy signals with precise price targets for maximum performance. Start outperforming now!
How do institutions grade them?
Advanced Micro Devices, Inc. Grades
The following table summarizes recent analyst grades for AMD from major financial firms.
| Grading Company | Action | New Grade | Date |
|---|---|---|---|
| Wells Fargo | Maintain | Overweight | 2026-01-30 |
| Piper Sandler | Maintain | Overweight | 2026-01-26 |
| UBS | Maintain | Buy | 2026-01-26 |
| Bernstein | Maintain | Market Perform | 2026-01-21 |
| Keybanc | Upgrade | Overweight | 2026-01-13 |
| Truist Securities | Maintain | Buy | 2025-12-19 |
| Cantor Fitzgerald | Maintain | Overweight | 2025-12-16 |
| Morgan Stanley | Maintain | Equal Weight | 2025-11-12 |
| Wedbush | Maintain | Outperform | 2025-11-12 |
| Rosenblatt | Maintain | Buy | 2025-11-12 |
Marvell Technology, Inc. Grades
This table details recent analyst ratings for Marvell Technology by respected institutions.
| Grading Company | Action | New Grade | Date |
|---|---|---|---|
| Rosenblatt | Maintain | Buy | 2026-01-07 |
| Melius Research | Upgrade | Buy | 2026-01-05 |
| Benchmark | Downgrade | Hold | 2025-12-08 |
| JP Morgan | Maintain | Overweight | 2025-12-03 |
| Rosenblatt | Maintain | Buy | 2025-12-03 |
| Roth Capital | Maintain | Buy | 2025-12-03 |
| Oppenheimer | Maintain | Outperform | 2025-12-03 |
| B. Riley Securities | Maintain | Buy | 2025-12-03 |
| Wells Fargo | Maintain | Overweight | 2025-12-03 |
| Susquehanna | Maintain | Positive | 2025-12-03 |
Which company has the best grades?
AMD consistently holds strong buy and overweight ratings with few downgrades. Marvell shows mixed grades, including a recent downgrade to hold. Investors may see AMD’s grades as more stable and bullish.
Risks specific to each company
The following categories identify the critical pressure points and systemic threats facing both firms in the 2026 market environment:
1. Market & Competition
Advanced Micro Devices, Inc.
- Faces intense rivalry from larger chipmakers with high R&D spend; premium valuation suggests elevated growth expectations.
Marvell Technology, Inc.
- Competes in niche semiconductor segments but suffers from negative margins, signaling weak competitive positioning.
2. Capital Structure & Debt
Advanced Micro Devices, Inc.
- Maintains favorable debt metrics and strong interest coverage, indicating prudent leverage management.
Marvell Technology, Inc.
- Shows moderate leverage with manageable debt-to-assets ratio, but negative interest coverage raises solvency concerns.
3. Stock Volatility
Advanced Micro Devices, Inc.
- Beta near 1.95 signals high sensitivity to market swings; wide trading range adds to volatility risk.
Marvell Technology, Inc.
- Slightly higher beta at 1.98 with a wide price range, reflecting elevated stock price fluctuations.
4. Regulatory & Legal
Advanced Micro Devices, Inc.
- Subject to US and international tech regulations; geopolitical tensions could disrupt supply and sales.
Marvell Technology, Inc.
- Similar exposure to regulatory risks, compounded by operations across multiple Asian markets with diverse compliance demands.
5. Supply Chain & Operations
Advanced Micro Devices, Inc.
- Global supply chain complexity may cause delays; reliance on foundries is a vulnerability in tight market conditions.
Marvell Technology, Inc.
- Operations span multiple countries, increasing exposure to regional disruptions and logistical challenges.
6. ESG & Climate Transition
Advanced Micro Devices, Inc.
- ESG initiatives critical for investor appeal; energy-intensive manufacturing exposes AMD to climate-related regulatory risks.
Marvell Technology, Inc.
- Faces pressure to improve ESG standards; diverse geographic footprint complicates unified climate strategy.
7. Geopolitical Exposure
Advanced Micro Devices, Inc.
- High US-China tensions threaten market access and supply; export controls could impact growth.
Marvell Technology, Inc.
- Operations in China, Taiwan, and Southeast Asia elevate geopolitical risks amid regional instability.
Which company shows a better risk-adjusted profile?
AMD’s strongest risk is market competition amplified by its lofty valuation and execution pressure. Marvell’s most impactful risk is its negative profitability and weak interest coverage, signaling financial fragility. Despite volatility, AMD’s robust capital structure and safer Altman Z-Score suggest a better risk-adjusted profile. Marvell’s recent negative net margin and interest coverage are red flags that heighten its investment risk.
Final Verdict: Which stock to choose?
Advanced Micro Devices, Inc. (AMD) showcases a superpower in its robust revenue growth and strong cash generation, fueling aggressive reinvestment into innovation. Its point of vigilance lies in declining returns on invested capital, signaling caution on long-term value creation. AMD suits an aggressive growth portfolio aiming to capitalize on market expansion.
Marvell Technology, Inc. (MRVL) benefits from a strategic moat built around specialized semiconductor solutions and recurring revenue streams. While it faces profitability challenges, its balance sheet shows more conservative leverage and liquidity than AMD. MRVL aligns with investors seeking growth at a reasonable price (GARP) with a tolerance for operational recovery.
If you prioritize rapid expansion and cash flow momentum, AMD is the compelling choice due to its accelerating stock trend and superior revenue growth. However, if you seek a more balanced risk profile with potential turnaround upside, MRVL offers better stability in liquidity and debt management. Both present analytical scenarios for distinct investor appetites but come with significant risks around profitability and capital efficiency.
Disclaimer: Investment carries a risk of loss of initial capital. The past performance is not a reliable indicator of future results. Be sure to understand risks before making an investment decision.
Go Further
I encourage you to read the complete analyses of Advanced Micro Devices, Inc. and Marvell Technology, Inc. to enhance your investment decisions: