Home > Comparison > Technology > AMD vs LRCX
The strategic rivalry between Advanced Micro Devices, Inc. and Lam Research Corporation shapes the semiconductor sector’s evolution. AMD excels as a diversified chipmaker in computing and graphics, while Lam Research specializes in high-precision semiconductor fabrication equipment. This head-to-head pits product innovation against manufacturing expertise. This analysis will clarify which company offers superior risk-adjusted returns, guiding investors toward the optimal choice for a technology-focused portfolio.
Table of contents
Companies Overview
Advanced Micro Devices and Lam Research stand as pivotal players in the semiconductor industry, shaping technology’s future.
Advanced Micro Devices, Inc.: Innovator in High-Performance Computing
Advanced Micro Devices, Inc. dominates the semiconductor market with its powerful processors and GPUs. Its revenue stems primarily from Computing and Graphics segments, including Ryzen CPUs and Radeon GPUs. In 2026, AMD focuses on expanding data center solutions and custom SoC technologies, leveraging its competitive edge in high-performance and energy-efficient chips.
Lam Research Corporation: Leader in Semiconductor Equipment
Lam Research specializes in semiconductor fabrication equipment, essential for integrated circuit manufacturing. Its core revenue comes from selling advanced wafer processing tools globally. In 2026, Lam prioritizes innovation in plasma etching and deposition technologies, aiming to support next-generation chip production and maintain its leadership in process equipment efficiency.
Strategic Collision: Similarities & Divergences
Both companies drive semiconductor industry progress but with distinct models: AMD competes by designing end-user chips, while Lam supplies manufacturing tools. Their battleground centers on semiconductor advancement—AMD pushes chip performance; Lam advances fabrication precision. This divergence creates distinct investment profiles: AMD’s growth hinges on product adoption, Lam’s on capital spending cycles.
Income Statement Comparison
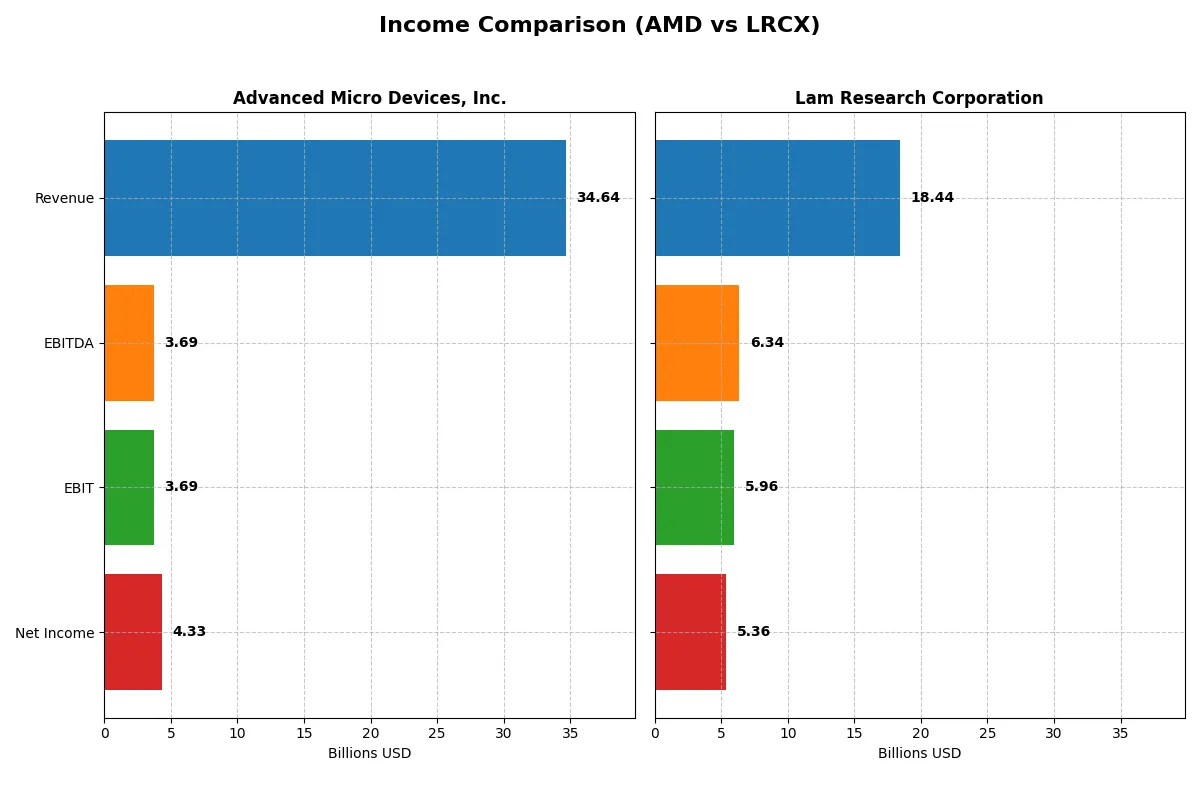
This data dissects the core profitability and scalability of both corporate engines to reveal who dominates the bottom line:
| Metric | Advanced Micro Devices, Inc. (AMD) | Lam Research Corporation (LRCX) |
|---|---|---|
| Revenue | 34.6B | 18.4B |
| Cost of Revenue | 17.5B | 9.5B |
| Operating Expenses | 13.5B | 3.1B |
| Gross Profit | 17.2B | 9.0B |
| EBITDA | 3.7B | 6.3B |
| EBIT | 3.7B | 6.0B |
| Interest Expense | 131M | 178M |
| Net Income | 4.3B | 5.4B |
| EPS | 2.67 | 4.17 |
| Fiscal Year | 2025 | 2025 |
Income Statement Analysis: The Bottom-Line Duel
This income statement comparison reveals which company runs its business engine with greater efficiency and financial strength.
Advanced Micro Devices, Inc. Analysis
AMD’s revenue surged 34% to $34.6B in 2025, with net income nearly tripling to $4.3B. Its gross margin holds firm at 49.5%, while net margin improved to 12.5%. The sharp rise in EBIT and EPS signals accelerating momentum and effective cost controls despite heavy R&D spending.
Lam Research Corporation Analysis
Lam Research posted $18.4B revenue in 2025, up 24%, with net income climbing 40% to $5.4B. Gross margin stands at a solid 48.7%, but Lam’s net margin outpaces AMD at 29.1%. EBIT margin of 32.3% reflects superior operational efficiency, sustaining steady growth and robust profitability.
Margin Strength vs. Growth Scale
Lam Research delivers higher profitability margins and more consistent net income growth. In contrast, AMD posts faster revenue growth and sharp profit acceleration but at lower margins. Lam’s profile suits investors favoring steady, high-margin earnings. AMD appeals to those seeking rapid expansion with improving but still modest profitability.
Financial Ratios Comparison
These vital ratios act as a diagnostic tool to expose the underlying fiscal health, valuation premiums, and capital efficiency of these companies:
| Ratios | Advanced Micro Devices, Inc. (AMD) | Lam Research Corporation (LRCX) |
|---|---|---|
| ROE | 2.85% (2024) | 54.33% (2025) |
| ROIC | 2.49% (2024) | 34.00% (2025) |
| P/E | 124x (2024) | 23.36x (2025) |
| P/B | 3.52x (2024) | 12.69x (2025) |
| Current Ratio | 2.62 (2024) | 2.21 (2025) |
| Quick Ratio | 1.83 (2024) | 1.55 (2025) |
| D/E | 3.84% (2024) | 48.23% (2025) |
| Debt-to-Assets | 3.20% (2024) | 22.28% (2025) |
| Interest Coverage | 20.65 (2024) | 33.11 (2025) |
| Asset Turnover | 0.37 (2024) | 0.86 (2025) |
| Fixed Asset Turnover | 10.63 (2024) | 7.59 (2025) |
| Payout Ratio | 0% (2024) | 21.45% (2025) |
| Dividend Yield | 0% (2024) | 0.92% (2025) |
| Fiscal Year | 2024 | 2025 |
Efficiency & Valuation Duel: The Vital Signs
Financial ratios serve as a company’s DNA, revealing hidden risks and operational excellence that drive investment decisions.
Advanced Micro Devices, Inc.
AMD shows a mixed profitability profile with a favorable net margin of 12.5% but an unfavorable ROE and ROIC at 0%, suggesting operational challenges. Its P/E ratio stands at a stretched 80.5, signaling an expensive valuation. The company pays no dividend, instead reinvesting heavily in R&D, which absorbs 25% of revenue, aiming for growth amid high valuation risks.
Lam Research Corporation
Lam Research dominates profitability with a robust net margin of 29.1%, ROE of 54.3%, and ROIC at 34%, reflecting operational efficiency. Its valuation is more balanced; the P/E ratio at 23.4 is neutral though the P/B ratio is stretched at 12.7. Lam offers a modest 0.9% dividend yield while maintaining strong free cash flow, blending shareholder returns with steady capital discipline.
Premium Valuation vs. Operational Safety
Lam Research presents a superior balance of high profitability and reasonable valuation, supported by dividends and solid capital metrics. AMD’s valuation appears stretched with weaker returns, relying heavily on reinvestment. Investors prioritizing operational safety and steady returns may prefer Lam’s profile, while growth-focused investors might weigh AMD’s reinvestment strategy despite higher risk.
Which one offers the Superior Shareholder Reward?
Advanced Micro Devices, Inc. (AMD) does not pay dividends, opting to reinvest its free cash flow (3.4B per share) aggressively into R&D and growth, fueling a high P/E of 80.5x and a free cash flow yield near zero. Lam Research Corporation (LRCX), in contrast, pays a 0.9% dividend yield with a sustainable 21-27% payout ratio, complemented by robust buybacks that return 4.2B in free cash flow per share. Historically, LRCX’s balanced distribution approach—dividends plus significant buybacks—offers a more sustainable shareholder reward given its stronger margins (29% net vs. AMD’s 12.5%) and efficient capital allocation. I conclude LRCX provides a superior total return profile for 2026 investors seeking both income and capital appreciation.
Comparative Score Analysis: The Strategic Profile
The radar chart reveals the fundamental DNA and trade-offs of Advanced Micro Devices, Inc. (AMD) and Lam Research Corporation (LRCX), highlighting their financial strengths and weaknesses:
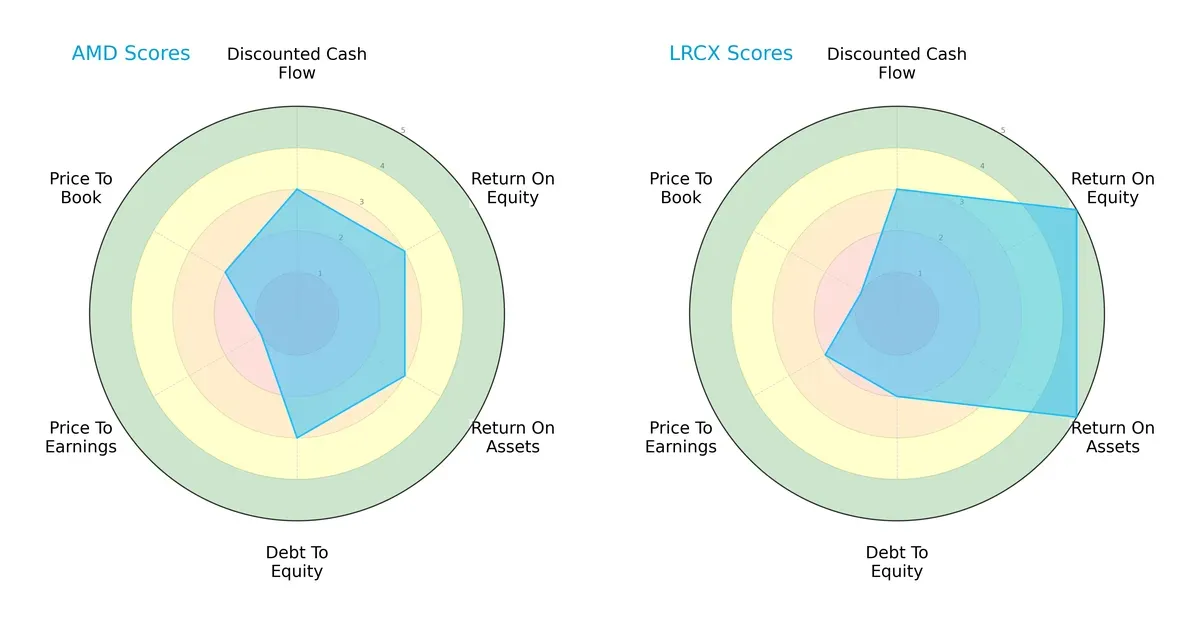
LRCX excels in return on equity (5 vs. 3) and return on assets (5 vs. 3), indicating superior operational efficiency. AMD has a more balanced debt-to-equity score (3 vs. 2), but LRCX’s valuation metrics show mixed signals—its price-to-earnings score (2) outperforms AMD’s (1), yet it scores lower on price-to-book (1 vs. 2). Overall, LRCX relies heavily on operational excellence, while AMD presents a more even but moderate profile.
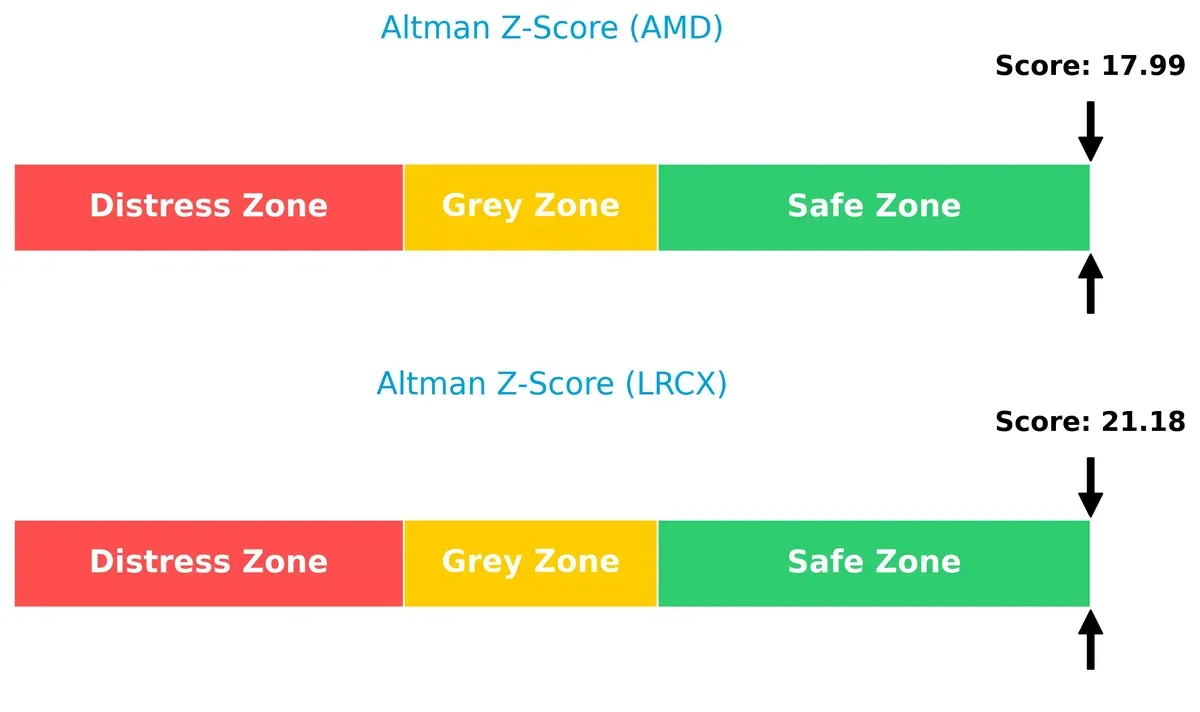
Bankruptcy Risk: Solvency Showdown
The Altman Z-Score differential shows both companies in a safe zone, with LRCX at 21.18 and AMD at 17.99, underscoring robust solvency and low bankruptcy risk in this market cycle:
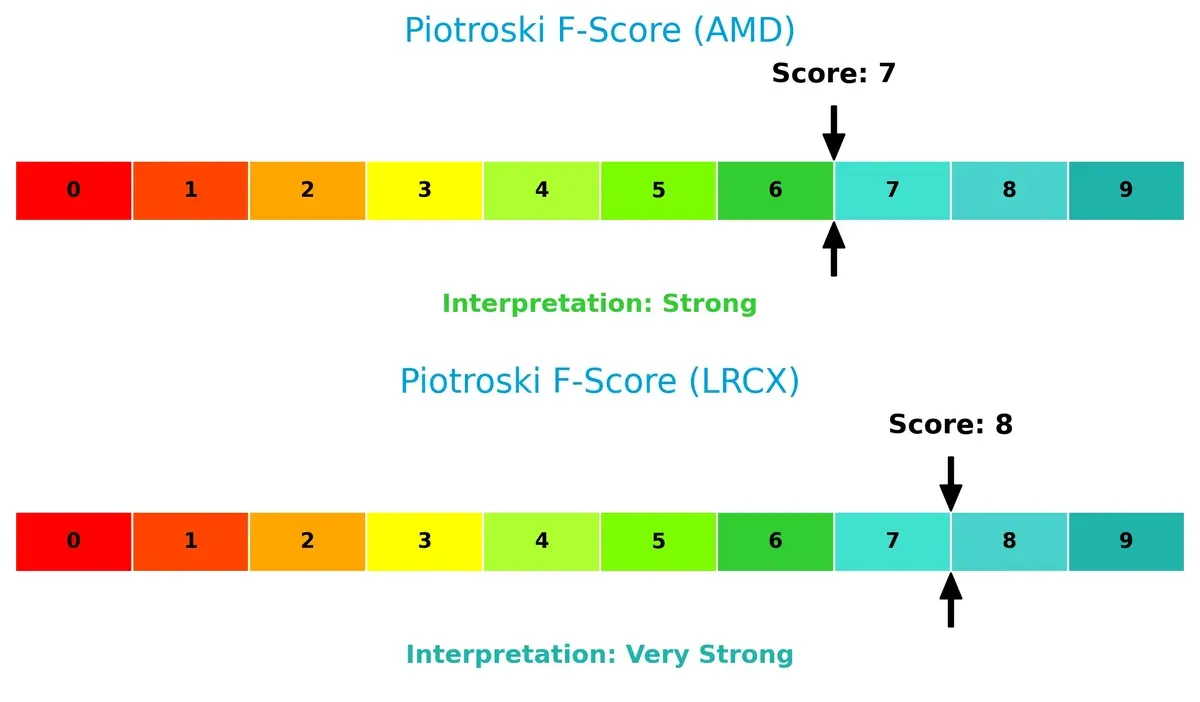
Financial Health: Quality of Operations
LRCX’s Piotroski F-Score of 8 surpasses AMD’s 7, signaling stronger financial health and fewer internal red flags. LRCX’s superior score reflects better profitability and operational efficiency metrics:
How are the two companies positioned?
This section dissects AMD and LRCX’s operational DNA by comparing their revenue distribution and internal dynamics. The ultimate goal is to confront their economic moats to identify which model delivers the most resilient competitive advantage today.
Revenue Segmentation: The Strategic Mix
This visual comparison dissects how Advanced Micro Devices, Inc. and Lam Research Corporation diversify their income streams and where their primary sector bets lie:
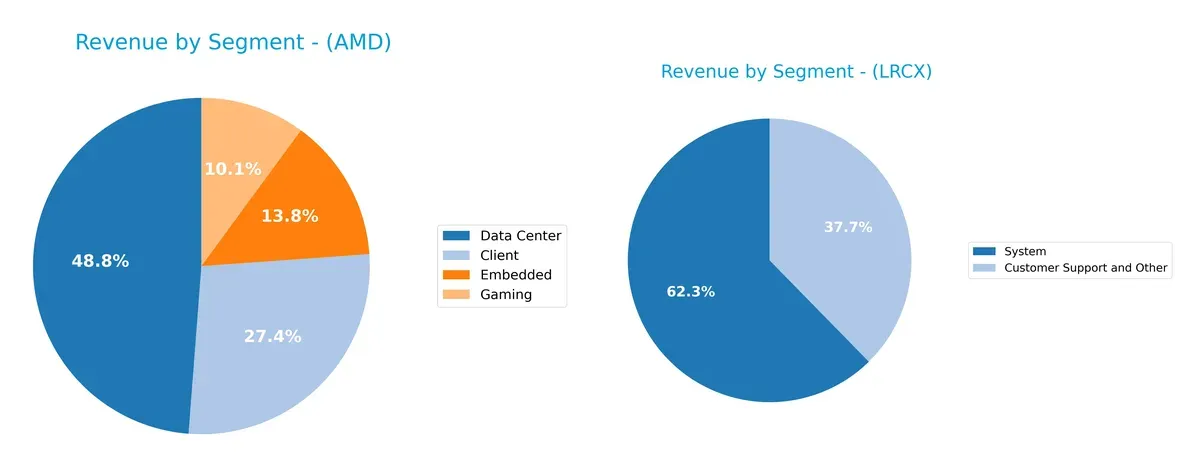
AMD shows a diversified revenue base with Data Center leading at $12.6B, followed by Client ($7.1B), Embedded ($3.6B), and Gaming ($2.6B). In contrast, Lam Research leans heavily on Systems at $11.5B, with Customer Support trailing at $6.9B. AMD’s mix reduces concentration risk and strengthens ecosystem lock-in, while Lam Research’s focus on infrastructure dominance could amplify cyclicality exposure.
Strengths and Weaknesses Comparison
This table compares the strengths and weaknesses of AMD and LRCX across key financial and strategic criteria:
AMD Strengths
- Diverse product segments including Client, Data Center, Embedded, and Gaming
- Significant revenue from the United States and China
- Favorable net margin at 12.51%
- Strong interest coverage at 28.2
- Low debt-to-assets ratio
LRCX Strengths
- High profitability with 29.06% net margin and 54.33% ROE
- Favorable ROIC at 34.0% exceeding WACC
- Solid liquidity ratios: current ratio 2.21, quick ratio 1.55
- Diverse geographic presence including Korea and Taiwan
- Strong fixed asset turnover at 7.59
AMD Weaknesses
- Unfavorable ROE and ROIC at 0% signaling inefficient capital use
- High WACC of 12.94% impacts cost of capital
- Poor liquidity ratios: current and quick ratios at 0
- Unfavorable price-to-earnings at 80.54
- Asset turnover and fixed asset turnover unfavorable
- No dividend yield
LRCX Weaknesses
- WACC at 12.07% remains above ideal
- Unfavorable price-to-book ratio at 12.69
- Neutral P/E ratio at 23.36 limits valuation upside
- Dividend yield under 1% may concern income investors
Overall, LRCX demonstrates superior profitability and capital efficiency, supported by solid liquidity and a wider geographic footprint. AMD shows strengths in product diversification but faces challenges in capital returns and liquidity, which could influence its strategic focus on improving financial fundamentals.
The Moat Duel: Analyzing Competitive Defensibility
A structural moat is the only real defense against competition eroding long-term profits. Here’s how AMD and Lam Research compare:
Advanced Micro Devices, Inc. (AMD): Innovation-Driven but ROIC-Challenged
AMD’s moat hinges on cutting-edge processor design and strong brand presence in CPUs and GPUs. However, its declining ROIC signals value destruction, raising concerns about capital efficiency. New product launches in 2026 could revive growth but face fierce competition.
Lam Research Corporation (LRCX): Capital-Intensive Efficiency and Market Entrenchment
Lam Research wields a moat built on high barriers in semiconductor equipment manufacturing and growing ROIC above WACC. It sustains superior profitability and operational efficiency. Expansion into emerging markets and advanced etching tech in 2026 should deepen its moat further.
Capital Efficiency vs. Innovation Edge: Who Defends Better?
Lam Research holds the deeper moat with consistent ROIC growth and value creation, unlike AMD’s weakening capital returns. Lam is better positioned to defend and expand its market share amid industry shifts in 2026.
Which stock offers better returns?
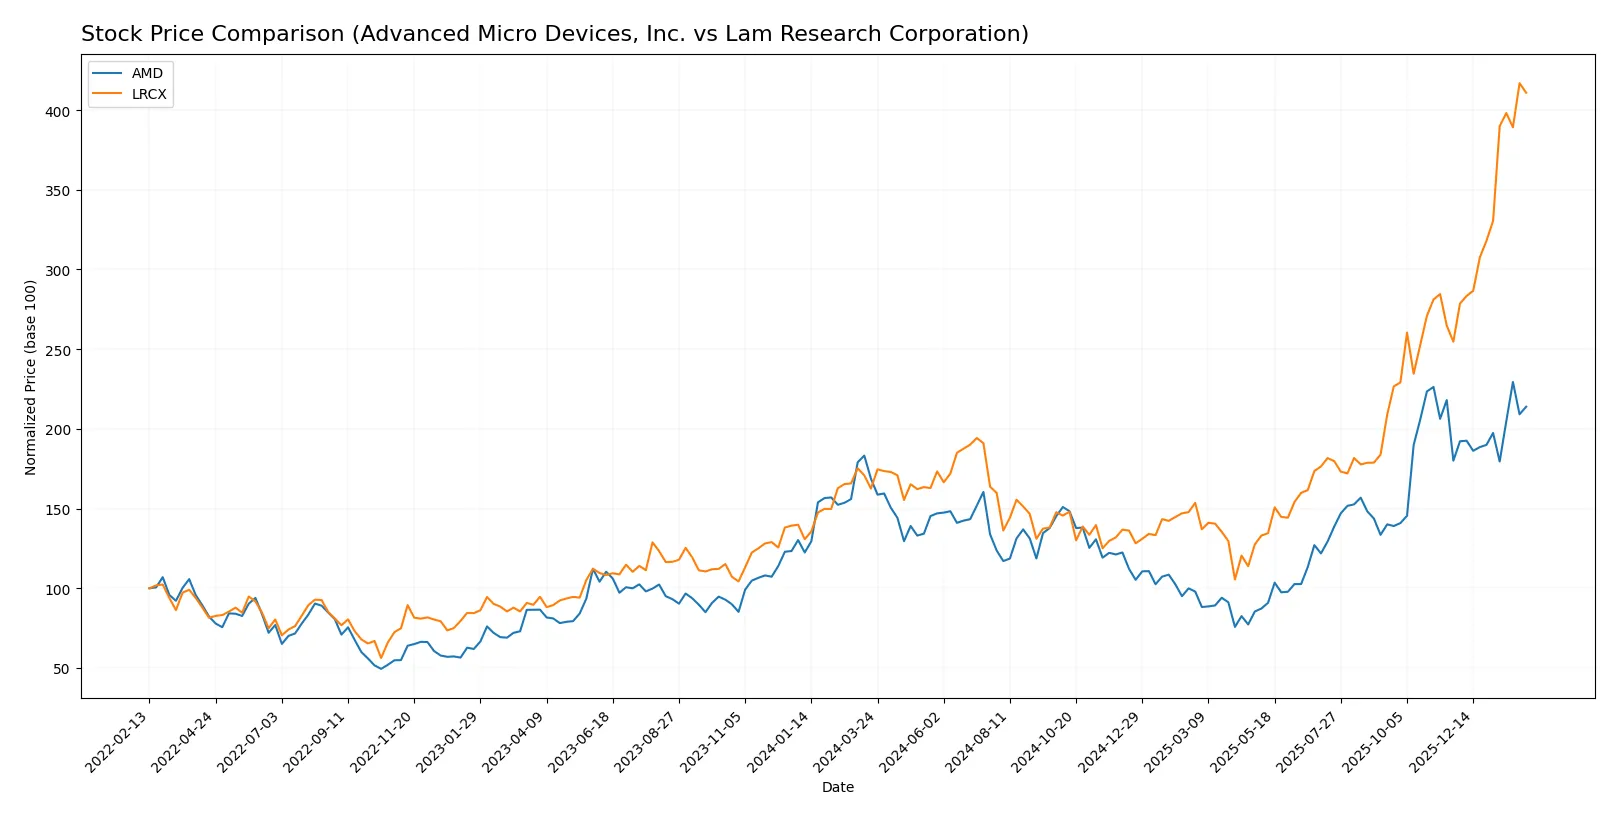
The past year saw Advanced Micro Devices, Inc. (AMD) and Lam Research Corporation (LRCX) both accelerate sharply, with LRCX showing a markedly stronger price increase and buyer dominance.
Trend Comparison
AMD’s stock rose 26.72% over the past 12 months, marking a bullish trend with accelerating gains. Volatility is high, with prices ranging from 85.76 to 259.68.
LRCX’s stock surged 152.83% over the same period, also bullish with acceleration. It experienced a wider price range, from 59.09 to 233.46, reflecting strong upward momentum.
Comparing both, LRCX outperformed AMD substantially, delivering the highest market returns and exhibiting stronger buyer dominance in recent months.
Target Prices
Analysts present a bullish consensus for Advanced Micro Devices, Inc. and Lam Research Corporation with solid upside potential.
| Company | Target Low | Target High | Consensus |
|---|---|---|---|
| Advanced Micro Devices, Inc. | 225 | 380 | 291.56 |
| Lam Research Corporation | 127 | 325 | 267.5 |
The consensus target for AMD stands about 20% above the current price of 242, signaling moderate upside. Lam Research’s target consensus exceeds its 230 price by roughly 16%, reflecting analyst optimism despite recent volatility.

Don’t Let Luck Decide Your Entry Point
Optimize your entry points with our advanced ProRealTime indicators. You’ll get efficient buy signals with precise price targets for maximum performance. Start outperforming now!
How do institutions grade them?
Advanced Micro Devices, Inc. Grades
The following table shows recent institutional grades for AMD:
| Grading Company | Action | New Grade | Date |
|---|---|---|---|
| Wells Fargo | Maintain | Overweight | 2026-01-30 |
| Piper Sandler | Maintain | Overweight | 2026-01-26 |
| UBS | Maintain | Buy | 2026-01-26 |
| Bernstein | Maintain | Market Perform | 2026-01-21 |
| Keybanc | Upgrade | Overweight | 2026-01-13 |
| Truist Securities | Maintain | Buy | 2025-12-19 |
| Cantor Fitzgerald | Maintain | Overweight | 2025-12-16 |
| Morgan Stanley | Maintain | Equal Weight | 2025-11-12 |
| Wedbush | Maintain | Outperform | 2025-11-12 |
| Rosenblatt | Maintain | Buy | 2025-11-12 |
Lam Research Corporation Grades
The following table shows recent institutional grades for LRCX:
| Grading Company | Action | New Grade | Date |
|---|---|---|---|
| Wells Fargo | Maintain | Overweight | 2026-01-29 |
| JP Morgan | Maintain | Overweight | 2026-01-29 |
| Evercore ISI Group | Maintain | Outperform | 2026-01-29 |
| RBC Capital | Maintain | Outperform | 2026-01-29 |
| Stifel | Maintain | Buy | 2026-01-29 |
| Cantor Fitzgerald | Maintain | Overweight | 2026-01-29 |
| Goldman Sachs | Maintain | Buy | 2026-01-29 |
| Citigroup | Maintain | Buy | 2026-01-29 |
| Susquehanna | Maintain | Positive | 2026-01-29 |
| UBS | Maintain | Buy | 2026-01-29 |
Which company has the best grades?
LRCX consistently receives “Buy,” “Overweight,” and “Outperform” ratings from multiple top firms. AMD’s grades are slightly more mixed, including “Market Perform” and “Equal Weight.” Investors may view LRCX’s stronger consensus as a sign of broader institutional confidence.
Risks specific to each company
The following categories identify the critical pressure points and systemic threats facing both firms in the 2026 market environment:
1. Market & Competition
Advanced Micro Devices, Inc.
- Faces fierce competition in CPUs and GPUs from Intel and Nvidia; high innovation pressure.
Lam Research Corporation
- Operates in specialized semiconductor equipment with fewer direct competitors but cyclical demand risks.
2. Capital Structure & Debt
Advanced Micro Devices, Inc.
- Strong interest coverage at 28.2; low debt levels indicate conservative leverage.
Lam Research Corporation
- Healthy debt metrics with 0.48 debt/equity and solid interest coverage at 33.4.
3. Stock Volatility
Advanced Micro Devices, Inc.
- Beta of 1.949 signals high sensitivity to market swings.
Lam Research Corporation
- Beta of 1.776 shows elevated but somewhat lower volatility than AMD.
4. Regulatory & Legal
Advanced Micro Devices, Inc.
- Exposure to export controls and IP disputes in global markets.
Lam Research Corporation
- Faces regulatory scrutiny on technology exports and environmental compliance globally.
5. Supply Chain & Operations
Advanced Micro Devices, Inc.
- Relies on third-party foundries, posing capacity and geopolitical risks.
Lam Research Corporation
- Supply chain tied to semiconductor fabrication equipment, vulnerable to component shortages.
6. ESG & Climate Transition
Advanced Micro Devices, Inc.
- Increasing pressure to reduce carbon footprint in chip manufacturing processes.
Lam Research Corporation
- Strong focus on sustainable manufacturing but faces challenges in energy-intensive equipment production.
7. Geopolitical Exposure
Advanced Micro Devices, Inc.
- Significant China exposure amid rising US-China tech tensions.
Lam Research Corporation
- Diverse global footprint but sensitive to trade restrictions and tariffs.
Which company shows a better risk-adjusted profile?
Lam Research’s superior profitability, healthier liquidity ratios, and stronger financial scores suggest a more balanced risk-adjusted profile. AMD’s high valuation and stock volatility heighten investment risks. Lam’s stable capital structure and lower beta provide a cushion amid market uncertainties, justifying cautious preference.
Final Verdict: Which stock to choose?
Advanced Micro Devices (AMD) excels as an innovation powerhouse, driving rapid revenue and earnings growth through cutting-edge R&D. However, its persistent struggle to generate returns above its cost of capital signals value destruction—a point of vigilance. AMD fits portfolios targeting aggressive growth with tolerance for operational challenges.
Lam Research (LRCX) commands a durable moat with a proven ability to create value, demonstrated by its consistently high ROIC above WACC and strong profitability metrics. Its stable cash flows and robust balance sheet offer greater safety compared to AMD. LRCX suits investors seeking growth at a reasonable price combined with financial resilience.
If you prioritize high-growth potential and are comfortable with volatility, AMD’s innovation dynamism might be the compelling choice despite its capital efficiency concerns. However, if you seek a stock with a durable competitive advantage and superior financial stability, LRCX outshines AMD in delivering sustainable value creation and lower risk.
Disclaimer: Investment carries a risk of loss of initial capital. The past performance is not a reliable indicator of future results. Be sure to understand risks before making an investment decision.
Go Further
I encourage you to read the complete analyses of Advanced Micro Devices, Inc. and Lam Research Corporation to enhance your investment decisions: