Home > Comparison > Technology > AMD vs KLAC
The strategic rivalry between Advanced Micro Devices, Inc. (AMD) and KLA Corporation defines the current trajectory of the semiconductor industry. AMD operates as an innovative chip designer focusing on high-performance processors and GPUs, while KLA specializes in semiconductor process control and yield management solutions. This analysis pits AMD’s growth-driven manufacturing against KLA’s capital-light precision tools. I aim to identify which corporate strategy offers superior risk-adjusted returns for a diversified portfolio in 2026.
Table of contents
Companies Overview
Advanced Micro Devices and KLA Corporation both stand as pivotal players in the semiconductor industry, shaping technology’s backbone.
Advanced Micro Devices, Inc.: Innovator in High-Performance Computing
Advanced Micro Devices dominates the semiconductor sector with cutting-edge microprocessors and graphics units. Its core revenue streams derive from computing and graphics segments, including Ryzen CPUs and Radeon GPUs. In 2026, the company sharpens its strategic focus on diversifying data center products and expanding semi-custom SoC solutions to capture emerging workloads.
KLA Corporation: Leader in Semiconductor Process Control
KLA Corporation commands the semiconductor equipment space, providing advanced process control and yield management solutions. Its revenue comes from integrated circuit manufacturing tools, wafer inspection, and metrology services. The firm’s 2026 strategy emphasizes enhancing defect detection technologies and expanding capabilities in PCB and display inspection markets.
Strategic Collision: Similarities & Divergences
Both companies thrive within semiconductor ecosystems but diverge in focus: AMD pursues chip design innovation while KLA specializes in manufacturing precision. Their primary battleground lies in addressing the semiconductor value chain—AMD on product performance, KLA on production quality. This contrast creates distinct investment profiles: growth-driven innovation versus steady, technology-enabling infrastructure.
Income Statement Comparison
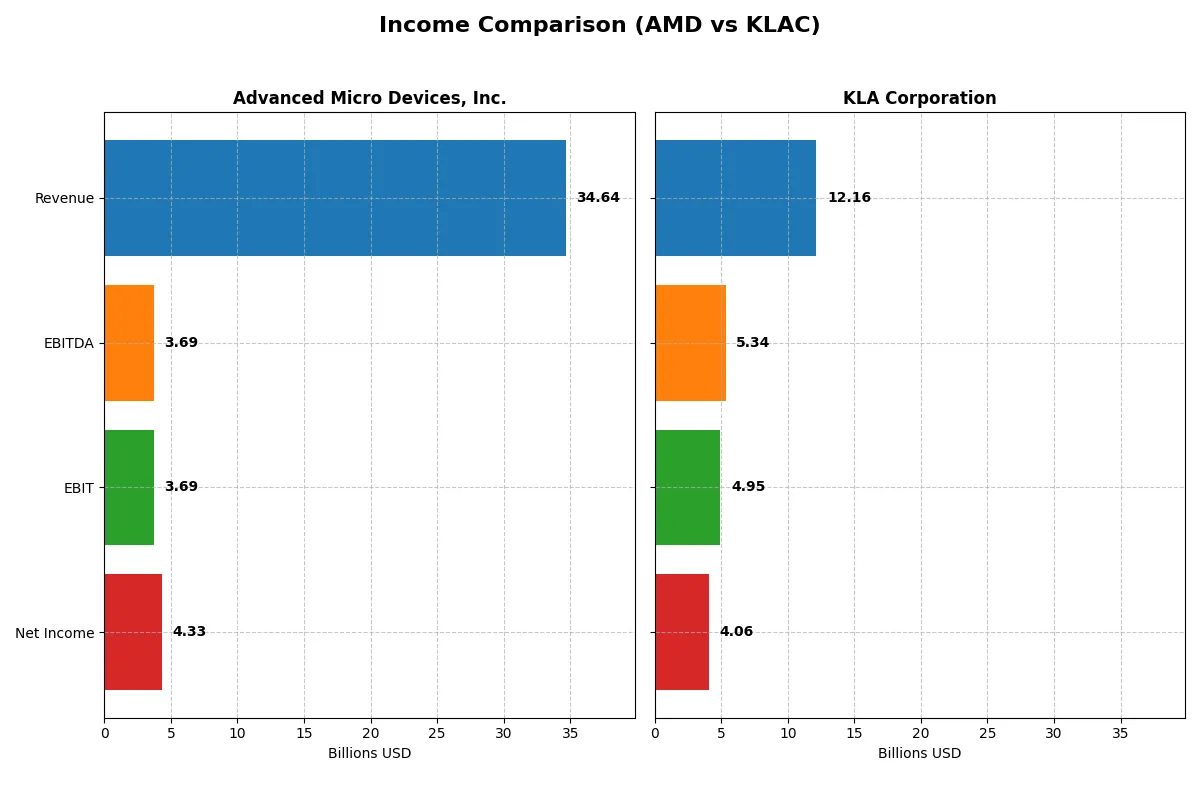
This data dissects the core profitability and scalability of both corporate engines to reveal who dominates the bottom line:
| Metric | Advanced Micro Devices, Inc. (AMD) | KLA Corporation (KLAC) |
|---|---|---|
| Revenue | 34.6B | 12.2B |
| Cost of Revenue | 17.5B | 4.6B |
| Operating Expenses | 13.5B | 2.3B |
| Gross Profit | 17.2B | 7.6B |
| EBITDA | 3.7B | 5.3B |
| EBIT | 3.7B | 4.9B |
| Interest Expense | 131M | 302M |
| Net Income | 4.3B | 4.1B |
| EPS | 2.67 | 30.53 |
| Fiscal Year | 2025 | 2025 |
Income Statement Analysis: The Bottom-Line Duel
This income statement comparison reveals the true operational efficiency and profitability momentum of two leading semiconductor firms.
Advanced Micro Devices, Inc. Analysis
AMD’s revenue surged from 16.4B in 2021 to 34.6B in 2025, doubling in four years. Net income followed, climbing from 3.16B to 4.34B, reflecting strong earnings growth. Gross margin remains healthy at 49.5%, supported by efficient cost control. The net margin improved sharply to 12.5% in 2025, signaling enhanced profitability and operational momentum.
KLA Corporation Analysis
KLA’s revenue grew steadily from 6.92B in 2021 to 12.16B in 2025, a solid 76% increase. Net income rose impressively from 2.08B to 4.06B, with a robust net margin of 33.4% in 2025. The gross margin of 62.3% and EBIT margin of 40.7% demonstrate KLA’s superior cost efficiency and pricing power, fueling consistent profitability growth.
Margin Power vs. Revenue Scale
AMD exhibits rapid revenue expansion with improving but moderate margins, reflecting aggressive growth and reinvestment. KLA delivers higher margins and steady revenue gains, showcasing superior operational efficiency. KLA leads in profitability metrics, appealing to investors favoring margin resilience. AMD’s profile suits growth-oriented investors seeking scale and momentum.
Financial Ratios Comparison
These vital ratios act as a diagnostic tool to expose the underlying fiscal health, valuation premiums, and capital efficiency of the companies analyzed:
| Ratios | Advanced Micro Devices, Inc. (AMD) | KLA Corporation (KLAC) |
|---|---|---|
| ROE | 2.85% (2024) | 86.56% (2025) |
| ROIC | 2.49% (2024) | 37.97% (2025) |
| P/E | 124x (2024) | 29.3x (2025) |
| P/B | 3.52 (2024) | 25.39 (2025) |
| Current Ratio | 2.62 (2024) | 2.62 (2025) |
| Quick Ratio | 1.83 (2024) | 1.83 (2025) |
| D/E | 0.038 (2024) | 1.30 (2025) |
| Debt-to-Assets | 3.20% (2024) | 37.9% (2025) |
| Interest Coverage | 20.7x (2024) | 17.3x (2025) |
| Asset Turnover | 0.37 (2024) | 0.76 (2025) |
| Fixed Asset Turnover | 10.63 (2024) | 9.70 (2025) |
| Payout ratio | 0% (2024) | 22.3% (2025) |
| Dividend yield | 0% (2024) | 0.76% (2025) |
| Fiscal Year | 2024 | 2025 |
Efficiency & Valuation Duel: The Vital Signs
Financial ratios act as the company’s DNA, revealing hidden risks and operational excellence critical for investment decisions.
Advanced Micro Devices, Inc.
AMD posts a modest 12.5% net margin but suffers from zero return on equity and invested capital, signaling weak profitability. Its P/E ratio of 80.5 stretches valuation above industry norms. AMD does not pay dividends, instead reinvesting heavily in R&D, dedicating over 25% of revenue to innovation and growth.
KLA Corporation
KLAC delivers a strong 33.4% net margin and an impressive 86.6% return on equity, showcasing operational efficiency. Its P/E of 29.3 is high but more reasonable than AMD’s. KLAC maintains a modest 0.76% dividend yield, balancing shareholder returns with solid capital allocation and a healthy current ratio of 2.62.
Premium Valuation vs. Operational Safety
KLAC offers superior profitability and a more balanced risk profile despite a high valuation. AMD’s stretched multiples and lack of returns on equity raise caution. Investors seeking operational safety and steady returns may prefer KLAC’s profile, while AMD suits those prioritizing aggressive growth and reinvestment.
Which one offers the Superior Shareholder Reward?
I see AMD eschews dividends, focusing on reinvestment and growth with robust free cash flow of 3.4B in 2025. KLAC, conversely, pays a steady 0.76% yield with a 22-28% payout ratio, supported by strong free cash flow (28B). KLAC’s buybacks and dividends create a balanced, sustainable reward. AMD’s no-dividend stance banks on capital appreciation, while KLAC delivers immediate income plus buybacks. Given KLAC’s superior free cash flow yield, dividend sustainability, and buyback intensity, I conclude KLAC offers the more attractive total return profile in 2026.
Comparative Score Analysis: The Strategic Profile
The radar chart reveals the fundamental DNA and trade-offs of Advanced Micro Devices, Inc. (AMD) and KLA Corporation, highlighting their financial strengths and vulnerabilities:
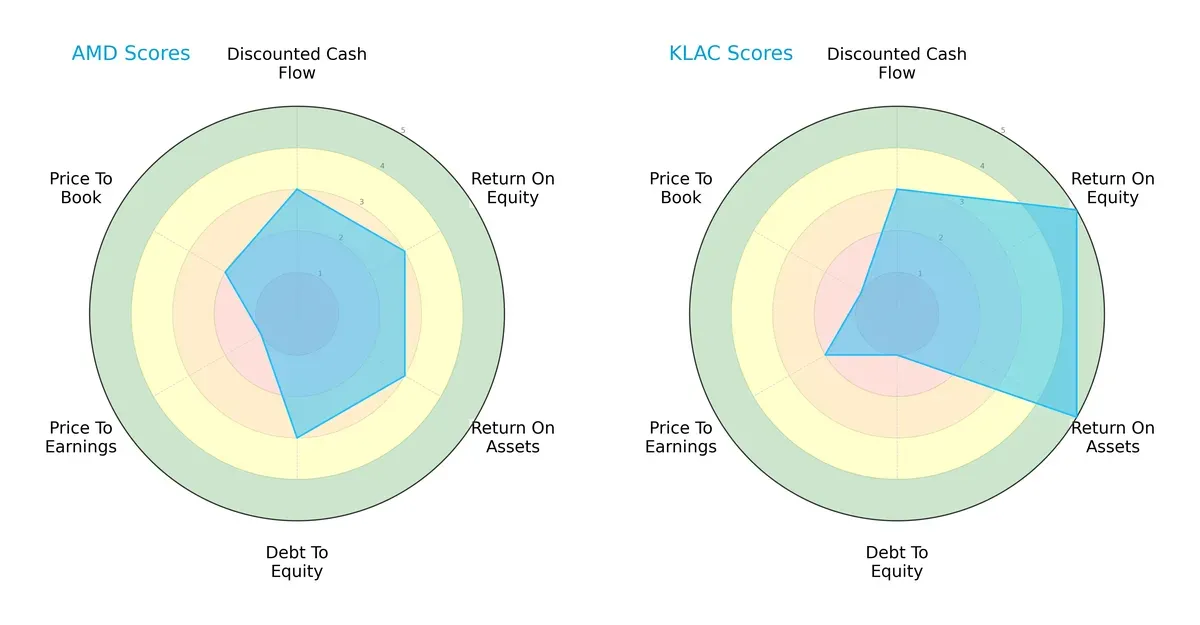
Both firms show moderate overall scores and DCF assessments, indicating similar valuation discipline. KLAC excels with very favorable ROE and ROA scores, reflecting superior profitability and asset utilization. Conversely, AMD maintains a balanced debt-to-equity and price-to-book profile, whereas KLAC’s financial leverage and valuation ratios appear riskier. KLAC relies heavily on operational efficiency, while AMD presents a more even risk-return distribution.
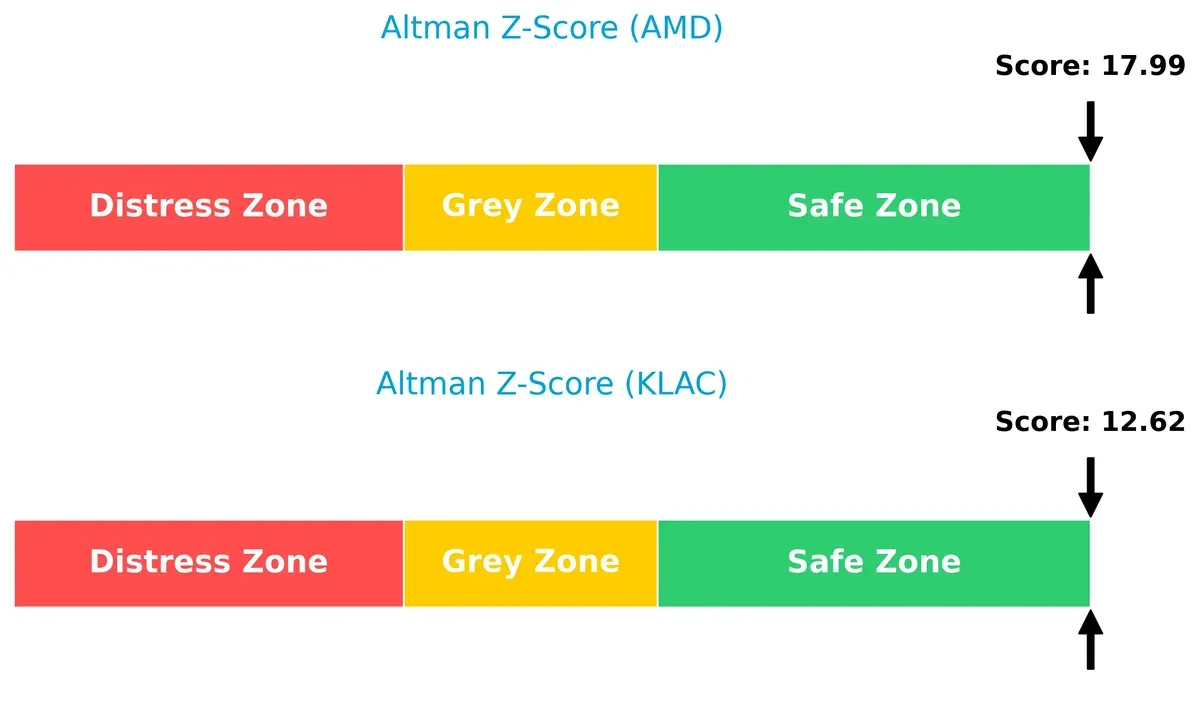
Bankruptcy Risk: Solvency Showdown
The Altman Z-Score gap indicates both AMD (18.0) and KLAC (12.6) reside comfortably in the safe zone, but AMD’s higher score suggests stronger solvency and lower bankruptcy risk in this cycle:
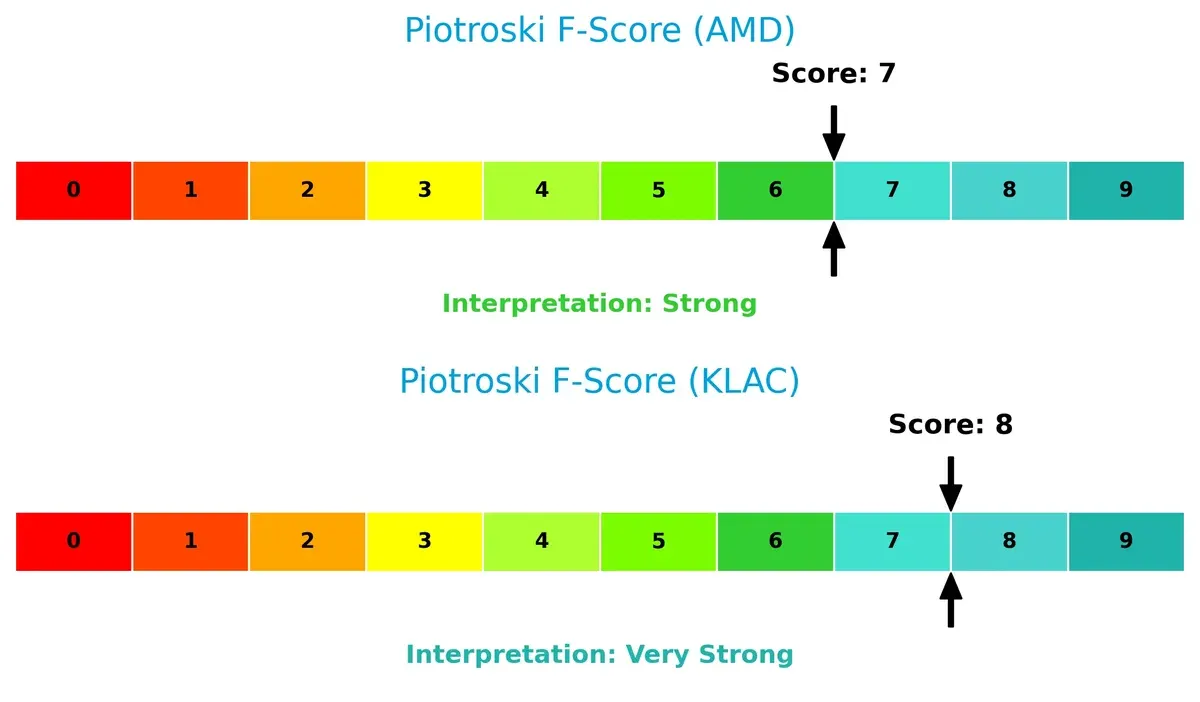
Financial Health: Quality of Operations
KLAC’s Piotroski F-Score of 8 outperforms AMD’s 7, signaling superior internal financial health and operational quality. KLAC shows fewer red flags in profitability, leverage, and liquidity metrics, reinforcing its robust financial footing:
How are the two companies positioned?
This section dissects the operational DNA of AMD and KLAC by comparing their revenue distribution and internal dynamics, highlighting strengths and weaknesses. The goal is to confront their economic moats and identify which model delivers the most resilient competitive advantage today.
Revenue Segmentation: The Strategic Mix
This visual comparison dissects how Advanced Micro Devices, Inc. and KLA Corporation diversify income streams and where their primary sector bets lie:
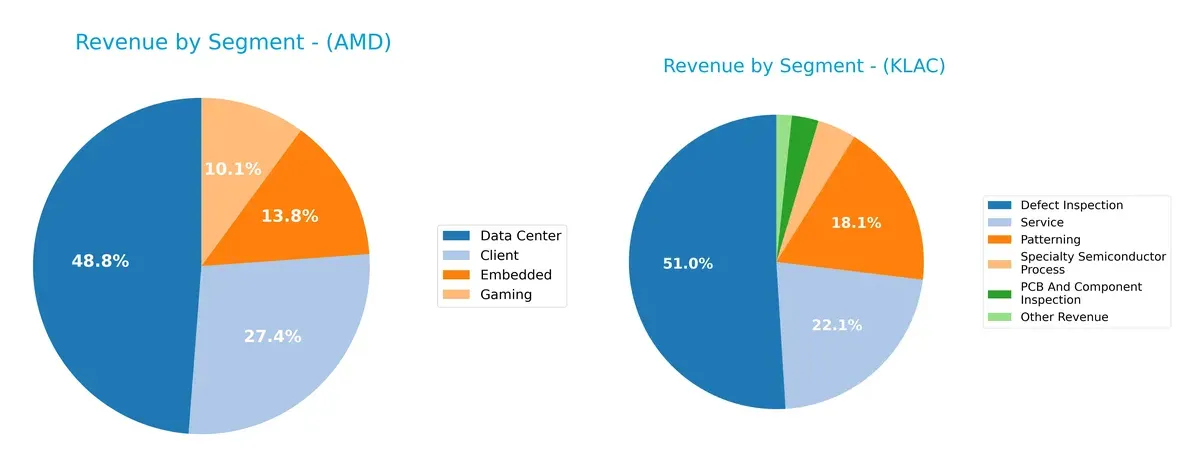
AMD’s revenue is more balanced across Data Center ($12.6B), Client ($7.1B), Embedded ($3.6B), and Gaming ($2.6B). KLA leans heavily on Defect Inspection ($6.2B) and Service ($2.7B), with smaller contributions from Patterning and others. AMD’s diversified mix reduces concentration risk and supports growth across multiple tech ecosystems. KLA’s reliance on Defect Inspection anchors its dominance but raises exposure to semiconductor cycle swings.
Strengths and Weaknesses Comparison
This table compares the Strengths and Weaknesses of AMD and KLAC based on diversification, profitability, financials, innovation, global presence, and market share:
AMD Strengths
- Diversified revenue streams across Client, Data Center, Embedded, and Gaming segments
- Favorable net margin at 12.5%
- Strong debt metrics and interest coverage ratio at 28.2
KLAC Strengths
- High profitability with net margin at 33.4% and ROE at 86.6%
- Favorable ROIC at 38% and strong fixed asset turnover
- Solid liquidity ratios with current ratio at 2.62 and quick ratio at 1.83
AMD Weaknesses
- Unfavorable ROE, ROIC, and WACC indicating weak capital efficiency
- High P/E ratio at 80.5 signals expensive valuation
- Weak liquidity (current and quick ratios at 0) and asset turnover metrics
KLAC Weaknesses
- Elevated debt-to-equity ratio at 1.3 with neutral debt-to-assets
- Unfavorable P/B and P/E ratios indicate valuation concerns
- Dividend yield low at 0.76% and WACC slightly unfavorable
Both companies show strengths in profitability and global reach but face valuation and efficiency challenges. AMD’s weaker capital returns contrast with KLAC’s robust profitability, affecting their strategic financial positioning.
The Moat Duel: Analyzing Competitive Defensibility
A structural moat shields long-term profits from relentless competitive erosion. Without it, gains quickly vanish in fierce markets:
Advanced Micro Devices, Inc.: Innovation-Driven Product Moat
AMD’s moat relies on innovation and product differentiation in high-performance computing and graphics. Yet, its declining ROIC signals weakening capital efficiency. New data center GPUs could deepen its moat if execution improves in 2026.
KLA Corporation: Process Control Precision Moat
KLA’s moat stems from specialized process control technologies dominating semiconductor manufacturing. Its ROIC outpaces WACC by 27%, reflecting strong value creation and margin stability. Expansion into emerging inspection markets promises further moat widening.
Innovation Edge vs. Operational Dominance
KLA holds the deeper moat with durable profitability and rising ROIC. AMD’s product innovation is notable but undermined by value destruction. KLA is better positioned to defend market share amid increasing industry complexity.
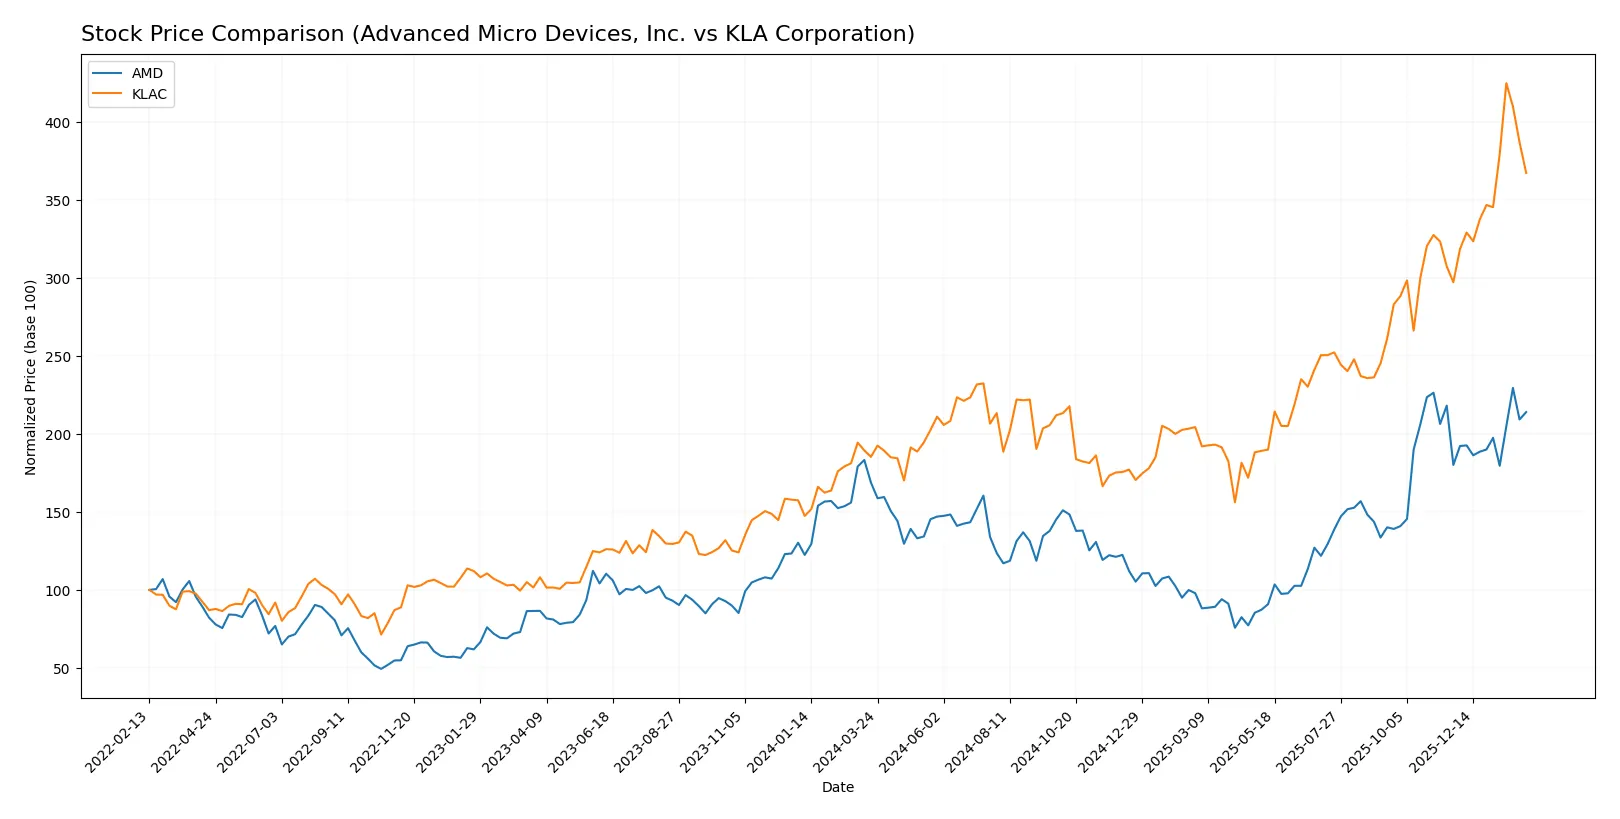
Which stock offers better returns?
The past year saw notable bullish trends for both AMD and KLAC, with KLAC exhibiting a significantly stronger price surge and higher volatility, while AMD showed steady acceleration and buyer dominance.
Trend Comparison
AMD’s stock rose 26.72% over the past 12 months, showing a bullish trend with accelerating momentum and moderate volatility. The price ranged from 85.76 to 259.68.
KLAC’s stock surged 98.21% in the same period, also bullish with accelerating momentum, but with much higher volatility. Prices fluctuated between 576.53 and 1567.82.
KLAC outperformed AMD markedly, delivering the highest market returns despite elevated volatility and a recent neutral buyer volume trend.
Target Prices
Analysts set clear target price ranges, reflecting cautious optimism for Advanced Micro Devices and KLA Corporation.
| Company | Target Low | Target High | Consensus |
|---|---|---|---|
| Advanced Micro Devices, Inc. | 225 | 380 | 291.56 |
| KLA Corporation | 1400 | 1900 | 1672.25 |
The consensus targets for AMD and KLAC sit well above their current prices of 242.11 and 1355.54, indicating upside potential amid ongoing semiconductor sector growth.

Don’t Let Luck Decide Your Entry Point
Optimize your entry points with our advanced ProRealTime indicators. You’ll get efficient buy signals with precise price targets for maximum performance. Start outperforming now!
How do institutions grade them?
Advanced Micro Devices, Inc. Grades
The following table summarizes recent analyst grades for Advanced Micro Devices, Inc.:
| Grading Company | Action | New Grade | Date |
|---|---|---|---|
| Wells Fargo | Maintain | Overweight | 2026-01-30 |
| Piper Sandler | Maintain | Overweight | 2026-01-26 |
| UBS | Maintain | Buy | 2026-01-26 |
| Bernstein | Maintain | Market Perform | 2026-01-21 |
| Keybanc | Upgrade | Overweight | 2026-01-13 |
| Truist Securities | Maintain | Buy | 2025-12-19 |
| Cantor Fitzgerald | Maintain | Overweight | 2025-12-16 |
| Morgan Stanley | Maintain | Equal Weight | 2025-11-12 |
| Wedbush | Maintain | Outperform | 2025-11-12 |
| Rosenblatt | Maintain | Buy | 2025-11-12 |
KLA Corporation Grades
The following table summarizes recent analyst grades for KLA Corporation:
| Grading Company | Action | New Grade | Date |
|---|---|---|---|
| Citigroup | Maintain | Buy | 2026-02-02 |
| Stifel | Maintain | Buy | 2026-01-30 |
| Cantor Fitzgerald | Maintain | Overweight | 2026-01-30 |
| Oppenheimer | Maintain | Outperform | 2026-01-30 |
| RBC Capital | Maintain | Sector Perform | 2026-01-30 |
| Barclays | Maintain | Overweight | 2026-01-30 |
| Needham | Maintain | Buy | 2026-01-30 |
| Jefferies | Maintain | Buy | 2026-01-30 |
| Wells Fargo | Maintain | Overweight | 2026-01-30 |
| Deutsche Bank | Maintain | Hold | 2026-01-21 |
Which company has the best grades?
KLA Corporation received more consistent “Buy” and “Overweight” ratings compared to Advanced Micro Devices, which had a wider range including “Market Perform” and “Equal Weight.” This suggests KLA’s consensus outlook is somewhat stronger, potentially influencing investor confidence positively.
Risks specific to each company
The following categories identify the critical pressure points and systemic threats facing both firms in the 2026 market environment:
1. Market & Competition
Advanced Micro Devices, Inc.
- Faces intense competition from Intel, Nvidia, and others, pressuring margins and innovation speed.
KLA Corporation
- Operates in a niche semiconductor process control market, with steady demand but cyclical exposure.
2. Capital Structure & Debt
Advanced Micro Devices, Inc.
- Maintains favorable debt ratios with strong interest coverage, minimizing financial distress risk.
KLA Corporation
- Higher debt-to-equity ratio at 1.3 signals elevated financial leverage and potential refinancing risk.
3. Stock Volatility
Advanced Micro Devices, Inc.
- Beta of 1.95 indicates high sensitivity to market swings, increasing risk in turbulent markets.
KLA Corporation
- Lower beta of 1.46 suggests more moderate volatility compared to AMD.
4. Regulatory & Legal
Advanced Micro Devices, Inc.
- Subject to global technology export controls and IP litigation risks in semiconductor sector.
KLA Corporation
- Faces regulatory scrutiny on environmental compliance and export regulations in manufacturing processes.
5. Supply Chain & Operations
Advanced Micro Devices, Inc.
- Global chip shortages and geopolitical tensions pose risks to supply continuity and costs.
KLA Corporation
- Relies on specialized equipment supply chains vulnerable to disruption but benefits from strong customer ties.
6. ESG & Climate Transition
Advanced Micro Devices, Inc.
- Pressure to improve energy efficiency and reduce carbon footprint in manufacturing operations.
KLA Corporation
- Active in sustainability initiatives but exposed to rising costs from stricter climate regulations.
7. Geopolitical Exposure
Advanced Micro Devices, Inc.
- High exposure to US-China trade tensions impacting semiconductor sales and R&D collaboration.
KLA Corporation
- Also exposed to geopolitical risks but with a more diversified global customer base mitigating impact.
Which company shows a better risk-adjusted profile?
AMD’s highest risk lies in its market competition and stock volatility, amplified by an unfavorable valuation and financial ratios. KLA faces meaningful capital structure risks due to higher leverage but benefits from a stronger profitability profile and more stable stock behavior. Recent data shows AMD’s beta nearing 2, heightening market sensitivity, whereas KLA’s debt load and price-to-book ratio demand caution. Overall, KLA offers a better risk-adjusted profile, balancing solid returns against manageable financial risks.
Final Verdict: Which stock to choose?
Advanced Micro Devices (AMD) shines with its relentless innovation and rapid revenue growth, positioning it as a dynamic cash generator in a fast-evolving tech landscape. However, its declining ROIC and stretched valuation signal a point of vigilance. AMD fits well with aggressive growth portfolios willing to embrace higher risk for potential outsized returns.
KLA Corporation boasts a robust economic moat with a durable competitive advantage and consistently high returns on invested capital. Its superior profitability and stable cash flows offer stronger financial resilience compared to AMD. KLA suits investors seeking GARP (Growth at a Reasonable Price) profiles favoring stability alongside growth.
If you prioritize high-growth potential and are comfortable with elevated valuation risks, AMD presents a compelling scenario due to its innovation-driven momentum. However, if you seek better stability and proven capital efficiency, KLA outshines with a durable moat and superior profitability metrics. Both cases demand careful risk assessment aligned with your investment strategy.
Disclaimer: Investment carries a risk of loss of initial capital. The past performance is not a reliable indicator of future results. Be sure to understand risks before making an investment decision.
Go Further
I encourage you to read the complete analyses of Advanced Micro Devices, Inc. and KLA Corporation to enhance your investment decisions: