Home > Comparison > Technology > AMD vs INTC
The strategic rivalry between Advanced Micro Devices, Inc. (AMD) and Intel Corporation shapes the semiconductor industry’s future. AMD operates as a nimble innovator with a focus on high-performance CPUs and GPUs. Intel, a capital-intensive giant, leverages its vast scale across diverse computing segments. This analysis pits growth-driven agility against established scale dominance to identify which trajectory offers superior risk-adjusted returns for a diversified portfolio.
Table of contents
Companies Overview
Advanced Micro Devices and Intel dominate the semiconductor sector with distinct market approaches and sizable footprints.
Advanced Micro Devices, Inc.: Agile Innovator in Semiconductors
Advanced Micro Devices excels as a semiconductor powerhouse, generating revenue through CPUs, GPUs, and semi-custom SoCs. Its Computing and Graphics and Enterprise segments drive growth. In 2026, AMD sharpens its focus on high-performance processors and data center GPUs, leveraging customization and energy efficiency to penetrate cloud and gaming markets aggressively.
Intel Corporation: Legacy Titan with Broad Technology Reach
Intel leads as a broad-based semiconductor and technology firm, making money from CPUs, chipsets, and diversified platform products. It serves multiple verticals, including cloud, AI, and autonomous driving. In 2026, Intel prioritizes innovation in high-performance compute solutions and AI partnerships, aiming to reclaim leadership in cloud services and edge computing markets.
Strategic Collision: Similarities & Divergences
AMD embraces a focused, high-performance product strategy while Intel pursues a diversified platform approach integrating AI and autonomous tech. Their primary battlefield is the server and cloud infrastructure sector, where processor efficiency and scalability matter most. AMD offers a nimble growth profile, whereas Intel presents a legacy-rich, broad technology investment case with greater scale and diversification.
Income Statement Comparison
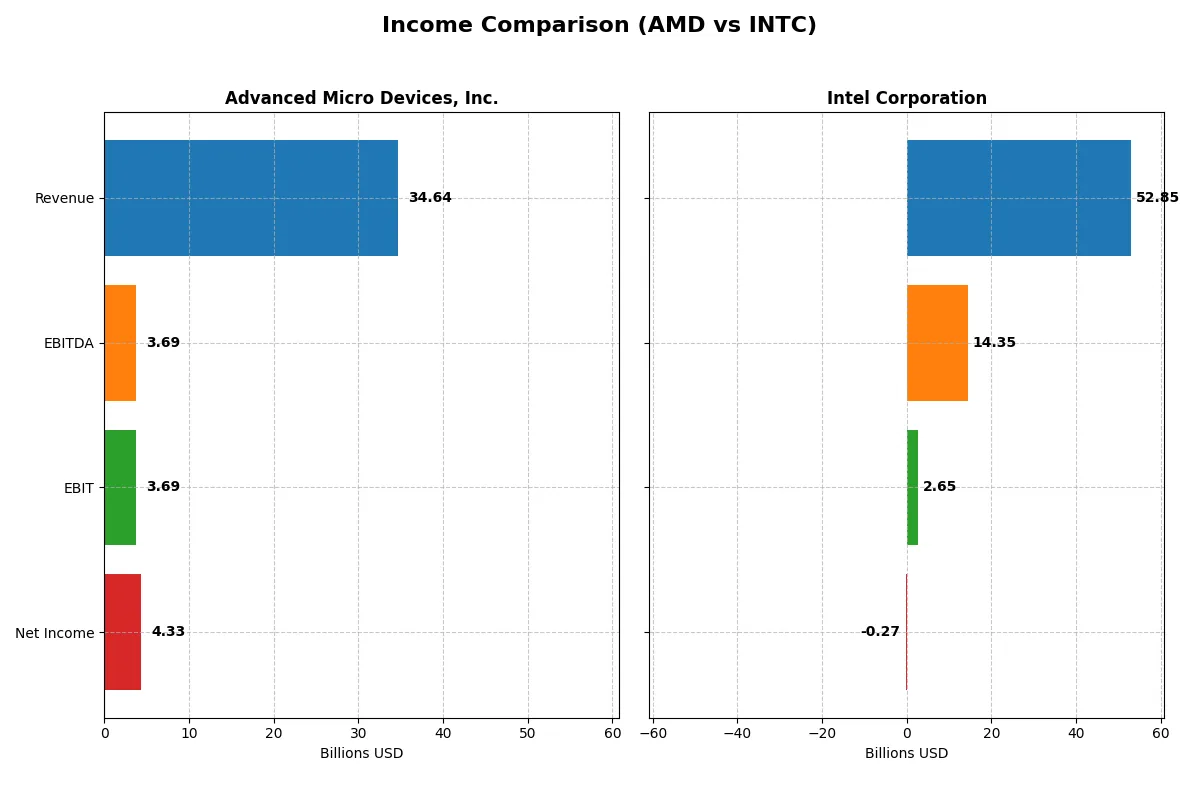
The following data dissects the core profitability and scalability of both corporate engines to reveal who dominates the bottom line:
| Metric | Advanced Micro Devices, Inc. (AMD) | Intel Corporation (INTC) |
|---|---|---|
| Revenue | 34.6B | 52.9B |
| Cost of Revenue | 17.5B | 34.5B |
| Operating Expenses | 13.5B | 18.4B |
| Gross Profit | 17.2B | 18.4B |
| EBITDA | 3.7B | 14.4B |
| EBIT | 3.7B | 2.6B |
| Interest Expense | 131M | 1.1B |
| Net Income | 4.3B | -267M |
| EPS | 2.67 | -0.08 |
| Fiscal Year | 2025 | 2025 |
Income Statement Analysis: The Bottom-Line Duel
This income statement comparison reveals which company runs a more efficient and profitable corporate engine through revenue growth and margin control.
Advanced Micro Devices, Inc. (AMD) Analysis
AMD’s revenue surged from 16.4B in 2021 to 34.6B in 2025, doubling over five years. Net income climbed steadily, hitting 4.3B in 2025, reflecting robust margin expansion. Gross margin stands strong at 49.5%, and net margin improved to 12.5%, illustrating efficient cost management and accelerating profitability momentum.
Intel Corporation (INTC) Analysis
Intel’s revenue declined from 79B in 2021 to 52.9B in 2025, losing scale amid a shrinking market. Net income turned sharply negative in 2025, posting a -267M loss. Gross margin dropped to 34.8%, while net margin slipped into negative territory at -0.5%, signaling pressure on profitability despite some EBIT margin recovery.
Growth Efficiency vs. Scale Decline
AMD clearly outpaces Intel with strong revenue growth and expanding margins, turning operational gains into solid net profits. Intel struggles with declining revenue and negative net income, undermining its historical scale advantage. For investors prioritizing growth and profitability, AMD’s efficient, upward trajectory presents a more compelling profile.
Financial Ratios Comparison
These vital ratios act as a diagnostic tool to expose the underlying fiscal health, valuation premiums, and capital efficiency of the companies compared:
| Ratios | Advanced Micro Devices, Inc. (AMD) | Intel Corporation (INTC) |
|---|---|---|
| ROE | 2.85% (2024) | -0.23% (2025) |
| ROIC | 2.49% (2024) | -0.0002% (2025) |
| P/E | 124 (2024) | -658 (2025) |
| P/B | 3.52 (2024) | 1.54 (2025) |
| Current Ratio | 2.62 (2024) | 2.02 (2025) |
| Quick Ratio | 1.83 (2024) | 1.65 (2025) |
| D/E (Debt-to-Equity) | 3.84% (2024) | 40.76% (2025) |
| Debt-to-Assets | 3.20% (2024) | 22.03% (2025) |
| Interest Coverage | 20.65 (2024) | -0.02 (2025) |
| Asset Turnover | 0.37 (2024) | 0.25 (2025) |
| Fixed Asset Turnover | 10.63 (2024) | 0.50 (2025) |
| Payout Ratio | 0% (2024) | 0% (2025) |
| Dividend Yield | 0% (2024) | 0% (2025) |
| Fiscal Year | 2024 | 2025 |
Efficiency & Valuation Duel: The Vital Signs
Financial ratios act as a company’s DNA, uncovering hidden risks and revealing core operational strengths and weaknesses.
Advanced Micro Devices, Inc.
AMD posts a strong net margin of 12.5%, signaling operational efficiency, but its ROE and ROIC drop to zero, raising concerns. The P/E ratio of 80.5 marks the stock as highly expensive. AMD does not pay dividends, instead reinvesting heavily in R&D, fueling future growth potential amid stretched valuation metrics.
Intel Corporation
Intel shows negative profitability metrics with a net margin of -0.5% and ROE of -0.23%, reflecting operational challenges. Its P/E ratio is negative but flagged favorable due to accounting quirks. Intel maintains solid liquidity ratios and modest leverage. It offers no dividend, focusing on restructuring and R&D to regain competitiveness, though risks remain elevated.
Premium Valuation vs. Operational Struggles
AMD’s high valuation contrasts with Intel’s operational weakness but better liquidity. AMD’s growth profile suits risk-tolerant investors chasing innovation. Intel appeals more to those prioritizing balance sheet stability amid ongoing turnaround efforts.
Which one offers the Superior Shareholder Reward?
I observe AMD invests heavily in growth, with zero dividends but strong free cash flow (3.4/share in 2025) and disciplined capex (0.6/share). Its buyback program remains limited but sustainable. Intel pays a modest dividend yield (~1.8% in 2025) but struggles with negative free cash flow (-1B+) and heavy capex (3B+), impairing buybacks. AMD’s reinvestment strategy promises superior long-term returns, while Intel’s yield is vulnerable amid profitability challenges. I conclude AMD offers a more attractive total return profile in 2026.
Comparative Score Analysis: The Strategic Profile
The radar chart reveals the fundamental DNA and trade-offs of Advanced Micro Devices, Inc. and Intel Corporation, highlighting their financial strengths and valuation disparities:
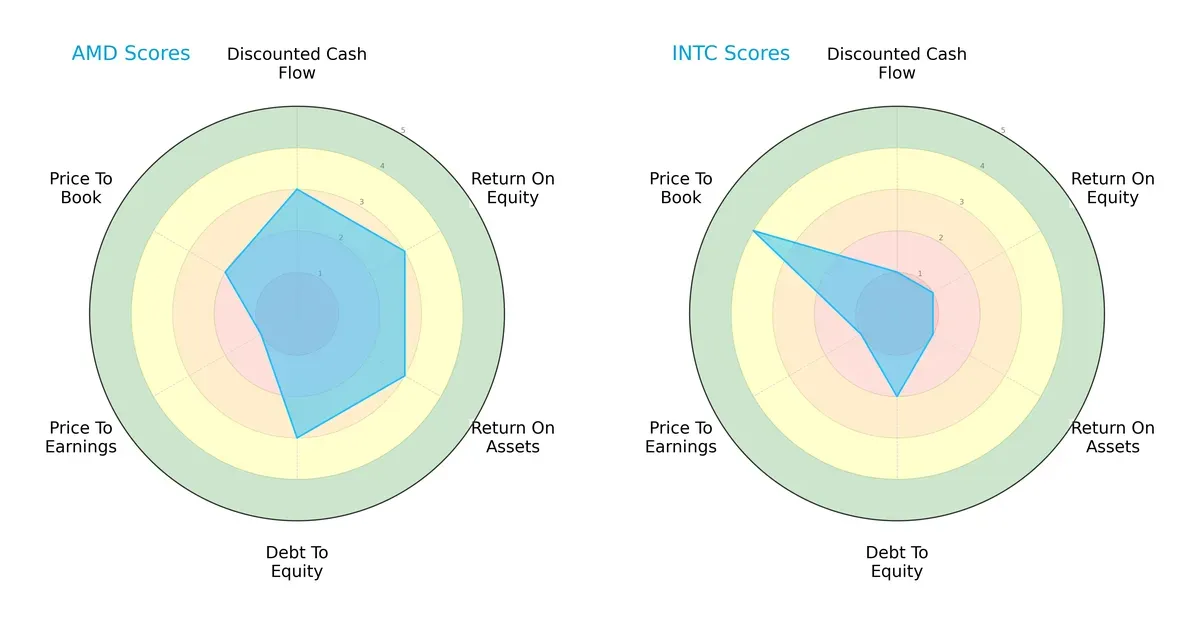
AMD demonstrates a more balanced profile with moderate scores across DCF, ROE, ROA, and Debt/Equity, reflecting steady operational efficiency and prudent leverage. Intel leans heavily on valuation strength with a favorable Price-to-Book score but suffers from weak profitability and cash flow metrics. AMD’s diversified strengths suggest a resilient growth strategy, while Intel depends mainly on its asset base valuation.
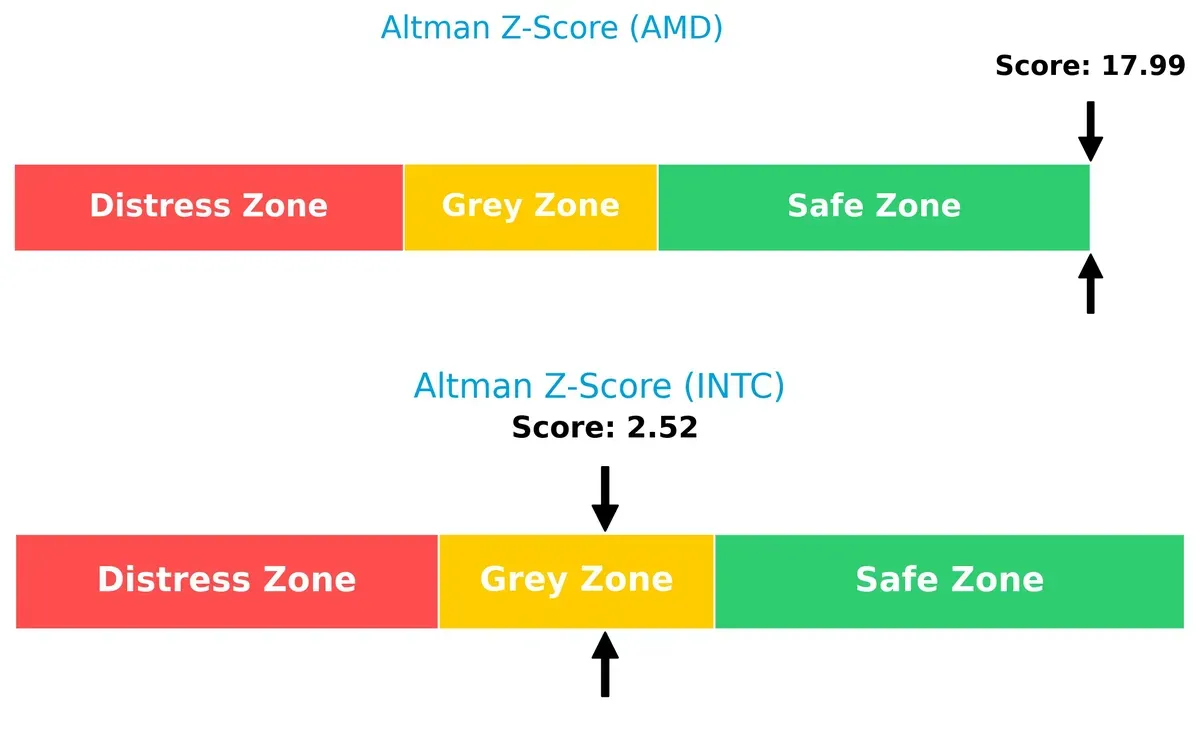
Bankruptcy Risk: Solvency Showdown
AMD’s Altman Z-Score at 17.99 places it safely in the secure zone, signaling robust financial health. Intel’s 2.52 score lands in the grey zone, indicating moderate bankruptcy risk in this cycle:
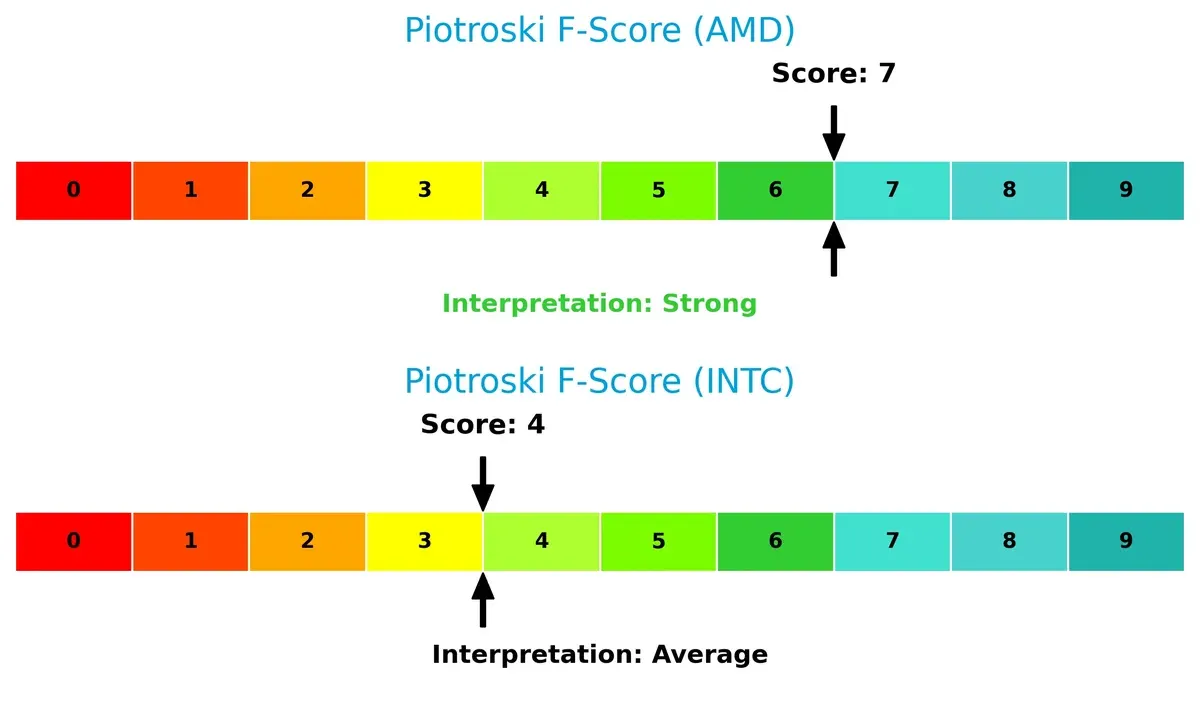
Financial Health: Quality of Operations
AMD’s Piotroski F-Score of 7 signals strong financial health and operational quality. Intel’s score of 4 is average, raising concerns about internal inefficiencies and potential red flags:
How are the two companies positioned?
This section dissects AMD and INTC’s operational DNA by comparing their revenue distribution and internal strengths and weaknesses. The goal is to confront their economic moats to identify which model delivers the most resilient, sustainable competitive advantage in today’s semiconductor market.
Revenue Segmentation: The Strategic Mix
This visual comparison dissects how Advanced Micro Devices, Inc. and Intel Corporation diversify their income streams and reveals where their primary sector bets lie:
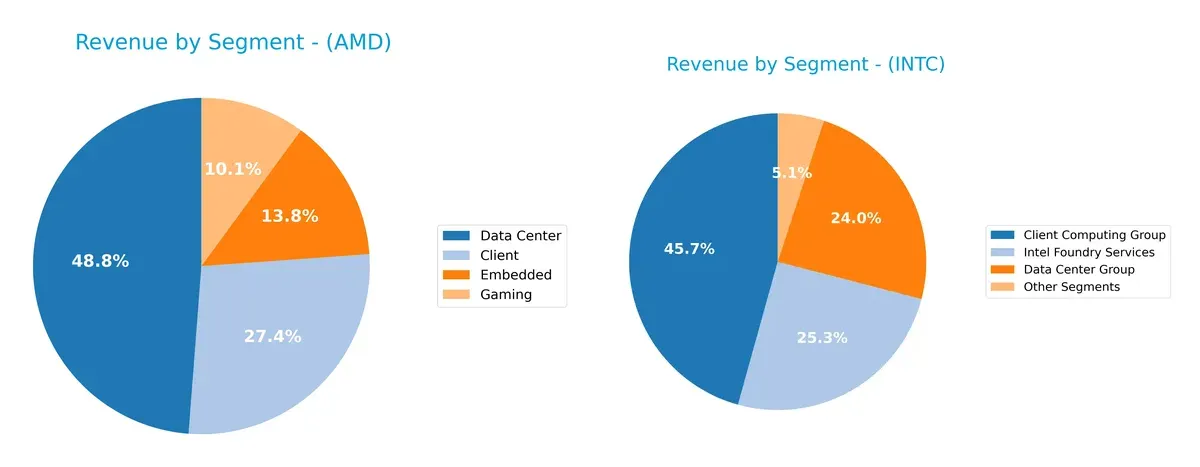
AMD’s revenue spreads more evenly across Data Center ($12.6B), Client ($7.1B), Embedded ($3.6B), and Gaming ($2.6B) segments. Intel leans heavily on Client Computing ($30.3B) and Intel Foundry Services ($17.5B), with Data Center at $12.8B. AMD’s balanced mix reduces concentration risk, while Intel’s reliance on a few dominant segments signals infrastructure dominance but increases exposure to market shifts in PC and foundry demand.
Strengths and Weaknesses Comparison
This table compares the strengths and weaknesses of AMD and Intel based on diversification, profitability, financials, innovation, global presence, and market share:
AMD Strengths
- Diversified revenue with strong growth in Data Center and Client segments
- Favorable net margin at 12.5%
- Low debt-to-assets ratio and high interest coverage at 28.2x
- Significant presence in key Asian markets including China and Taiwan
- Growing Gaming revenue segment
Intel Strengths
- Extensive diversification across Client Computing, Data Center, and Foundry Services
- Favorable current and quick ratios indicating liquidity strength
- Moderate debt levels with favorable debt-to-assets at 22%
- Large global footprint with strong sales in US, China, and Singapore
- Strong market share in Client Computing and Data Center
AMD Weaknesses
- Negative ROE and ROIC below WACC at 12.9% indicating poor capital returns
- High P/E of 80.5 suggests overvaluation risk
- Unfavorable liquidity ratios (current and quick ratio zero)
- Weak asset turnover metrics
- No dividend yield
Intel Weaknesses
- Negative net margin and ROE reflecting profitability challenges
- ROIC below WACC signals value destruction
- Unfavorable asset turnover and fixed asset turnover
- Neutral interest coverage at 2.43x may pressure debt service
- No dividend yield
Both companies show strengths in diversification and global presence but face profitability and efficiency challenges. AMD’s high valuation and weak liquidity ratios contrast with Intel’s better liquidity but deeper profitability issues. These factors shape their strategic priorities differently.
The Moat Duel: Analyzing Competitive Defensibility
A structural moat is the only shield protecting long-term profits from relentless competitive erosion in the semiconductor industry:
Advanced Micro Devices, Inc.: Innovation-Driven Switching Costs
AMD’s moat lies in its cutting-edge processor architectures and GPU designs that lock in customers. This drives high gross margins (49.5%) and robust revenue growth (34% in 2025). However, its declining ROIC signals weakening capital efficiency, challenging its ability to sustain this advantage into 2026.
Intel Corporation: Legacy Scale and Ecosystem Integration
Intel’s moat is grounded in its vast manufacturing scale and entrenched customer ecosystem, contrasting AMD’s innovation focus. Despite negative net margins and revenue declines, Intel’s recent EBIT rebound (126% growth) hints at potential operational turnaround. Yet, its deteriorating ROIC reveals struggles in capital productivity amid industry disruption.
Innovation Agility vs. Scale Entrenchment
Both firms face deteriorating ROIC trends, signaling value destruction despite differing moats. AMD’s innovation-driven switching costs offer sharper growth but less capital efficiency. Intel’s scale is deep but less agile. I see AMD better positioned to defend market share through innovation, while Intel must resolve efficiency challenges to remain competitive.
Which stock offers better returns?
The past year shows strong bullish momentum for both stocks, with Advanced Micro Devices accelerating higher amid higher volatility, while Intel gains steadily with rising volume and less price fluctuation.
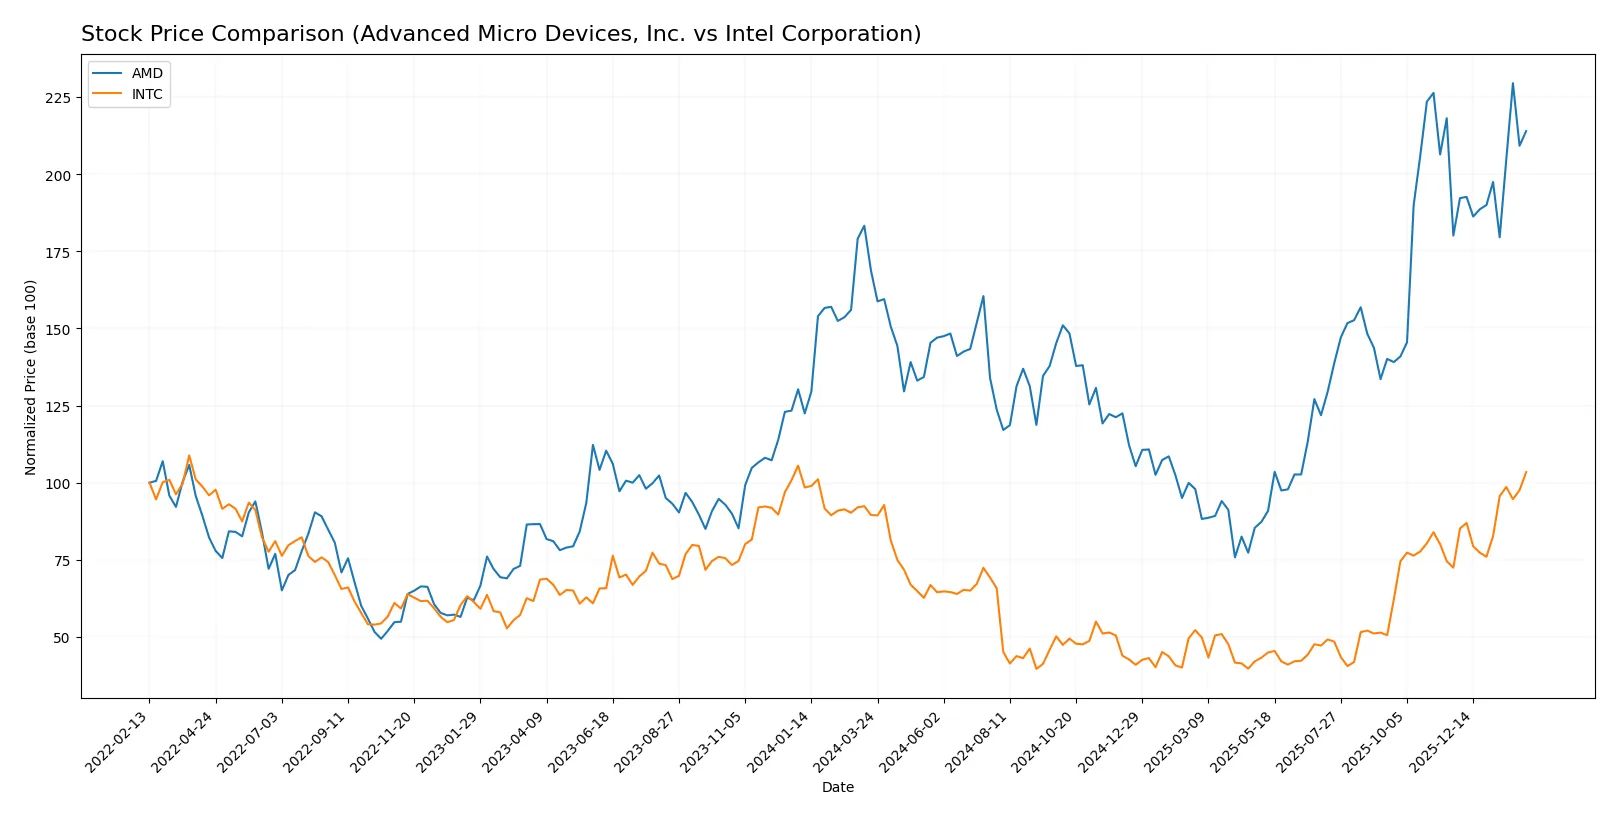
Trend Comparison
Advanced Micro Devices, Inc. displays a 26.72% price increase over the past 12 months, reflecting a bullish trend with accelerating momentum and high volatility marked by a 41.61 std deviation.
Intel Corporation’s stock rose 15.5% over the same period, also bullish with acceleration but lower volatility at 8.23 std deviation, indicating steadier price movement.
AMD leads in market performance with a significantly higher total return and stronger acceleration, despite greater volatility compared to Intel’s more stable upward trend.
Target Prices
Analysts present a cautiously optimistic consensus for Advanced Micro Devices, Inc. and Intel Corporation.
| Company | Target Low | Target High | Consensus |
|---|---|---|---|
| Advanced Micro Devices, Inc. | 225 | 380 | 291.56 |
| Intel Corporation | 20 | 66 | 46.9 |
The consensus target for AMD sits about 20% above its current price of 242, signaling expected growth. Intel’s consensus target is slightly below its current price of 49.25, reflecting more tempered expectations.

Don’t Let Luck Decide Your Entry Point
Optimize your entry points with our advanced ProRealTime indicators. You’ll get efficient buy signals with precise price targets for maximum performance. Start outperforming now!
How do institutions grade them?
The following tables summarize recent institutional grades for Advanced Micro Devices, Inc. and Intel Corporation:
Advanced Micro Devices, Inc. Grades
This table lists recent grades and rating actions from well-known financial institutions.
| Grading Company | Action | New Grade | Date |
|---|---|---|---|
| Wells Fargo | Maintain | Overweight | 2026-01-30 |
| Piper Sandler | Maintain | Overweight | 2026-01-26 |
| UBS | Maintain | Buy | 2026-01-26 |
| Bernstein | Maintain | Market Perform | 2026-01-21 |
| Keybanc | Upgrade | Overweight | 2026-01-13 |
| Truist Securities | Maintain | Buy | 2025-12-19 |
| Cantor Fitzgerald | Maintain | Overweight | 2025-12-16 |
| Morgan Stanley | Maintain | Equal Weight | 2025-11-12 |
| Wedbush | Maintain | Outperform | 2025-11-12 |
| Rosenblatt | Maintain | Buy | 2025-11-12 |
Intel Corporation Grades
This table presents recent grades and rating actions from established grading companies.
| Grading Company | Action | New Grade | Date |
|---|---|---|---|
| Benchmark | Maintain | Buy | 2026-01-23 |
| Wedbush | Maintain | Neutral | 2026-01-23 |
| Citigroup | Maintain | Neutral | 2026-01-23 |
| Roth Capital | Maintain | Neutral | 2026-01-23 |
| RBC Capital | Maintain | Sector Perform | 2026-01-23 |
| Morgan Stanley | Maintain | Equal Weight | 2026-01-23 |
| Evercore ISI Group | Maintain | In Line | 2026-01-23 |
| Needham | Maintain | Hold | 2026-01-23 |
| Rosenblatt | Maintain | Sell | 2026-01-23 |
| Stifel | Maintain | Hold | 2026-01-23 |
Which company has the best grades?
Advanced Micro Devices, Inc. has generally received more favorable grades, including multiple “Buy” and “Overweight” ratings. Intel Corporation’s ratings skew more neutral to cautious, with several “Hold” and “Neutral” grades and one “Sell.” This differential could influence investor sentiment and portfolio positioning.
Risks specific to each company
The following categories identify the critical pressure points and systemic threats facing both Advanced Micro Devices, Inc. (AMD) and Intel Corporation (INTC) in the 2026 market environment:
1. Market & Competition
Advanced Micro Devices, Inc. (AMD)
- Faces intense competition from Intel and other chipmakers, pressured by high P/E ratio signaling overvaluation risk.
Intel Corporation (INTC)
- Competes with AMD’s innovation pace while struggling with negative net margin and ROE, signaling operational challenges.
2. Capital Structure & Debt
Advanced Micro Devices, Inc. (AMD)
- Maintains low debt-to-equity and strong interest coverage, indicating solid balance sheet and manageable financial risk.
Intel Corporation (INTC)
- Shows moderate leverage with debt-to-equity of 0.41 and favorable debt-to-assets, but interest coverage is only neutral at 2.43x.
3. Stock Volatility
Advanced Micro Devices, Inc. (AMD)
- Exhibits high beta at 1.949, meaning the stock is significantly more volatile than the market average.
Intel Corporation (INTC)
- Lower beta of 1.377 suggests less volatility, offering comparatively steadier price movements.
4. Regulatory & Legal
Advanced Micro Devices, Inc. (AMD)
- Operates globally with exposure to varying tech regulations but no specific recent legal issues reported.
Intel Corporation (INTC)
- Faces regulatory scrutiny in multiple jurisdictions, especially around antitrust concerns and export controls.
5. Supply Chain & Operations
Advanced Micro Devices, Inc. (AMD)
- Relies on third-party foundries, exposing it to supply chain disruptions but benefits from flexible manufacturing partnerships.
Intel Corporation (INTC)
- Vertically integrated but has faced recent production delays, impacting time-to-market and operational efficiency.
6. ESG & Climate Transition
Advanced Micro Devices, Inc. (AMD)
- Strong ESG initiatives with emphasis on reducing carbon footprint and sustainable product development.
Intel Corporation (INTC)
- Also advancing ESG goals but bears higher legacy operational risks due to larger scale and older facilities.
7. Geopolitical Exposure
Advanced Micro Devices, Inc. (AMD)
- Significant exposure to US-China tensions affecting semiconductor supply chains and export licenses.
Intel Corporation (INTC)
- Similar geopolitical risks with added complexity due to broader global manufacturing footprint.
Which company shows a better risk-adjusted profile?
AMD’s most impactful risk lies in its high stock volatility and valuation premium, which could amplify market shocks. Intel’s primary risk is its operational inefficiency and negative profitability metrics, reflecting deeper structural issues. Despite AMD’s valuation concerns, its stronger balance sheet, higher Altman Z-Score (17.99, safe zone), and robust Piotroski score (7, strong) suggest a better risk-adjusted profile. Intel’s grey zone Altman Z-Score (2.52) and average Piotroski score (4) highlight vulnerability amid ongoing profitability struggles. The recent spike in AMD’s beta contrasts with Intel’s operational headwinds, tipping the scale in AMD’s favor for investors prioritizing financial stability and growth potential.
Final Verdict: Which stock to choose?
Advanced Micro Devices (AMD) excels as a high-velocity innovator with unmatched revenue growth and strong cash flow generation. Its aggressive R&D investment fuels competitive edge but signals a point of vigilance on capital efficiency. AMD suits portfolios targeting aggressive growth and market disruption.
Intel Corporation (INTC) offers a strategic moat rooted in legacy scale and a stable balance sheet. Its slower growth contrasts with a more conservative financial profile, providing relative safety. Intel aligns well with GARP investors seeking steady income with reasonable risk.
If you prioritize rapid growth and innovation, AMD is the compelling choice due to its dynamic revenue momentum and cash conversion strength. However, if you seek stability and a defensive stance, Intel offers better capital preservation despite slower expansion. Both present analytical scenarios requiring careful risk tolerance calibration.
Disclaimer: Investment carries a risk of loss of initial capital. The past performance is not a reliable indicator of future results. Be sure to understand risks before making an investment decision.
Go Further
I encourage you to read the complete analyses of Advanced Micro Devices, Inc. and Intel Corporation to enhance your investment decisions: