Home > Comparison > Technology > AMD vs INDI
The strategic rivalry between Advanced Micro Devices, Inc. (AMD) and indie Semiconductor, Inc. shapes the semiconductor sector’s innovation landscape. AMD operates as a global leader with a broad portfolio spanning computing and graphics, while indie Semiconductor focuses on niche automotive semiconductor solutions. This head-to-head highlights a classic contrast between scale and specialization. This analysis aims to identify which trajectory offers superior risk-adjusted returns for a diversified portfolio in 2026.
Table of contents
Companies Overview
Advanced Micro Devices, Inc. and indie Semiconductor, Inc. play pivotal roles in the semiconductor industry with distinct market footprints.
Advanced Micro Devices, Inc.: Leader in High-Performance Computing
Advanced Micro Devices, Inc. dominates the semiconductor sector with a diverse product portfolio in computing and graphics. Its core revenue stems from x86 microprocessors, GPUs, and custom SoCs targeting PCs, servers, and game consoles. In 2026, AMD focuses strategically on expanding data center and professional GPU markets to leverage growing cloud and AI demand.
indie Semiconductor, Inc.: Innovator in Automotive Semiconductors
indie Semiconductor, Inc. specializes in automotive semiconductors and software, enabling advanced driver assistance and connected car solutions. Revenue primarily comes from devices supporting parking assistance, wireless charging, infotainment, and telematics. Its 2026 strategy emphasizes broadening photonic component applications and strengthening software integration for electrification and user experience enhancements.
Strategic Collision: Similarities & Divergences
AMD and indie Semiconductor share a technology-driven innovation approach but diverge in end markets—general computing versus automotive. They compete indirectly as AMD targets high-performance computing ecosystems, while indie bets on automotive electrification and connectivity. Their investment profiles differ sharply: AMD leverages scale and product breadth, whereas indie embodies a specialized, high-beta growth play in automotive semiconductors.
Income Statement Comparison
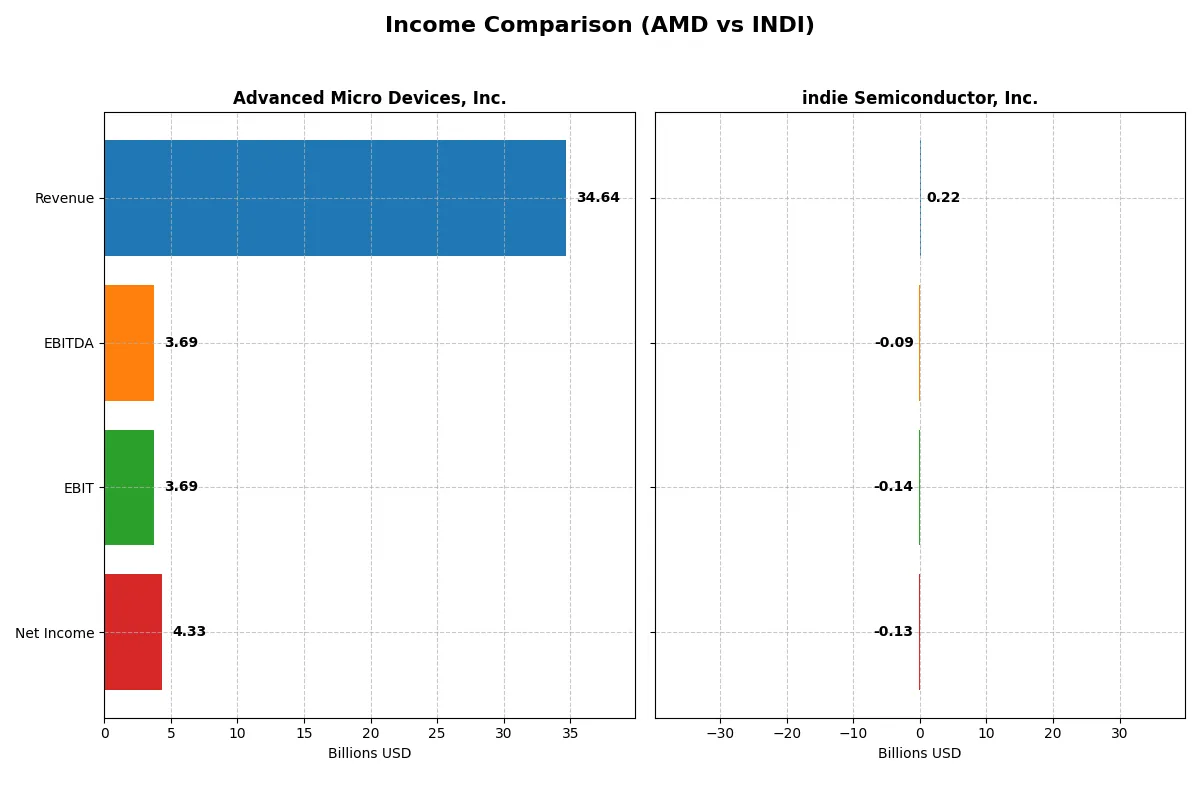
This data dissects the core profitability and scalability of both corporate engines to reveal who dominates the bottom line:
| Metric | Advanced Micro Devices, Inc. (AMD) | indie Semiconductor, Inc. (INDI) |
|---|---|---|
| Revenue | 34.6B | 217M |
| Cost of Revenue | 17.5B | 126M |
| Operating Expenses | 13.5B | 260M |
| Gross Profit | 17.2B | 90M |
| EBITDA | 3.7B | -94M |
| EBIT | 3.7B | -137M |
| Interest Expense | 131M | 9.3M |
| Net Income | 4.3B | -133M |
| EPS | 2.67 | -0.76 |
| Fiscal Year | 2025 | 2024 |
Income Statement Analysis: The Bottom-Line Duel
This income statement comparison uncovers which company operates with greater efficiency and delivers superior profit generation.
Advanced Micro Devices, Inc. Analysis
AMD’s revenue surged from $16.4B in 2021 to $34.6B in 2025, nearly doubling in five years. Net income climbed from $3.16B to $4.34B, reflecting strong profit momentum. Its gross margin holds firm at 49.5%, and net margin improved to 12.5%, signaling excellent cost control and operational leverage in 2025.
indie Semiconductor, Inc. Analysis
INDI’s revenue increased impressively from $22.6M in 2020 to $217M in 2024, a more than 8-fold rise. However, it remains unprofitable with a net loss of $133M in 2024 and a negative net margin of -61.2%. Despite a favorable gross margin of 41.7%, persistent operating losses and negative EBIT margin (-63.2%) highlight ongoing inefficiencies.
Margin Strength vs. Growth Struggles
AMD clearly dominates with solid profitability, expanding margins, and robust net income growth. INDI shows rapid revenue expansion but struggles to convert sales into profits, reflecting typical early-stage investment risks. For investors, AMD’s mature income profile delivers dependable earnings, while INDI’s losses suggest a high-risk growth venture.
Financial Ratios Comparison
These vital ratios act as a diagnostic tool to expose the underlying fiscal health, valuation premiums, and capital efficiency of the companies analyzed:
| Ratios | Advanced Micro Devices, Inc. (AMD) | indie Semiconductor, Inc. (INDI) |
|---|---|---|
| ROE | N/A | N/A |
| ROIC | N/A | N/A |
| P/E | 80.5 (2025) | -5.3 (2024) |
| P/B | 3.52 (2024) | 1.70 (2024) |
| Current Ratio | 2.62 (2024) | 4.82 (2024) |
| Quick Ratio | 1.83 (2024) | 4.23 (2024) |
| D/E (Debt-to-Equity) | 0.038 (2024) | 0.95 (2024) |
| Debt-to-Assets | 3.2% (2024) | 42.3% (2024) |
| Interest Coverage | 20.7 (2024) | -18.4 (2024) |
| Asset Turnover | 0.37 (2024) | 0.23 (2024) |
| Fixed Asset Turnover | 10.63 (2024) | 4.30 (2024) |
| Payout ratio | 0% (2024) | 0% (2024) |
| Dividend yield | 0% (2024) | 0% (2024) |
| Fiscal Year | 2025 | 2024 |
Efficiency & Valuation Duel: The Vital Signs
Financial ratios act as a company’s DNA, unveiling hidden operational strengths and risks that surface beyond headline figures.
Advanced Micro Devices, Inc.
AMD posts a net margin of 12.5%, signaling solid profitability despite zero reported ROE and ROIC. The stock trades at a stretched P/E of 80.5, reflecting high growth expectations. AMD lacks dividends, choosing instead to reinvest aggressively, dedicating 25% of revenue to R&D, fueling innovation and future expansion.
indie Semiconductor, Inc.
Indie Semiconductor endures heavy losses with a -61.2% net margin and deeply negative ROE and ROIC, marking operational struggles. Its P/E is negative but viewed as favorable due to losses. Indie carries a strong current ratio of 4.8, prioritizing liquidity while investing over 80% of revenue in R&D, aiming for a turnaround without paying dividends.
Growth Reinvestment vs. Profitability Premium
AMD commands a premium valuation driven by operational efficiency and reinvestment in R&D, despite weak ROE and ROIC. Indie Semiconductor faces significant profitability challenges but maintains liquidity and growth focus. AMD suits investors seeking established growth; Indie fits those seeking speculative recovery potential.
Which one offers the Superior Shareholder Reward?
I see that neither Advanced Micro Devices, Inc. (AMD) nor indie Semiconductor, Inc. (INDI) pays dividends. AMD focuses on reinvestment and share buybacks, supporting long-term value. Its free cash flow per share stands at $3.4, enabling robust buybacks and capital expenditure coverage above 6x. INDI suffers losses, negative margins, and negative free cash flow (-$0.42 per share), with no buyback activity and increasing debt levels. AMD’s capital allocation prioritizes sustainable growth and shareholder returns, while INDI remains in a cash-burning phase. I conclude AMD offers a far superior total return profile in 2026 due to sustainable free cash flow and disciplined buybacks.
Comparative Score Analysis: The Strategic Profile
The radar chart reveals the fundamental DNA and trade-offs of Advanced Micro Devices, Inc. and indie Semiconductor, Inc., highlighting their financial strengths and weaknesses:
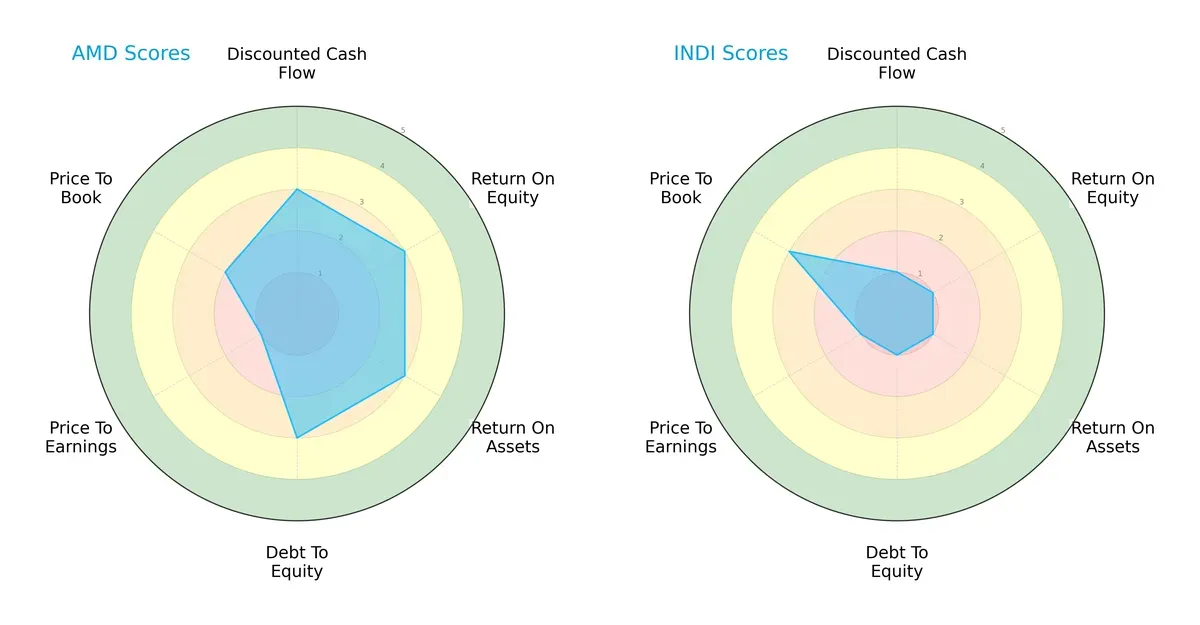
AMD displays a more balanced profile, scoring moderately across DCF, ROE, ROA, and Debt/Equity metrics. INDI lags with very unfavorable marks in most categories, except for a moderate Price-to-Book score. AMD leverages operational efficiency, while INDI relies heavily on valuation metrics, signaling uneven fundamentals.
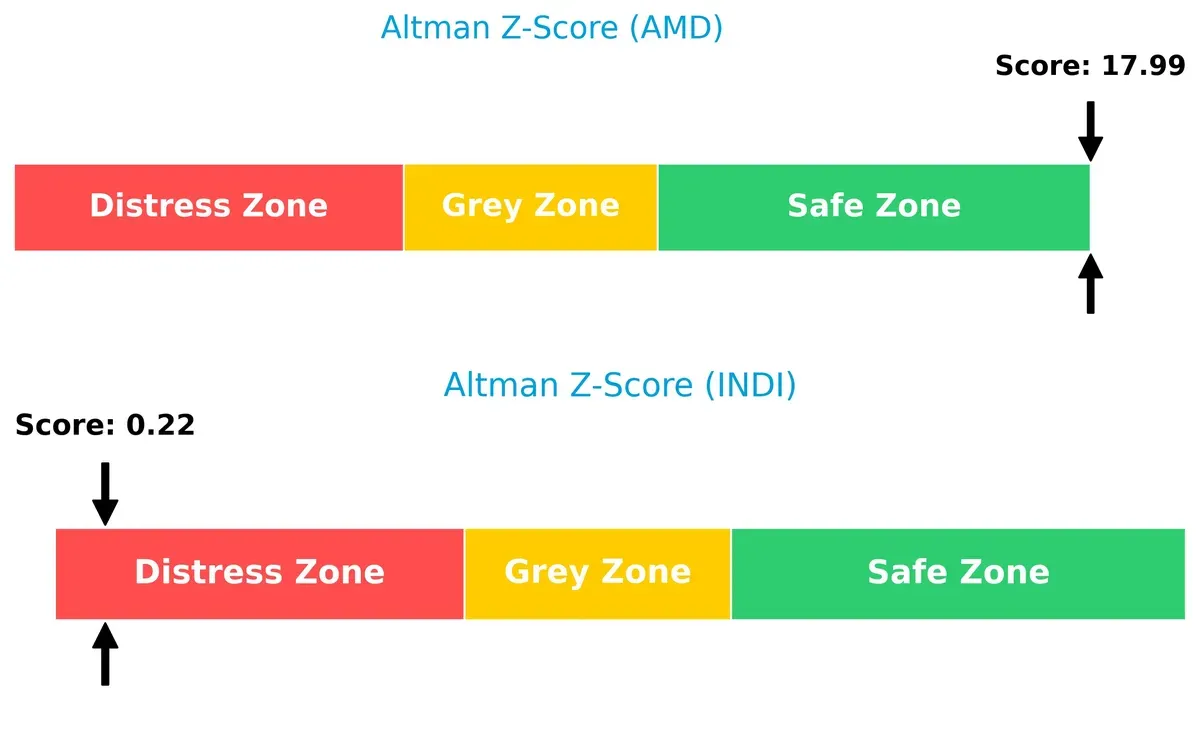
Bankruptcy Risk: Solvency Showdown
The Altman Z-Score gap signals divergent survival prospects: AMD’s 18 firmly places it in the safe zone, whereas INDI’s 0.22 signals distress risk in this cycle:
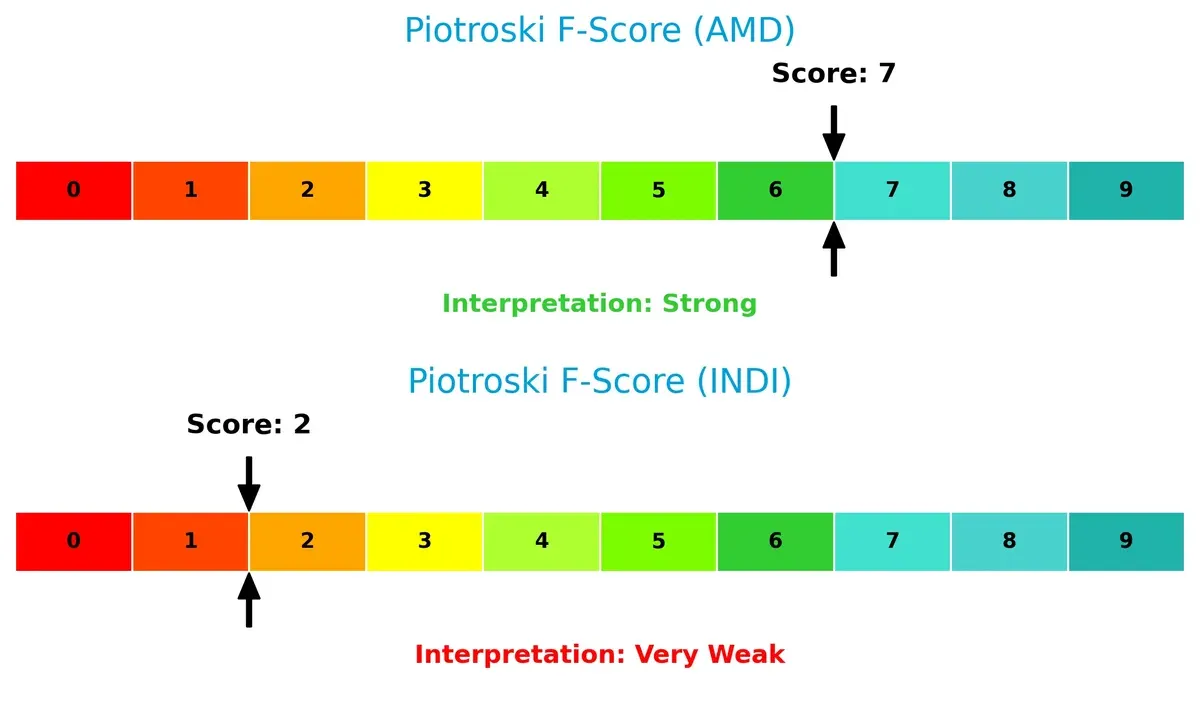
Financial Health: Quality of Operations
AMD’s Piotroski F-Score of 7 indicates strong financial health, contrasting sharply with INDI’s weak score of 2, which flags internal operational risks and poor financial quality:
How are the two companies positioned?
This section dissects the operational DNA of AMD and INDI by comparing their revenue distribution and internal dynamics—strengths and weaknesses. The final goal is to confront their economic moats to identify which model delivers the most resilient, sustainable competitive advantage today.
Revenue Segmentation: The Strategic Mix
This visual comparison dissects how Advanced Micro Devices and indie Semiconductor diversify their income streams and where their primary sector bets lie:
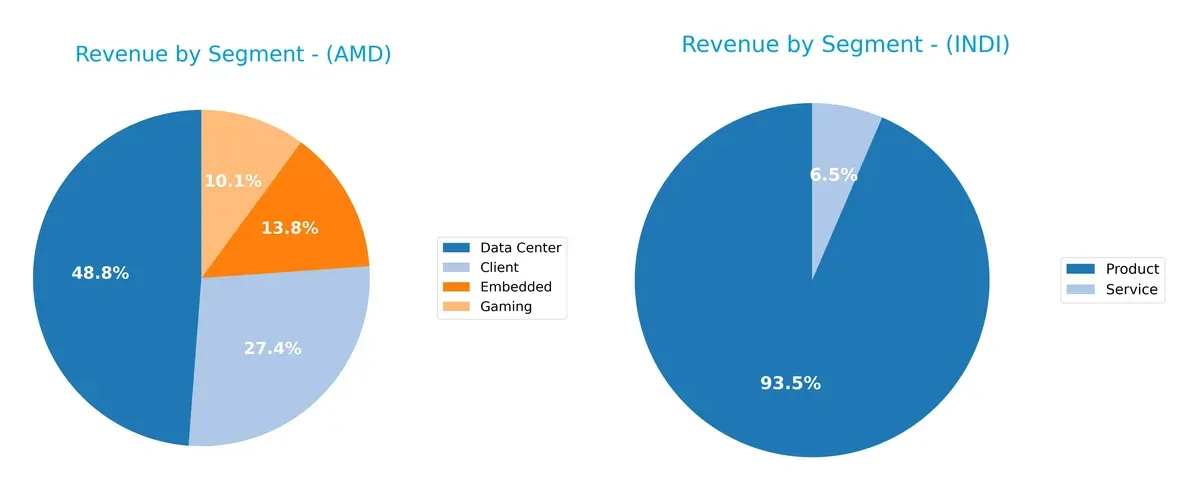
AMD’s 2024 revenue shows strong diversification, with Data Center at $12.6B anchoring, but Client ($7.1B), Embedded ($3.6B), and Gaming ($2.6B) also contributing significantly. Indie Semiconductor leans heavily on Product revenue at $203M, with Service trailing at $14M. AMD’s broad portfolio reduces concentration risk and supports ecosystem lock-in. Indie Semiconductor’s reliance on Product revenue signals vulnerability to market shifts but may reflect focused infrastructure dominance in its niche.
Strengths and Weaknesses Comparison
This table compares the strengths and weaknesses of AMD and indie Semiconductor based on diversification, profitability, financial health, innovation, global presence, and market share:
AMD Strengths
- Diverse revenue streams across Client, Data Center, Embedded, and Gaming segments
- Strong net margin at 12.51%
- Favorable debt-to-equity and interest coverage ratios
- Extensive global presence with significant sales in US, China, Singapore, and Taiwan
indie Semiconductor Strengths
- Favorable P/E ratio despite losses
- Strong quick ratio at 4.23 suggesting liquidity
- High fixed asset turnover at 4.3 indicates efficient asset use
- Revenue diversification between Product and Service lines
- Growing US and China market presence
AMD Weaknesses
- Unfavorable ROE and ROIC at 0% raise questions about capital efficiency
- High P/E at 80.54 implies expensive valuation
- Weak current and quick ratios suggest liquidity concerns
- Low asset turnover ratios indicate potential operational inefficiencies
indie Semiconductor Weaknesses
- Negative profitability metrics including net margin (-61.2%) and ROE (-31.73%)
- Negative interest coverage indicates financial strain
- Elevated debt-to-assets ratio at 42.34%
- Unfavorable current ratio despite strong quick ratio
- Lower overall favorable ratios (21.43%) than AMD
Both companies exhibit challenges with profitability and financial efficiency, though AMD shows stronger margins and leverage metrics. indie Semiconductor’s liquidity strength contrasts with its significant losses and financial risk. These profiles suggest differing strategic priorities in managing growth and financial health.
The Moat Duel: Analyzing Competitive Defensibility
A structural moat is the only defense that protects long-term profits from relentless competition’s erosion:
Advanced Micro Devices, Inc. (AMD): Innovation-Driven Scale Advantage
AMD’s moat stems from its strong product innovation and scale in CPUs and GPUs, reflected in robust revenue growth and stable gross margins near 50%. However, its declining ROIC signals weakening capital efficiency, raising concerns about sustaining its competitive edge into 2026 amid intensifying market pressure.
indie Semiconductor, Inc. (INDI): Niche Automotive Tech Specialist
INDI relies on specialized automotive semiconductor solutions, differentiating it from AMD’s broad portfolio. Despite impressive revenue growth over the long term, its persistent negative EBIT margin and declining ROIC reveal operational struggles. Opportunities lie in expanding ADAS and electrification markets, but profitability remains a challenge.
Innovation Scale vs. Niche Specialization: The Moat Face-Off
Both firms show very unfavorable ROIC trends, indicating value destruction. AMD’s broader scale and market reach offer a wider moat, but its efficiency is eroding. INDI’s niche focus limits scale but could deepen specialization. Overall, AMD is better positioned to defend its market share amid fierce competition.
Which stock offers better returns?
Over the past 12 months, Advanced Micro Devices, Inc. (AMD) showed strong price gains with accelerating momentum. Indie Semiconductor, Inc. (INDI) experienced a steep decline but recently recorded a modest rebound.
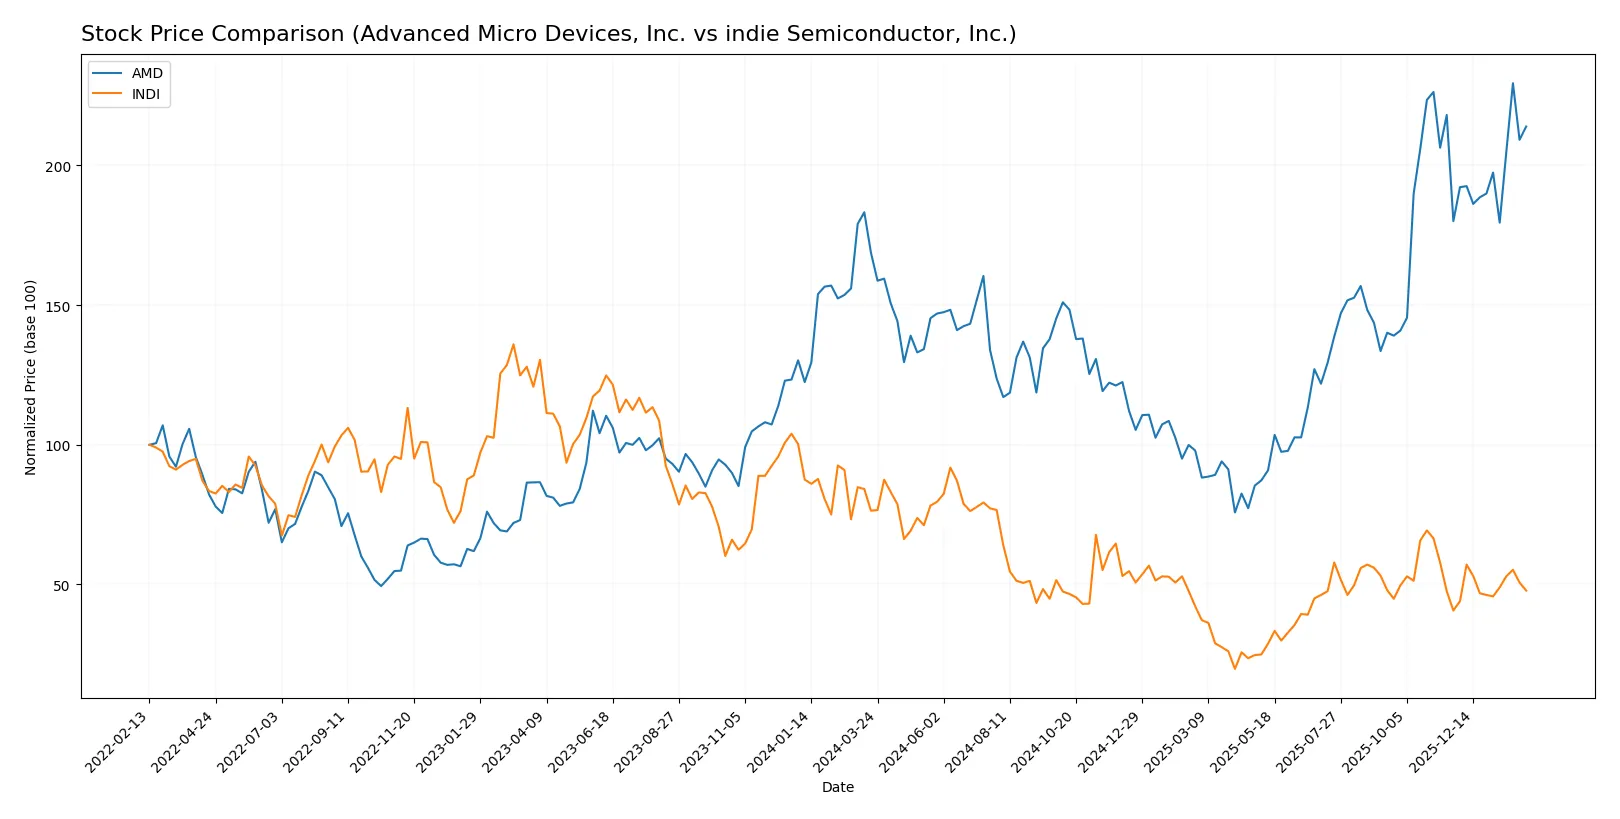
Trend Comparison
AMD’s stock rose 26.72% over the past year, marking a bullish trend with accelerating gains. It reached a high of 259.68 and a low of 85.76, exhibiting significant volatility (std dev 41.61).
INDI’s stock fell 37.38% over the same period, signaling a bearish trend despite recent positive momentum. The price ranged between 1.6 and 7.43, with low volatility (std dev 1.3).
AMD outperformed INDI by delivering sustained growth and stronger market performance over the last year.
Target Prices
The consensus target prices indicate strong upside potential for both Advanced Micro Devices, Inc. and indie Semiconductor, Inc.
| Company | Target Low | Target High | Consensus |
|---|---|---|---|
| Advanced Micro Devices, Inc. | 225 | 380 | 291.56 |
| indie Semiconductor, Inc. | 8 | 8 | 8 |
Analysts expect AMD’s shares to appreciate by roughly 20% from the current 242.11 price. indie Semiconductor’s target price of 8 implies more than 100% upside from 3.87.

Don’t Let Luck Decide Your Entry Point
Optimize your entry points with our advanced ProRealTime indicators. You’ll get efficient buy signals with precise price targets for maximum performance. Start outperforming now!
How do institutions grade them?
Here are the latest institutional grades for Advanced Micro Devices, Inc. and indie Semiconductor, Inc.:
Advanced Micro Devices, Inc. Grades
The table below lists recent grades for AMD from recognized grading firms.
| Grading Company | Action | New Grade | Date |
|---|---|---|---|
| Wells Fargo | Maintain | Overweight | 2026-01-30 |
| Piper Sandler | Maintain | Overweight | 2026-01-26 |
| UBS | Maintain | Buy | 2026-01-26 |
| Bernstein | Maintain | Market Perform | 2026-01-21 |
| Keybanc | Upgrade | Overweight | 2026-01-13 |
| Truist Securities | Maintain | Buy | 2025-12-19 |
| Cantor Fitzgerald | Maintain | Overweight | 2025-12-16 |
| Morgan Stanley | Maintain | Equal Weight | 2025-11-12 |
| Wedbush | Maintain | Outperform | 2025-11-12 |
| Rosenblatt | Maintain | Buy | 2025-11-12 |
indie Semiconductor, Inc. Grades
Below is a summary of recent grades for indie Semiconductor from established grading companies.
| Grading Company | Action | New Grade | Date |
|---|---|---|---|
| UBS | Maintain | Neutral | 2025-11-10 |
| Benchmark | Maintain | Buy | 2025-06-25 |
| Benchmark | Maintain | Buy | 2025-06-11 |
| Benchmark | Maintain | Buy | 2025-05-21 |
| Benchmark | Maintain | Buy | 2025-05-13 |
| Craig-Hallum | Maintain | Buy | 2025-05-13 |
| Keybanc | Maintain | Overweight | 2025-05-13 |
| Benchmark | Maintain | Buy | 2025-04-09 |
| Benchmark | Maintain | Buy | 2025-02-21 |
| Keybanc | Maintain | Overweight | 2025-02-21 |
Which company has the best grades?
AMD enjoys a broader range of recent ratings with multiple “Buy” and “Overweight” designations from top firms. indie Semiconductor holds mostly “Buy” and “Overweight” grades but also a recent “Neutral” from UBS. AMD’s stronger consensus may signal greater institutional confidence, potentially impacting investor sentiment positively.
Risks specific to each company
The following categories identify the critical pressure points and systemic threats facing both firms in the 2026 market environment:
1. Market & Competition
Advanced Micro Devices, Inc.
- Competes in a mature, fiercely competitive semiconductor market with strong incumbents and high R&D demands.
indie Semiconductor, Inc.
- Faces intense competition in automotive semiconductors from established suppliers and emerging tech startups.
2. Capital Structure & Debt
Advanced Micro Devices, Inc.
- Maintains favorable debt metrics and strong interest coverage, reflecting prudent leverage management.
indie Semiconductor, Inc.
- Exhibits higher debt-to-equity ratio near 1.0 and negative interest coverage, signaling financial vulnerability.
3. Stock Volatility
Advanced Micro Devices, Inc.
- Beta near 1.95 indicates above-market volatility, typical for tech growth stocks.
indie Semiconductor, Inc.
- Beta of 2.54 reveals very high sensitivity to market swings, increasing investment risk.
4. Regulatory & Legal
Advanced Micro Devices, Inc.
- Operates under strict technology export controls and IP regulation, with steady compliance history.
indie Semiconductor, Inc.
- Faces regulatory scrutiny in automotive safety and software compliance, with potential liability risks.
5. Supply Chain & Operations
Advanced Micro Devices, Inc.
- Benefits from diversified suppliers and robust manufacturing scale, mitigating disruption risks.
indie Semiconductor, Inc.
- Smaller scale and niche focus increase exposure to supply chain bottlenecks and component shortages.
6. ESG & Climate Transition
Advanced Micro Devices, Inc.
- Commits to sustainability with growing energy-efficient product lines and carbon reduction targets.
indie Semiconductor, Inc.
- Early-stage ESG programs with limited disclosure, raising concerns about climate transition risks.
7. Geopolitical Exposure
Advanced Micro Devices, Inc.
- Subject to US-China trade tensions impacting chip exports, but diversified global footprint offers some cushion.
indie Semiconductor, Inc.
- More concentrated US-based operations with limited international diversification amplify geopolitical risks.
Which company shows a better risk-adjusted profile?
Advanced Micro Devices faces significant market and valuation pressures but benefits from a strong balance sheet, robust operational scale, and a safe-zone Altman Z-score. indie Semiconductor struggles with severe profitability deficits, financial distress signals, and high debt risks. The single most impactful risk for AMD is its stretched valuation amid competitive pressures. For indie Semiconductor, financial distress and weak profitability dominate. AMD’s recent Altman Z-score of 18 confirms financial resilience, while indie’s score near 0.2 warns of bankruptcy risk, confirming AMD’s superior risk-adjusted profile.
Final Verdict: Which stock to choose?
Advanced Micro Devices, Inc. (AMD) stands out for its robust operational efficiency and strong cash generation despite recent margin pressures. Its strategic investment in R&D fuels competitive product innovation. The main point of vigilance remains its high valuation multiples, which suggest premium pricing. AMD suits investors seeking aggressive growth with a tolerance for valuation risk.
indie Semiconductor, Inc. (INDI) offers a strategic moat rooted in its specialized semiconductor technology and growing R&D capabilities. The company presents a higher risk profile with negative profitability and cash flow. However, it shows potential for turnaround and fits portfolios focused on speculative growth and deep value opportunities with a long-term horizon.
If you prioritize stable cash flow generation and proven growth execution, AMD is the compelling choice due to its operational resilience and market position. However, if you seek high-risk, high-reward scenarios with a focus on emerging innovation, INDI offers superior speculative upside despite financial headwinds. Both demand careful risk management aligned with your investment strategy.
Disclaimer: Investment carries a risk of loss of initial capital. The past performance is not a reliable indicator of future results. Be sure to understand risks before making an investment decision.
Go Further
I encourage you to read the complete analyses of Advanced Micro Devices, Inc. and indie Semiconductor, Inc. to enhance your investment decisions: