Home > Comparison > Technology > AMD vs ALAB
The strategic rivalry between Advanced Micro Devices, Inc. (AMD) and Astera Labs, Inc. shapes the semiconductor industry’s evolution. AMD, a capital-intensive semiconductor giant, operates broad computing and graphics segments. In contrast, Astera Labs, a nimble connectivity solutions innovator, targets cloud and AI infrastructure. This analysis pits AMD’s scale and diversification against Astera’s specialized innovation to identify which trajectory offers superior risk-adjusted returns for diversified portfolios.
Table of contents
Companies Overview
Advanced Micro Devices and Astera Labs anchor innovation in semiconductors with distinct market roles and growth trajectories.
Advanced Micro Devices, Inc.: Semiconductor Powerhouse
Advanced Micro Devices dominates as a global semiconductor leader specializing in microprocessors and graphics processing units. Its core revenue stems from CPUs and GPUs for PCs, servers, and gaming consoles. In 2026, AMD’s strategic focus centers on expanding its data center and professional GPU segments to capitalize on cloud computing and AI demand.
Astera Labs, Inc. Common Stock: Connectivity Innovator
Astera Labs pioneers semiconductor connectivity solutions for cloud and AI infrastructure. It generates revenue by selling advanced data, network, and memory connectivity products built on a software-defined platform. In 2026, Astera Labs emphasizes scaling its Intelligent Connectivity Platform to meet the rising needs of hyperscale data centers and AI workloads.
Strategic Collision: Similarities & Divergences
AMD pursues a broad semiconductor portfolio with integrated processor and graphics solutions, while Astera Labs targets specialized connectivity niches. Their primary battleground lies in supporting cloud and AI infrastructure growth, but AMD focuses on compute power, and Astera Labs on data flow optimization. This divergence shapes their investment profiles: AMD is a large-cap diversified giant, Astera Labs a nimble innovator in a critical subsegment.
Income Statement Comparison
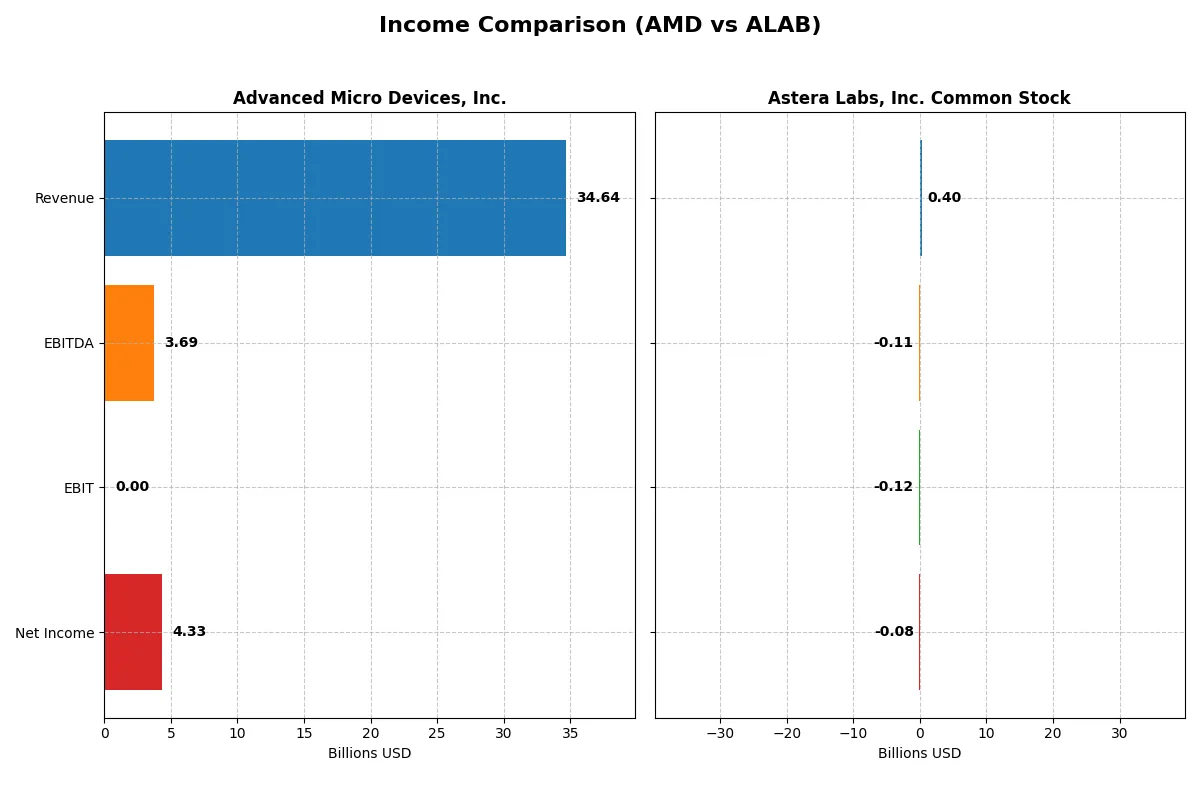
This data dissects the core profitability and scalability of both corporate engines to reveal who dominates the bottom line:
| Metric | Advanced Micro Devices, Inc. (AMD) | Astera Labs, Inc. Common Stock (ALAB) |
|---|---|---|
| Revenue | 34.6B | 396M |
| Cost of Revenue | 17.5B | 94M |
| Operating Expenses | 13.5B | 419M |
| Gross Profit | 17.2B | 303M |
| EBITDA | 3.7B | -113M |
| EBIT | 3.7B | -116M |
| Interest Expense | 131M | 0 |
| Net Income | 4.3B | -83M |
| EPS | 2.67 | -0.64 |
| Fiscal Year | 2025 | 2024 |
Income Statement Analysis: The Bottom-Line Duel
This income statement comparison reveals the true efficiency of Advanced Micro Devices and Astera Labs in converting revenue into profits.
Advanced Micro Devices, Inc. Analysis
AMD’s revenue surged from $16.4B in 2021 to $34.6B in 2025, reflecting strong growth momentum. Net income advanced from $3.16B to $4.34B over this period. The company maintains a favorable gross margin near 50%, but its EBIT margin dropped to zero in 2025. Despite margin pressure, net margin remains healthy at 12.5%, signaling efficient cost control and improved bottom-line performance.
Astera Labs, Inc. Common Stock Analysis
Astera Labs grew revenue sharply from $80M in 2022 to $396M in 2024, showing impressive top-line expansion. However, it consistently posts negative net income, with a loss widening to $83M in 2024. Gross margin stands high at 76%, but EBIT and net margins remain deeply negative (-29% and -21%). Rising operating expenses outpace revenue gains, undermining profitability and operational efficiency.
Growth and Profitability: Scale vs. Sustainability
AMD delivers robust revenue and net income growth with sustainable margins, despite a recent EBIT margin setback. Astera Labs impresses with rapid revenue growth but suffers persistent losses and margin erosion. AMD’s profile appeals to investors seeking steady profits and scale, while Astera Labs remains a high-risk, early-stage growth story requiring careful risk management.
Financial Ratios Comparison
These vital ratios act as a diagnostic tool to expose the underlying fiscal health, valuation premiums, and capital efficiency of the companies compared:
| Ratios | Advanced Micro Devices, Inc. (AMD) | Astera Labs, Inc. Common Stock (ALAB) |
|---|---|---|
| ROE | 2.85% (2024) | -8.65% (2024) |
| ROIC | 2.49% (2024) | -11.97% (2024) |
| P/E | 124 (2024) | -208 (2024) |
| P/B | 3.52 (2024) | 18.02 (2024) |
| Current Ratio | 2.62 (2024) | 11.71 (2024) |
| Quick Ratio | 1.83 (2024) | 11.21 (2024) |
| D/E | 0.038 (2024) | 0.0013 (2024) |
| Debt-to-Assets | 3.20% (2024) | 0.12% (2024) |
| Interest Coverage | 20.65 (2024) | 0 (2024) |
| Asset Turnover | 0.37 (2024) | 0.38 (2024) |
| Fixed Asset Turnover | 10.63 (2024) | 11.12 (2024) |
| Payout ratio | 0% (2024) | 0% (2024) |
| Dividend yield | 0% (2024) | 0% (2024) |
| Fiscal Year | 2024 | 2024 |
Efficiency & Valuation Duel: The Vital Signs
Financial ratios serve as a company’s DNA, uncovering hidden risks and unveiling operational strengths essential for investment insight.
Advanced Micro Devices, Inc.
AMD shows mixed signals with a favorable net margin of 12.51% but an unfavorable ROE and ROIC at 0%. Its P/E ratio at 80.54 signals an expensive valuation. AMD does not pay dividends, instead reinvesting heavily in R&D (25% of revenue), aiming for long-term growth and innovation leadership.
Astera Labs, Inc. Common Stock
ALAB struggles with a negative net margin of -21.05% and negative returns on equity and invested capital (-8.65% and -11.97%). Despite a negative P/E of -208.41, its valuation appears stretched with a high price-to-book of 18.02. ALAB reinvests aggressively in R&D, spending over 50% of revenue, reflecting a growth-focused strategy without dividends.
Valuation Stretch vs. Growth Struggles
Both companies face valuation challenges and negative or weak returns, reflecting operational or market uncertainty. AMD offers a stronger profitability base and reinvests in innovation, while ALAB’s losses and high multiples raise caution. Investors preferring established operational footing may lean toward AMD; those seeking high-risk growth might consider ALAB’s profile.
Which one offers the Superior Shareholder Reward?
I observe that AMD and Astera Labs (ALAB) both abstain from paying dividends, focusing instead on reinvestment and buybacks. AMD boasts a robust share buyback program, fueled by strong free cash flow of 3.4B in 2025, with zero dividend payout ratio. ALAB, however, struggles with consistent losses and negative margins, limiting buyback capacity. AMD’s capital allocation prioritizes sustainable buybacks, supported by a 0% dividend yield and solid operating cash flow coverage. ALAB’s model is riskier, relying heavily on growth investment amid poor profitability and negligible buybacks. I conclude AMD offers a superior total return profile in 2026, balancing growth with prudent capital return.
Comparative Score Analysis: The Strategic Profile
The radar chart reveals the fundamental DNA and trade-offs of Advanced Micro Devices, Inc. and Astera Labs, Inc. Common Stock, highlighting their core financial strengths and vulnerabilities:
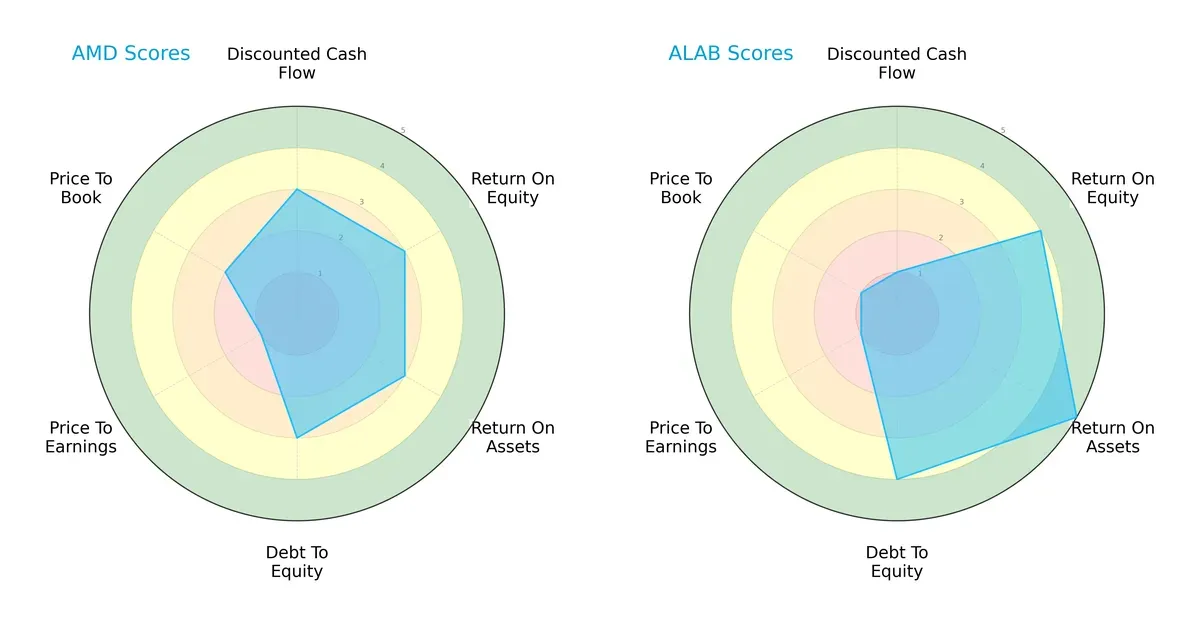
Advanced Micro Devices, Inc. demonstrates a balanced profile with moderate scores across DCF, ROE, ROA, and debt-to-equity metrics. In contrast, Astera Labs leans heavily on superior asset efficiency and lower leverage but suffers from a very unfavorable valuation profile. AMD’s diversified strengths suggest steady operational execution, while ALAB relies on specific operational efficiencies despite valuation concerns.
Bankruptcy Risk: Solvency Showdown
The Altman Z-Score gap sharply favors Astera Labs, indicating a significantly stronger buffer against bankruptcy risk in this cycle:
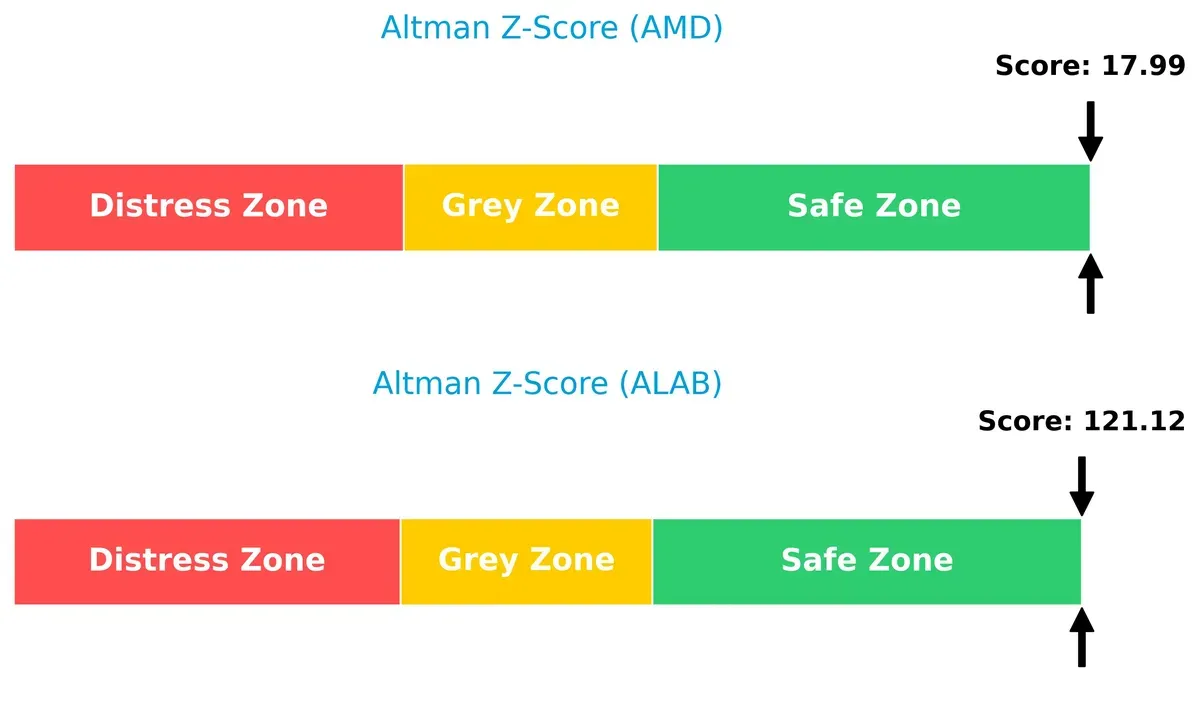
Astera Labs posts an exceptionally high Z-Score (121.1), far above the safe threshold, implying robust solvency. AMD also sits comfortably in the safe zone (18.0), but its margin of safety is comparatively slimmer, flagging a need for vigilance in financial leverage management.
Financial Health: Quality of Operations
Advanced Micro Devices edges out Astera Labs in financial health, showing stronger operational quality but both firms remain relatively solid:
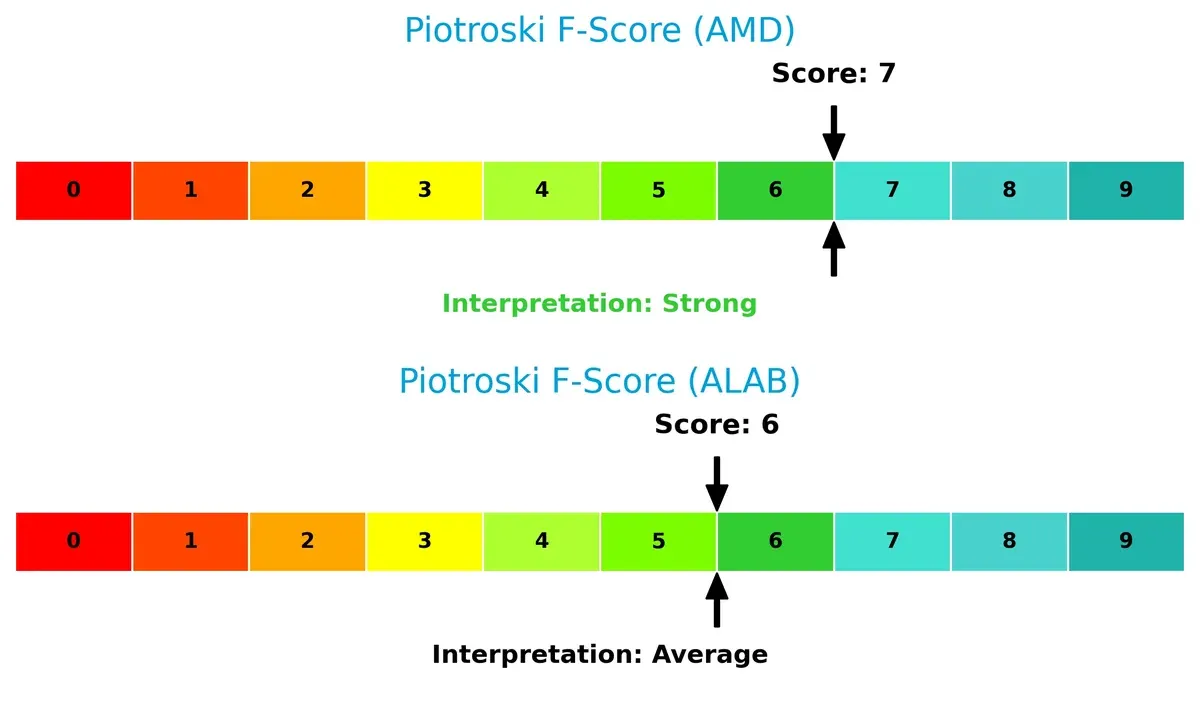
AMD’s Piotroski F-Score of 7 signals strong financial health with few red flags. Astera Labs’ score of 6 is slightly lower, suggesting some internal metrics could be improved for resilience. Neither company shows critical distress, but AMD’s operational consistency offers a slight advantage.
How are the two companies positioned?
This section dissects the operational DNA of AMD and ALAB by comparing their revenue distribution by segment alongside their internal strengths and weaknesses. The goal is to confront their economic moats and identify which model delivers the most resilient, sustainable competitive advantage today.
Revenue Segmentation: The Strategic Mix
This comparison dissects how Advanced Micro Devices, Inc. and Astera Labs, Inc. diversify their income streams and where their primary sector bets lie:
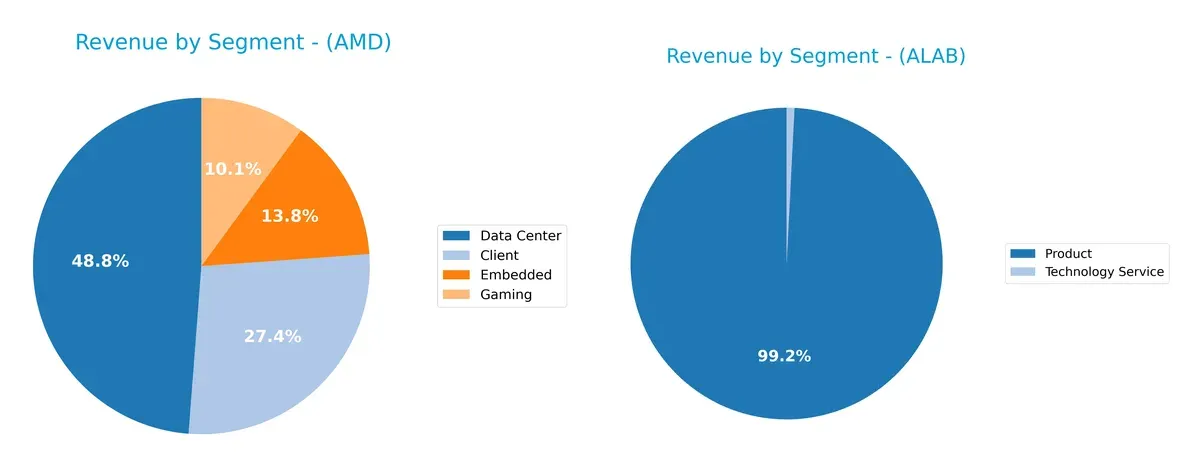
AMD’s revenue is well diversified across Data Center ($12.6B), Client ($7.1B), Embedded ($3.6B), and Gaming ($2.6B). In contrast, Astera Labs relies heavily on its Product segment ($393M), with minimal Technology Service revenue ($3.2M). AMD’s mix anchors its ecosystem lock-in and infrastructure dominance, while Astera Labs faces concentration risk tied to a narrow product focus.
Strengths and Weaknesses Comparison
This table compares the Strengths and Weaknesses of AMD and ALAB:
AMD Strengths
- Diverse product segments including Client, Data Center, Embedded, Gaming
- Strong global presence with significant sales in US, China, Taiwan
- Favorable net margin of 12.51%
- Low debt-to-assets ratio supports financial stability
ALAB Strengths
- Favorable quick ratio of 11.21 indicates strong short-term liquidity
- Favorable fixed asset turnover at 11.12 shows efficient use of assets
- Low debt-to-assets ratio of 12%
- Product and technology service revenue diversity, though limited
AMD Weaknesses
- Unfavorable ROE and ROIC at 0% suggest weak capital efficiency
- High P/E ratio of 80.54 may imply overvaluation risk
- Unfavorable liquidity ratios (current and quick) raise short-term risk
- Negative interest coverage indicates potential financial stress
ALAB Weaknesses
- Negative net margin (-21.05%), ROE (-8.65%), and ROIC (-11.97%) signal poor profitability
- Unfavorable WACC at 10.96% raises cost of capital concerns
- High P/B ratio of 18.02 may indicate overvaluation
- Unfavorable current ratio despite liquidity strength
AMD exhibits greater product and geographic diversification with solid profitability but struggles with capital efficiency and liquidity. ALAB shows strong liquidity and asset efficiency but faces significant profitability and valuation challenges. These contrasts highlight differing strategic and financial profiles within the same sector.
The Moat Duel: Analyzing Competitive Defensibility
A structural moat protects long-term profits from relentless competition and market pressures. Let’s dissect how these two semiconductor players defend their turf:
Advanced Micro Devices, Inc.: Innovation-Driven Market Penetration
AMD’s primary moat stems from its cutting-edge chip architecture and strong brand presence. This advantage translates into stable gross margins near 50% and robust revenue growth of 110% over five years. However, its declining ROIC trend signals caution as competitive pressures intensify in 2026.
Astera Labs, Inc. Common Stock: Emerging Connectivity Innovator
Astera Labs rides on a niche moat built by specialized connectivity solutions for AI infrastructure. Unlike AMD’s broad market grasp, ALAB’s moat is narrower but shows a promising upward ROIC trend despite current value destruction. Its rapid revenue growth of 396% highlights future expansion potential in cloud computing.
Innovation Scale vs. Niche Growth: Which Moat Holds Stronger?
AMD commands a wider moat through innovation and scale, but its declining ROIC trend warns of intensifying competition. Astera Labs’ moat is narrower yet deepening, showing improving efficiency and growth. AMD remains better positioned to defend market share today.
Which stock offers better returns?
Over the past year, both Advanced Micro Devices, Inc. and Astera Labs, Inc. demonstrated significant price appreciation, with distinct momentum shifts and trading volume trends shaping their trajectories.
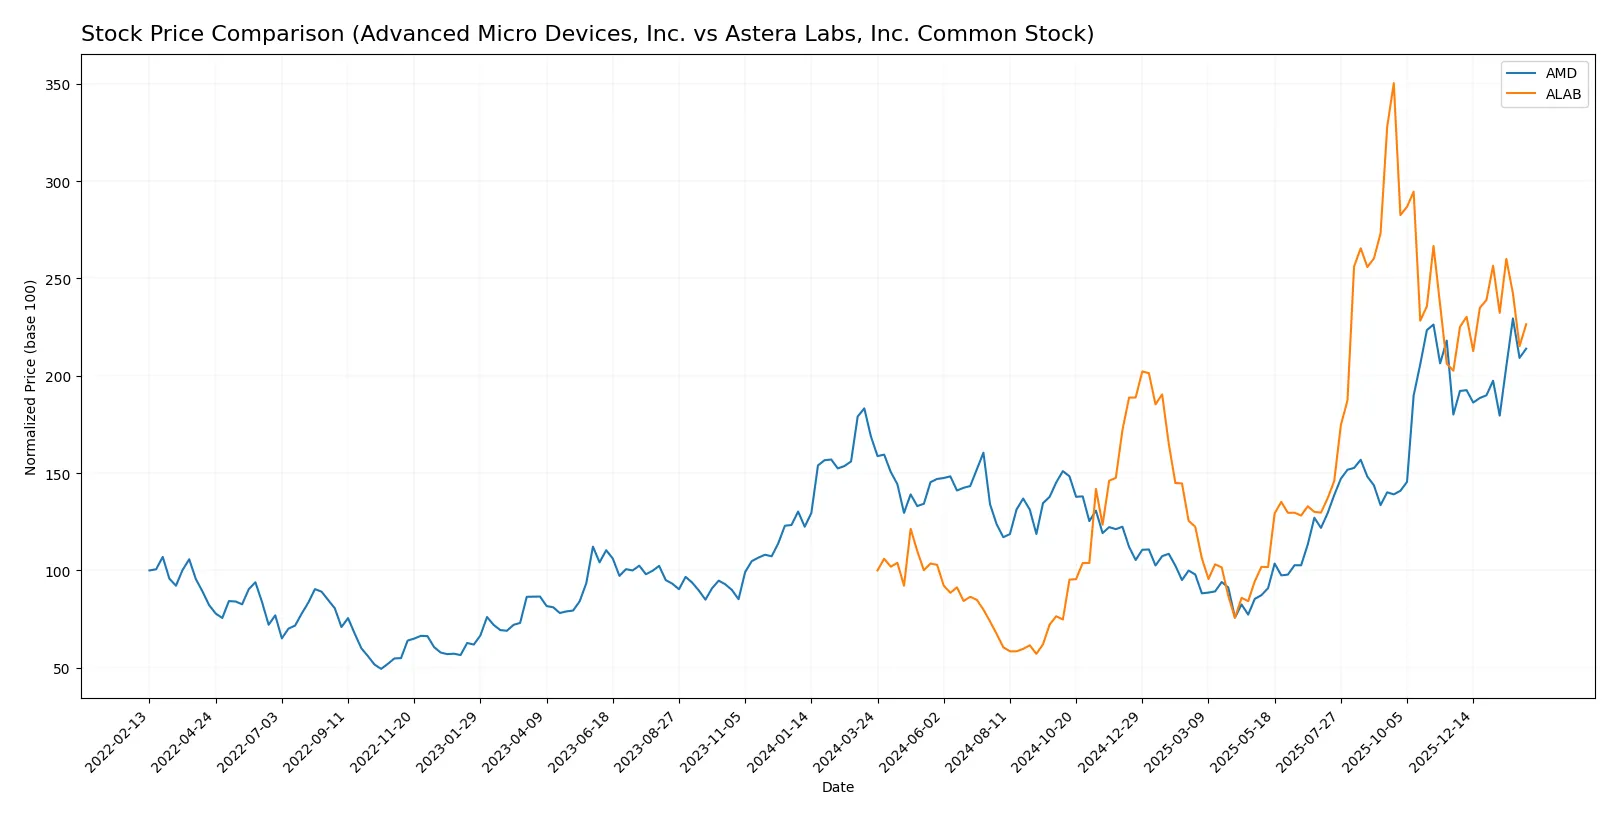
Trend Comparison
Advanced Micro Devices, Inc. posted a 26.72% price increase over 12 months, indicating a bullish trend with accelerating momentum and a high volatility of 41.61. The stock ranged between 85.76 and 259.68.
Astera Labs, Inc. surged 126.46% over the same period, also bullish but showing deceleration in momentum. Volatility was higher at 50.42, with prices between 40.0 and 245.2.
Astera Labs outperformed Advanced Micro Devices in total price appreciation, despite a slowdown in acceleration, delivering the highest market performance in this comparison.
Target Prices
Analysts present a bullish consensus for Advanced Micro Devices, Inc. and Astera Labs, Inc. Common Stock, indicating significant upside potential.
| Company | Target Low | Target High | Consensus |
|---|---|---|---|
| Advanced Micro Devices, Inc. | 225 | 380 | 291.56 |
| Astera Labs, Inc. Common Stock | 165 | 225 | 202.14 |
The consensus targets exceed current prices for both stocks, signaling analyst confidence in growth beyond AMD’s $242 and ALAB’s $158 levels.

Don’t Let Luck Decide Your Entry Point
Optimize your entry points with our advanced ProRealTime indicators. You’ll get efficient buy signals with precise price targets for maximum performance. Start outperforming now!
How do institutions grade them?
Advanced Micro Devices, Inc. Grades
The following table summarizes recent grades from reputable financial institutions for AMD:
| Grading Company | Action | New Grade | Date |
|---|---|---|---|
| Wells Fargo | Maintain | Overweight | 2026-01-30 |
| UBS | Maintain | Buy | 2026-01-26 |
| Piper Sandler | Maintain | Overweight | 2026-01-26 |
| Bernstein | Maintain | Market Perform | 2026-01-21 |
| Keybanc | Upgrade | Overweight | 2026-01-13 |
| Truist Securities | Maintain | Buy | 2025-12-19 |
| Cantor Fitzgerald | Maintain | Overweight | 2025-12-16 |
| Wells Fargo | Maintain | Overweight | 2025-11-12 |
| B of A Securities | Maintain | Buy | 2025-11-12 |
| Rosenblatt | Maintain | Buy | 2025-11-12 |
Astera Labs, Inc. Common Stock Grades
Below are the latest grades from recognized grading firms for Astera Labs:
| Grading Company | Action | New Grade | Date |
|---|---|---|---|
| Northland Capital Markets | Maintain | Outperform | 2025-12-09 |
| Northland Capital Markets | Upgrade | Outperform | 2025-11-17 |
| Needham | Maintain | Buy | 2025-11-05 |
| JP Morgan | Maintain | Overweight | 2025-11-05 |
| TD Cowen | Maintain | Hold | 2025-11-05 |
| Morgan Stanley | Maintain | Overweight | 2025-11-05 |
| Roth Capital | Maintain | Buy | 2025-11-05 |
| Stifel | Maintain | Buy | 2025-11-05 |
| Barclays | Downgrade | Equal Weight | 2025-10-20 |
| Stifel | Maintain | Buy | 2025-10-17 |
Which company has the best grades?
AMD consistently receives strong grades, mainly “Buy” and “Overweight,” reflecting broad institutional confidence. Astera Labs shows a mix of “Buy,” “Overweight,” and “Outperform” ratings but includes a recent downgrade to “Equal Weight.” Investors may perceive AMD’s more stable and higher consensus grades as a sign of stronger market endorsement.
Risks specific to each company
The following categories identify the critical pressure points and systemic threats facing both firms in the 2026 market environment:
1. Market & Competition
Advanced Micro Devices, Inc.
- Dominates large semiconductor segments with strong brand recognition but faces intense rivalry from Intel and Nvidia.
Astera Labs, Inc. Common Stock
- A newer, smaller player focused on cloud and AI connectivity, competing in a niche but rapidly evolving market.
2. Capital Structure & Debt
Advanced Micro Devices, Inc.
- Maintains a conservative debt profile with favorable debt-to-equity and debt-to-assets ratios, reducing financial risk.
Astera Labs, Inc. Common Stock
- Also shows low debt levels, with a strong quick ratio indicating good liquidity, but high current ratio may reflect inefficient working capital.
3. Stock Volatility
Advanced Micro Devices, Inc.
- Exhibits high beta of 1.95, indicating high sensitivity to market swings and elevated volatility risk.
Astera Labs, Inc. Common Stock
- Beta of 1.51 suggests moderate volatility, less prone to extreme market fluctuations than AMD.
4. Regulatory & Legal
Advanced Micro Devices, Inc.
- Faces regulatory scrutiny typical for large tech firms, including antitrust and export controls.
Astera Labs, Inc. Common Stock
- As a smaller firm, regulatory risks are lower but could increase as it scales and enters new markets.
5. Supply Chain & Operations
Advanced Micro Devices, Inc.
- Relies on complex global supply chains with exposure to semiconductor shortages and geopolitical disruptions.
Astera Labs, Inc. Common Stock
- Operates in a specialized segment with potentially fewer but critical supply chain dependencies.
6. ESG & Climate Transition
Advanced Micro Devices, Inc.
- Larger footprint means greater ESG scrutiny; pressure to reduce environmental impact is rising.
Astera Labs, Inc. Common Stock
- Smaller scale may ease ESG pressures but also limits resources for climate transition initiatives.
7. Geopolitical Exposure
Advanced Micro Devices, Inc.
- Significant exposure to US-China tensions given global manufacturing and sales footprint.
Astera Labs, Inc. Common Stock
- Also exposed to geopolitical risks but more focused on US-based cloud and AI infrastructure markets.
Which company shows a better risk-adjusted profile?
AMD’s dominant market position and conservative capital structure provide a strong base, but high stock volatility and regulatory risks weigh heavily. Astera Labs, while smaller and less diversified, shows better liquidity and lower volatility but suffers from weak profitability and valuation concerns. The greatest risk for AMD lies in market competition and geopolitical tensions. Astera Labs’ biggest risk is its negative profitability and high valuation multiples. Overall, AMD offers a more balanced risk profile, supported by a robust Altman Z-score and Piotroski score, despite its vulnerabilities.
Final Verdict: Which stock to choose?
Advanced Micro Devices (AMD) wields a superpower in its robust revenue growth and strong gross margins, positioning it as a cash-generating powerhouse in semiconductors. Its point of vigilance lies in a stretched valuation and some weakening returns on invested capital. AMD fits well in an aggressive growth portfolio seeking market leadership.
Astera Labs (ALAB) offers a strategic moat through its niche focus on advanced semiconductor interconnect technology, combined with an exceptionally high current ratio signaling strong liquidity. Its safety profile appears riskier than AMD’s due to ongoing profitability challenges, making it more suitable for a GARP (Growth at a Reasonable Price) investor willing to bet on a turnaround.
If you prioritize steady cash flow and market dominance, AMD is the compelling choice due to its proven execution and scale. However, if you seek high-reward opportunities with improving profitability trends, ALAB offers better growth potential despite current losses. Both require careful risk management given their respective valuation and operational profiles.
Disclaimer: Investment carries a risk of loss of initial capital. The past performance is not a reliable indicator of future results. Be sure to understand risks before making an investment decision.
Go Further
I encourage you to read the complete analyses of Advanced Micro Devices, Inc. and Astera Labs, Inc. Common Stock to enhance your investment decisions: