Home > Comparison > Technology > AMD vs ARM
The strategic rivalry between Advanced Micro Devices, Inc. (AMD) and Arm Holdings plc shapes the semiconductor industry’s evolution. AMD operates as a vertically integrated chipmaker with a broad product portfolio spanning CPUs and GPUs. In contrast, Arm excels as a technology licensor, powering diverse applications across global markets. This analysis pits AMD’s capital-intensive manufacturing model against Arm’s licensing-driven growth to identify which offers superior risk-adjusted returns for a diversified portfolio.
Table of contents
Companies Overview
Advanced Micro Devices and Arm Holdings stand as pivotal forces shaping the semiconductor landscape globally.
Advanced Micro Devices, Inc.: Powerhouse in Computing & Graphics
Advanced Micro Devices dominates the semiconductor sector with a diversified portfolio spanning x86 microprocessors, GPUs, and bespoke SoC solutions. Its revenue engine revolves around supplying processors for PCs, servers, and game consoles. In 2026, AMD strategically focuses on expanding its high-performance computing and data center presence, leveraging innovation to challenge incumbents.
Arm Holdings plc American Depositary Shares: Architect of Chip Design
Arm Holdings excels as a leading semiconductor IP licensor, designing CPU architectures and related tech for global chipmakers. It generates revenue by licensing its microprocessor designs and system IP to manufacturers across automotive, IoT, and consumer electronics sectors. The company’s 2026 strategy prioritizes broadening its architectural footprint and software ecosystem to capture emerging markets.
Strategic Collision: Similarities & Divergences
AMD pursues a vertically integrated model combining chip design and manufacturing, while Arm operates an open licensing structure. Their primary clash unfolds in the CPU and GPU technology space, competing to power next-gen devices. Investors face contrasting profiles: AMD’s growth hinges on execution and scale, Arm’s on ecosystem expansion and licensing leverage.
Income Statement Comparison
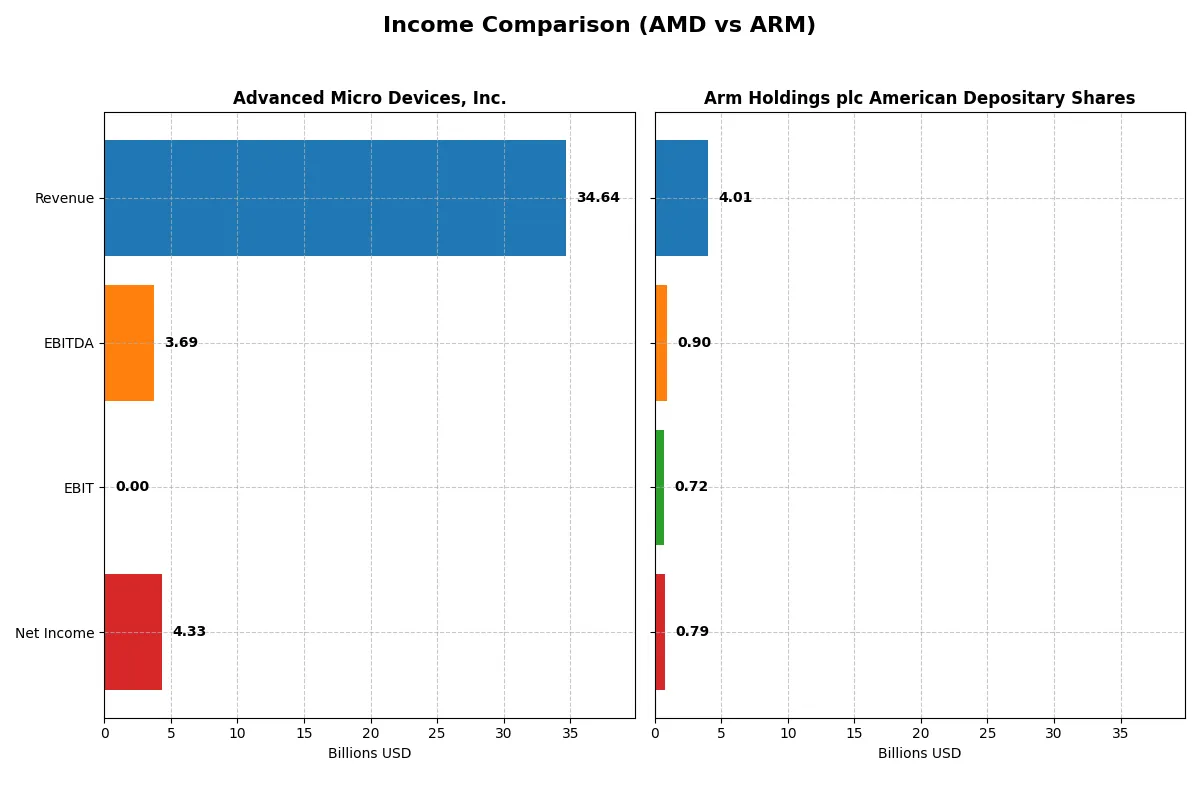
This data dissects the core profitability and scalability of both corporate engines to reveal who dominates the bottom line:
| Metric | Advanced Micro Devices, Inc. (AMD) | Arm Holdings plc American Depositary Shares (ARM) |
|---|---|---|
| Revenue | 34.6B | 4.0B |
| Cost of Revenue | 17.5B | 206M |
| Operating Expenses | 13.5B | 2.97B |
| Gross Profit | 17.2B | 3.8B |
| EBITDA | 3.69B | 903M |
| EBIT | 3.69B | 720M |
| Interest Expense | 131M | 0 |
| Net Income | 4.34B | 792M |
| EPS | 2.67 | 0.75 |
| Fiscal Year | 2025 | 2025 |
Income Statement Analysis: The Bottom-Line Duel
This income statement comparison reveals how efficiently each company transforms revenue into profits and sustains growth momentum.
Advanced Micro Devices, Inc. (AMD) Analysis
AMD’s revenue surged 34% to $34.6B in 2025, driving a 165% jump in EPS to $2.65. Its gross margin remained healthy at 49.5%, while net margin expanded to 12.5%. Despite zero EBIT margin signaling operating challenges, net income grew strongly to $4.34B, reflecting robust bottom-line momentum.
Arm Holdings plc American Depositary Shares (ARM) Analysis
ARM posted $4B revenue in 2025, growing 24% year-over-year. It boasts an exceptional gross margin near 95%, with a solid 19.8% net margin. EBIT margin jumped to 18%, underpinning operational efficiency. Net income rose 109% to $792M, signaling powerful profitability gains alongside steady revenue growth.
Margin Dominance vs. Scale Expansion
ARM excels in margin quality and operational efficiency, with gross and EBIT margins far surpassing AMD’s. AMD, however, leads on scale, generating over 8x ARM’s revenue and net income. For investors, ARM’s high-margin profile suits those valuing profitability strength, while AMD’s larger revenue base appeals to growth-focused portfolios.
Financial Ratios Comparison
These vital ratios act as a diagnostic tool to expose the underlying fiscal health, valuation premiums, and capital efficiency of the companies compared below:
| Ratios | Advanced Micro Devices, Inc. (AMD) | Arm Holdings plc American Depositary Shares (ARM) |
|---|---|---|
| ROE | 2.85% (2024) | 11.58% (2025) |
| ROIC | 2.49% (2024) | 10.28% (2025) |
| P/E | 124 (2024) | 142 (2025) |
| P/B | 3.52 (2024) | 16.40 (2025) |
| Current Ratio | 2.62 (2024) | 5.20 (2025) |
| Quick Ratio | 1.83 (2024) | 5.20 (2025) |
| D/E | 0.038 (2024) | 0.052 (2025) |
| Debt-to-Assets | 3.20% (2024) | 4.00% (2025) |
| Interest Coverage | 20.65 (2024) | N/A (0) |
| Asset Turnover | 0.37 (2024) | 0.45 (2025) |
| Fixed Asset Turnover | 10.63 (2024) | 5.61 (2025) |
| Payout ratio | 0% (2024) | 0% (2025) |
| Dividend yield | 0% (2024) | 0% (2025) |
| Fiscal Year | 2024 | 2025 |
Efficiency & Valuation Duel: The Vital Signs
Ratios act as the company’s DNA, revealing hidden risks and operational excellence that shape investor confidence and market positioning.
Advanced Micro Devices, Inc.
AMD posts a moderate net margin of 12.51% but disappoints with zero return on equity and invested capital, signaling weak profitability. Its P/E ratio of 80.54 suggests a stretched valuation. AMD offers no dividend yield, focusing capital on R&D, allocating about 25% of revenue to innovation, aiming for long-term growth.
Arm Holdings plc American Depositary Shares
Arm shows a stronger net margin at 19.77% and a neutral 11.58% ROE, yet its P/E of 141.58 and P/B of 16.4 reflect a highly expensive stock. The company maintains a robust current ratio of 5.2, indicating strong liquidity. Arm reinvests heavily in R&D, dedicating over 50% of revenue to future-proof its technology without dividend payouts.
Premium Valuation vs. Operational Safety
Arm holds a higher margin and liquidity but trades at a premium valuation, increasing risk. AMD’s valuation stretches less but suffers from weak returns on capital. Investors seeking growth may favor Arm’s reinvestment, while those wary of stretched multiples might consider AMD’s more moderate profile.
Which one offers the Superior Shareholder Reward?
I observe that neither AMD nor Arm Holdings pays dividends in 2026, focusing instead on growth reinvestment. AMD’s free cash flow per share stands at $3.4, significantly higher than Arm’s $0.17, enabling more aggressive buybacks. AMD’s buyback activity is robust, supporting shareholder returns through capital allocation. Arm’s lower free cash flow and modest buyback pace limit near-term shareholder rewards. AMD’s sustainable free cash flow and capital expenditure coverage indicate a stronger capacity for ongoing buybacks. I conclude AMD offers the superior total shareholder return profile in 2026 due to its more intensive and sustainable capital return strategy.
Comparative Score Analysis: The Strategic Profile
The radar chart reveals the fundamental DNA and trade-offs of Advanced Micro Devices, Inc. and Arm Holdings plc American Depositary Shares:
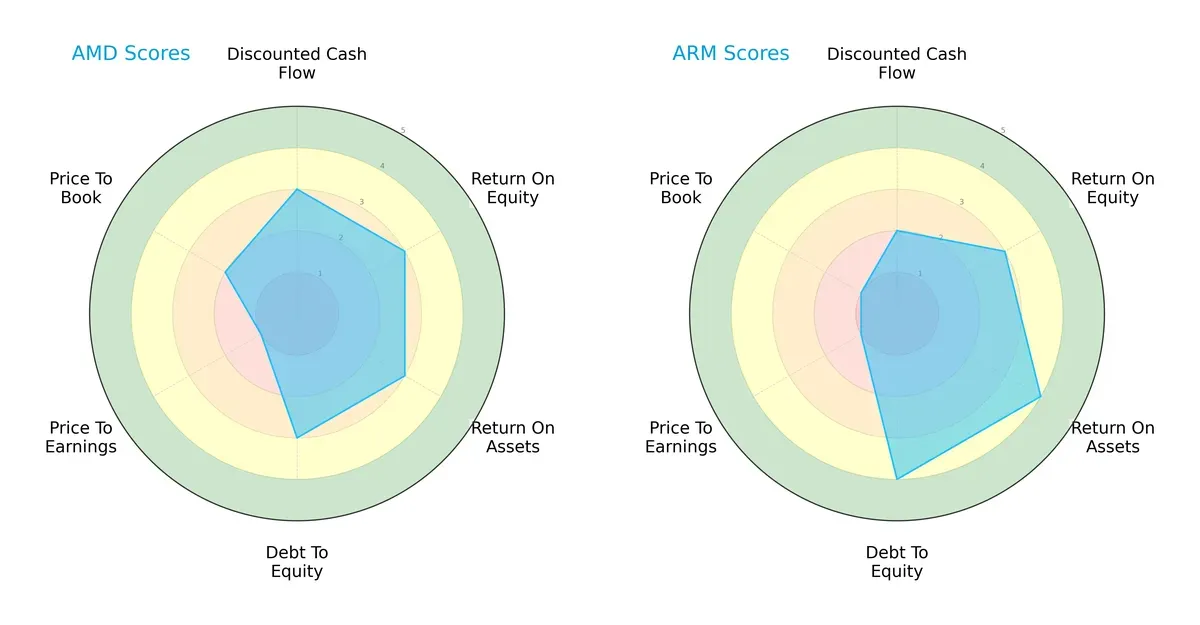
Both firms register a moderate overall score of 3. AMD leans on balanced scores across DCF, ROE, ROA, and debt-to-equity, each at 3, while Arm shows a stronger asset utilization and financial stability with ROA and debt-to-equity scores of 4. However, both struggle on valuation metrics, with AMD scoring slightly better on price-to-book (2 vs. 1). Arm’s profile favors operational efficiency, whereas AMD maintains a steadier, more uniform risk-return balance.
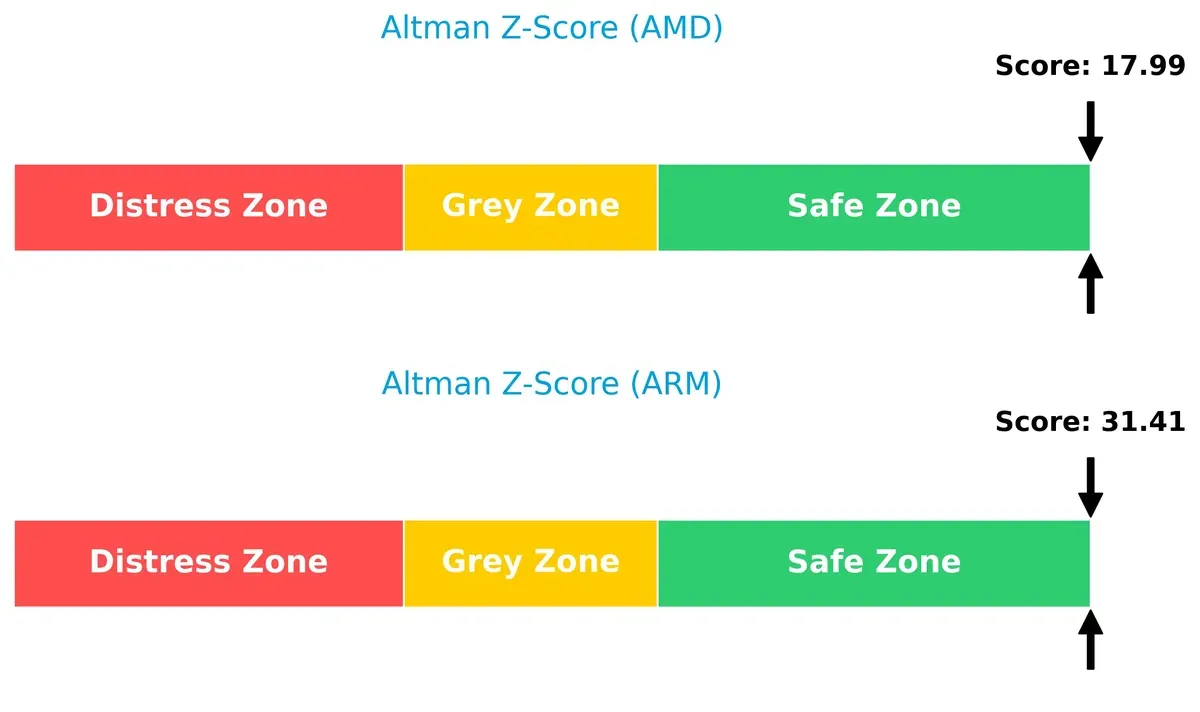
Bankruptcy Risk: Solvency Showdown
Arm Holdings’ Altman Z-Score of 31.4 far surpasses AMD’s 18.0, signaling a stronger buffer against bankruptcy risk in this economic cycle:
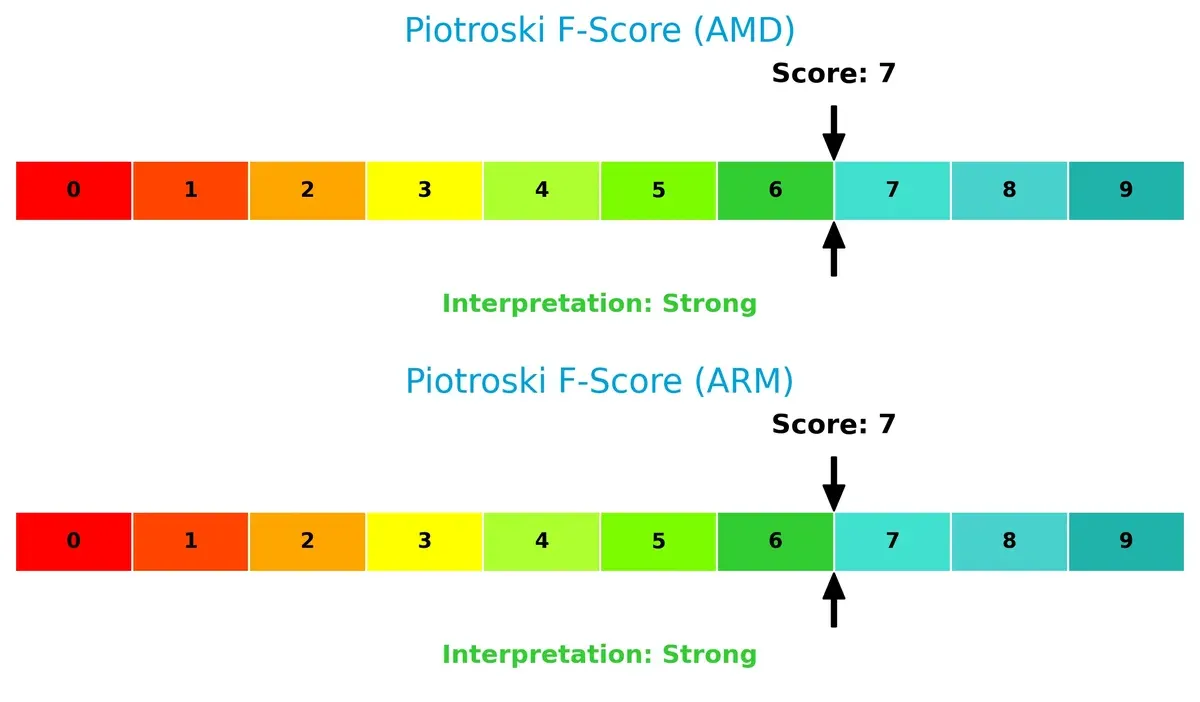
Financial Health: Quality of Operations
Both companies score a 7 on the Piotroski F-Score, indicating strong financial health with no immediate red flags in their internal metrics:
How are the two companies positioned?
This section dissects the operational DNA of AMD and Arm by comparing their revenue distribution by segment and internal dynamics, including strengths and weaknesses. The goal is to confront their economic moats to identify which model offers the most resilient and sustainable competitive advantage today.
Revenue Segmentation: The Strategic Mix
This comparison dissects how Advanced Micro Devices, Inc. and Arm Holdings plc diversify their income streams and where their primary sector bets lie:
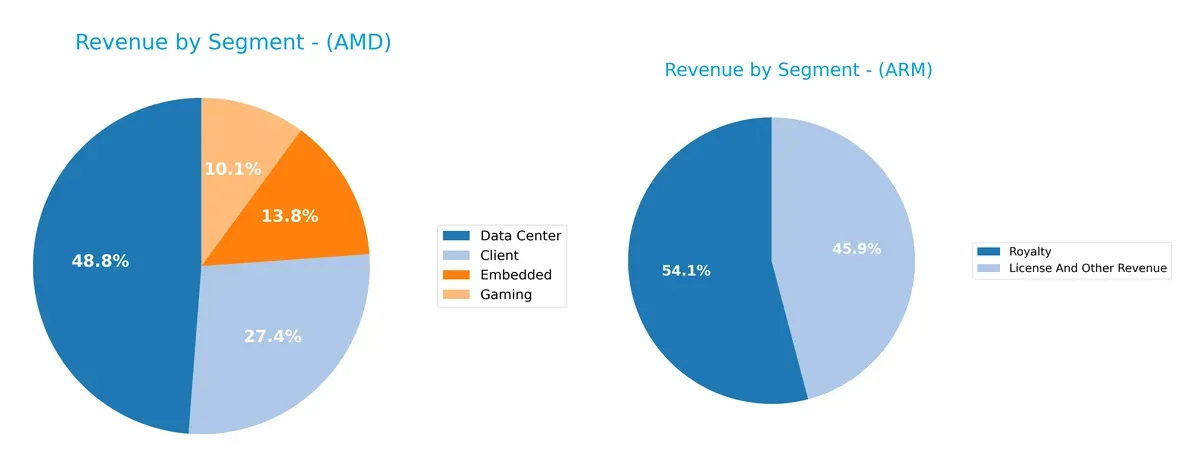
AMD’s revenue diversifies across Client ($7.1B), Data Center ($12.6B), Embedded ($3.6B), and Gaming ($2.6B). Arm leans heavily on two segments: Royalty ($2.2B) and License ($1.8B). AMD’s broader mix anchors growth in multiple markets, reducing concentration risk. Arm pivots on intellectual property royalties, exposing it to ecosystem lock-in but also licensing cyclicality. This makes AMD’s model more resilient amid sector shifts.
Strengths and Weaknesses Comparison
This table compares the Strengths and Weaknesses of AMD and ARM based on diversification, profitability, financial statement, innovation, global presence, and market share:
AMD Strengths
- Diverse revenue streams including Client, Data Center, Embedded, and Gaming segments
- Strong net margin at 12.51%
- Favorable debt-to-assets ratio at 0%
- Significant global sales with highest revenue in the United States and China
ARM Strengths
- Higher net margin at 19.77%
- Favorable quick ratio and interest coverage
- Low debt-to-assets at 3.99%
- Strong fixed asset turnover of 5.61
- Diversified revenues from License and Royalty streams
AMD Weaknesses
- Unfavorable ROE and ROIC at 0%
- Unavailable WACC data
- Unfavorable high PE of 80.54
- Poor liquidity ratios (current and quick ratios)
- Negative interest coverage and asset turnover
ARM Weaknesses
- Unfavorable ROIC and high WACC at 24.41%
- Very high PE at 141.58 and PB at 16.4
- Current ratio unfavorable despite quick ratio strength
- Asset turnover rated unfavorable
- Dividend yield at 0%
Both companies exhibit strong net margins but face challenges in capital efficiency and valuation metrics. AMD’s liquidity and profitability ratios reveal vulnerabilities, while ARM’s elevated valuation multiples and capital costs pose risks. These factors are crucial for strategic financial management and investor consideration.
The Moat Duel: Analyzing Competitive Defensibility
A structural moat is the only true shield protecting a company’s long-term profits from relentless competition erosion:
Advanced Micro Devices, Inc. (AMD): Innovation-Driven Performance Moat
AMD’s primary advantage lies in cutting-edge product innovation and diversified chip portfolios. This delivers strong revenue growth and margin stability. However, its declining ROIC signals potential efficiency challenges in capital deployment as competition intensifies in 2026.
Arm Holdings plc (ARM): Licensing Network Effects Moat
ARM leverages an extensive licensing model creating deep network effects, enabling broad ecosystem adoption. Its high gross and net margins reflect operational strength. Yet, value destruction indicated by negative ROIC versus WACC warns of capital inefficiencies, though growth opportunities remain in IoT and automotive sectors.
Semiconductor Giants: Innovation vs. Ecosystem Licensing
AMD’s innovation-led moat drives robust top-line gains but faces capital efficiency headwinds. ARM’s licensing network offers wider ecosystem lock-in but struggles to create shareholder value. I see AMD better positioned to defend market share amid intensifying sector competition.
Which stock offers better returns?
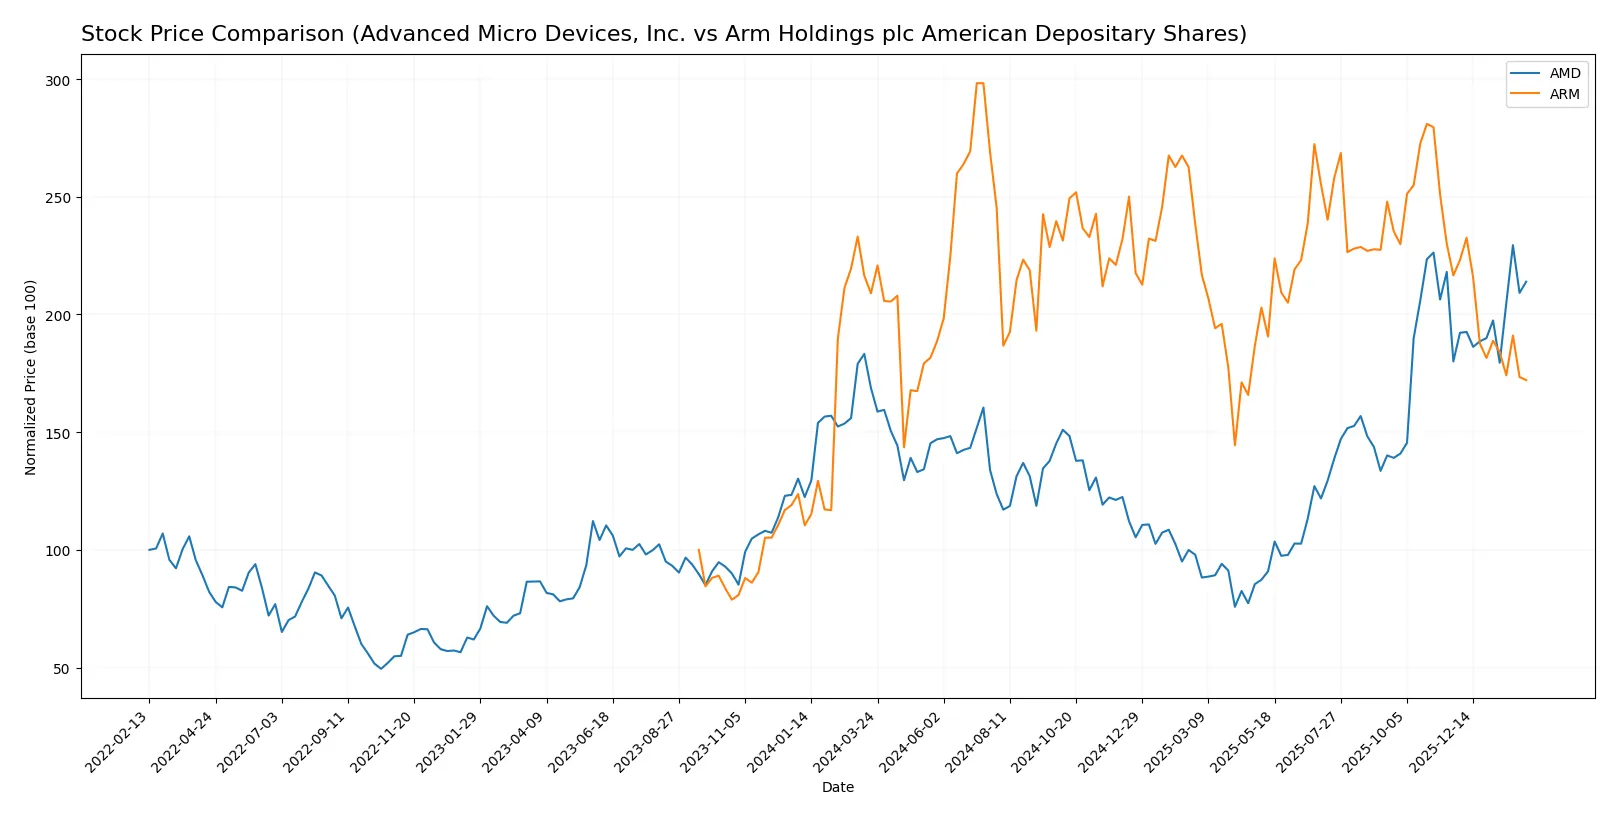
The past year shows contrasting price dynamics: AMD’s stock price rises steadily with accelerating momentum, while Arm Holdings’ price declines with deceleration, reflecting divergent investor sentiment and market positioning.
Trend Comparison
Advanced Micro Devices, Inc. stock price increased 26.72% over the past 12 months, showing a bullish trend with accelerating gains and high volatility, peaking at 259.68 and bottoming at 85.76.
Arm Holdings plc American Depositary Shares declined 17.66% in the same period, marking a bearish trend with deceleration, moderate volatility, and a high-low range between 181.19 and 87.19.
AMD’s bullish acceleration contrasts with Arm’s bearish deceleration, resulting in AMD delivering the highest market performance over the past year.
Target Prices
Analysts present a confident target consensus for Advanced Micro Devices and Arm Holdings.
| Company | Target Low | Target High | Consensus |
|---|---|---|---|
| Advanced Micro Devices, Inc. | 225 | 380 | 291.56 |
| Arm Holdings plc American Depositary Shares | 120 | 170 | 145 |
The consensus target prices imply upside potential of roughly 20% for AMD and nearly 39% for Arm versus current prices. Analysts expect both semiconductor firms to outperform their recent trading levels.

Don’t Let Luck Decide Your Entry Point
Optimize your entry points with our advanced ProRealTime indicators. You’ll get efficient buy signals with precise price targets for maximum performance. Start outperforming now!
How do institutions grade them?
The following tables summarize the latest institutional grades for both companies:
Advanced Micro Devices, Inc. Grades
Below are recent grades and actions from reputable financial institutions for AMD.
| Grading Company | Action | New Grade | Date |
|---|---|---|---|
| Wells Fargo | Maintain | Overweight | 2026-01-30 |
| Piper Sandler | Maintain | Overweight | 2026-01-26 |
| UBS | Maintain | Buy | 2026-01-26 |
| Bernstein | Maintain | Market Perform | 2026-01-21 |
| Keybanc | Upgrade | Overweight | 2026-01-13 |
| Truist Securities | Maintain | Buy | 2025-12-19 |
| Cantor Fitzgerald | Maintain | Overweight | 2025-12-16 |
| Morgan Stanley | Maintain | Equal Weight | 2025-11-12 |
| Wedbush | Maintain | Outperform | 2025-11-12 |
| Rosenblatt | Maintain | Buy | 2025-11-12 |
Arm Holdings plc American Depositary Shares Grades
Here are the latest institutional grades and recommendations for Arm Holdings.
| Grading Company | Action | New Grade | Date |
|---|---|---|---|
| Wells Fargo | Maintain | Overweight | 2026-01-26 |
| UBS | Maintain | Buy | 2026-01-26 |
| Morgan Stanley | Maintain | Overweight | 2026-01-23 |
| Susquehanna | Upgrade | Positive | 2026-01-21 |
| B of A Securities | Downgrade | Neutral | 2026-01-13 |
| B of A Securities | Maintain | Buy | 2025-12-16 |
| Goldman Sachs | Downgrade | Sell | 2025-12-15 |
| Loop Capital | Maintain | Buy | 2025-11-12 |
| Wells Fargo | Maintain | Overweight | 2025-11-06 |
| Rosenblatt | Maintain | Buy | 2025-11-06 |
Which company has the best grades?
AMD has consistently strong grades, mainly Overweight and Buy, with few downgrades. Arm shows more grade volatility, including downgrades to Neutral and Sell. Investors may interpret AMD’s steadier grades as higher confidence from analysts.
Risks specific to each company
The following categories identify the critical pressure points and systemic threats facing both firms in the 2026 market environment:
1. Market & Competition
Advanced Micro Devices, Inc.
- Faces intense rivalry from major chipmakers in CPUs and GPUs, requiring continuous innovation to maintain market share.
Arm Holdings plc American Depositary Shares
- Competes primarily through IP licensing with rising pressure from alternative architectures and evolving tech demands.
2. Capital Structure & Debt
Advanced Micro Devices, Inc.
- Exhibits a favorable debt-to-equity profile with low leverage but shows weak interest coverage, signaling potential earnings pressure.
Arm Holdings plc American Depositary Shares
- Maintains very low debt levels and strong interest coverage, reflecting prudent capital management and financial stability.
3. Stock Volatility
Advanced Micro Devices, Inc.
- Beta near 1.95 indicates higher-than-market volatility, exposing investors to sharp price swings amid sector cycles.
Arm Holdings plc American Depositary Shares
- Beta of 4.37 signals extreme sensitivity to market moves, increasing risk for risk-averse investors.
4. Regulatory & Legal
Advanced Micro Devices, Inc.
- Subject to US technology export controls and antitrust scrutiny that may constrain growth and international sales.
Arm Holdings plc American Depositary Shares
- Faces regulatory complexity as a UK-based firm with significant exposure to US and China regulations affecting licensing.
5. Supply Chain & Operations
Advanced Micro Devices, Inc.
- Relies on complex semiconductor manufacturing and foundry partners; supply chain disruptions could impact product delivery.
Arm Holdings plc American Depositary Shares
- Licensing model reduces direct supply chain risk but depends heavily on licensees’ operational execution.
6. ESG & Climate Transition
Advanced Micro Devices, Inc.
- Increasing pressure to improve energy efficiency of products amid growing regulatory focus on carbon footprint.
Arm Holdings plc American Depositary Shares
- Faces scrutiny on sustainable operations and governance amid evolving ESG standards in tech licensing.
7. Geopolitical Exposure
Advanced Micro Devices, Inc.
- Exposure to US-China tensions could affect supply chains and market access, given global semiconductor geopolitics.
Arm Holdings plc American Depositary Shares
- Operates globally with complex exposure to trade policies across US, China, and Europe, complicating risk management.
Which company shows a better risk-adjusted profile?
Advanced Micro Devices’ principal risk lies in its elevated stock volatility and regulatory hurdles in a competitive market. Arm Holdings faces more extreme stock volatility and regulatory complexity but benefits from stronger capital structure and financial stability. The safer debt profile and higher Altman Z-Score give Arm a slight edge on risk-adjusted metrics. However, Arm’s very high beta warns of unpredictable price swings. Recent data show Arm’s beta at 4.37 versus AMD’s 1.95, underscoring Arm’s amplified market sensitivity. Overall, Arm’s financial strength offsets its volatility, making it marginally more attractive for disciplined risk management.
Final Verdict: Which stock to choose?
Advanced Micro Devices, Inc. (AMD) excels as a cash-generating powerhouse with robust revenue growth and solid income quality. Its main point of vigilance lies in a declining ROIC trend, raising concerns about sustainable capital efficiency. AMD suits aggressive growth portfolios willing to embrace some operational risk for higher upside.
Arm Holdings plc (ARM) commands a strategic moat through its cloud and technology licensing dominance, offering strong revenue visibility and high gross margins. Despite a less favorable valuation and some value destruction per ROIC analysis, ARM presents a relatively safer balance sheet profile than AMD, fitting well within GARP (Growth at a Reasonable Price) strategies.
If you prioritize high-growth momentum with a tolerance for operational efficiency risks, AMD outshines as the compelling choice due to its cash flow strength and market acceleration. However, if you seek greater stability and recurring revenue advantages with moderate growth expectations, ARM offers better resilience despite its valuation premium. Both present distinct investment scenarios requiring careful risk assessment.
Disclaimer: Investment carries a risk of loss of initial capital. The past performance is not a reliable indicator of future results. Be sure to understand risks before making an investment decision.
Go Further
I encourage you to read the complete analyses of Advanced Micro Devices, Inc. and Arm Holdings plc American Depositary Shares to enhance your investment decisions: