Home > Comparison > Technology > AMD vs AMAT
The strategic rivalry between Advanced Micro Devices, Inc. (AMD) and Applied Materials, Inc. (AMAT) shapes the semiconductor industry’s evolution. AMD focuses on high-performance computing and graphics chips, emphasizing innovation and scalable architectures. In contrast, AMAT dominates semiconductor manufacturing equipment, operating a capital-intensive model that underpins chip production globally. This analysis will assess which company’s trajectory delivers superior risk-adjusted returns, balancing growth potential against industry cyclicality for a diversified portfolio.
Table of contents
Companies Overview
Advanced Micro Devices and Applied Materials both hold pivotal roles in the semiconductor industry, shaping technology’s future.
Advanced Micro Devices, Inc.: Semiconductor Innovator Focusing on Computing and Graphics
Advanced Micro Devices, Inc. dominates the semiconductor market with a focus on high-performance processors and graphics units. Its core revenue comes from microprocessors, GPUs, and custom SoC products for PCs, servers, and gaming consoles. In 2026, AMD emphasizes expanding its data center and professional GPU segments, leveraging its cutting-edge architecture to capture cloud and enterprise demand.
Applied Materials, Inc.: Manufacturing Equipment Powerhouse for Semiconductors
Applied Materials, Inc. leads in manufacturing equipment that fabricates semiconductor chips globally. Its revenue engine relies on selling and servicing advanced fabrication tools across semiconductor, display, and adjacent markets. The company’s 2026 strategy centers on enhancing equipment efficiency and fab productivity, delivering integrated solutions and automation software to sustain semiconductor manufacturing excellence worldwide.
Strategic Collision: Similarities & Divergences
While AMD focuses on designing chips with a competitive edge in performance, Applied Materials builds the essential tools that produce those chips, reflecting a design-versus-manufacturing dichotomy. Their primary battleground is the semiconductor value chain: AMD competes in end-user chip markets, whereas Applied Materials dominates capital equipment sales. Together, they represent distinct investment profiles—AMD as a high-growth, product-driven innovator and Applied Materials as a steady, capital-intensive enabler of semiconductor supply.
Income Statement Comparison
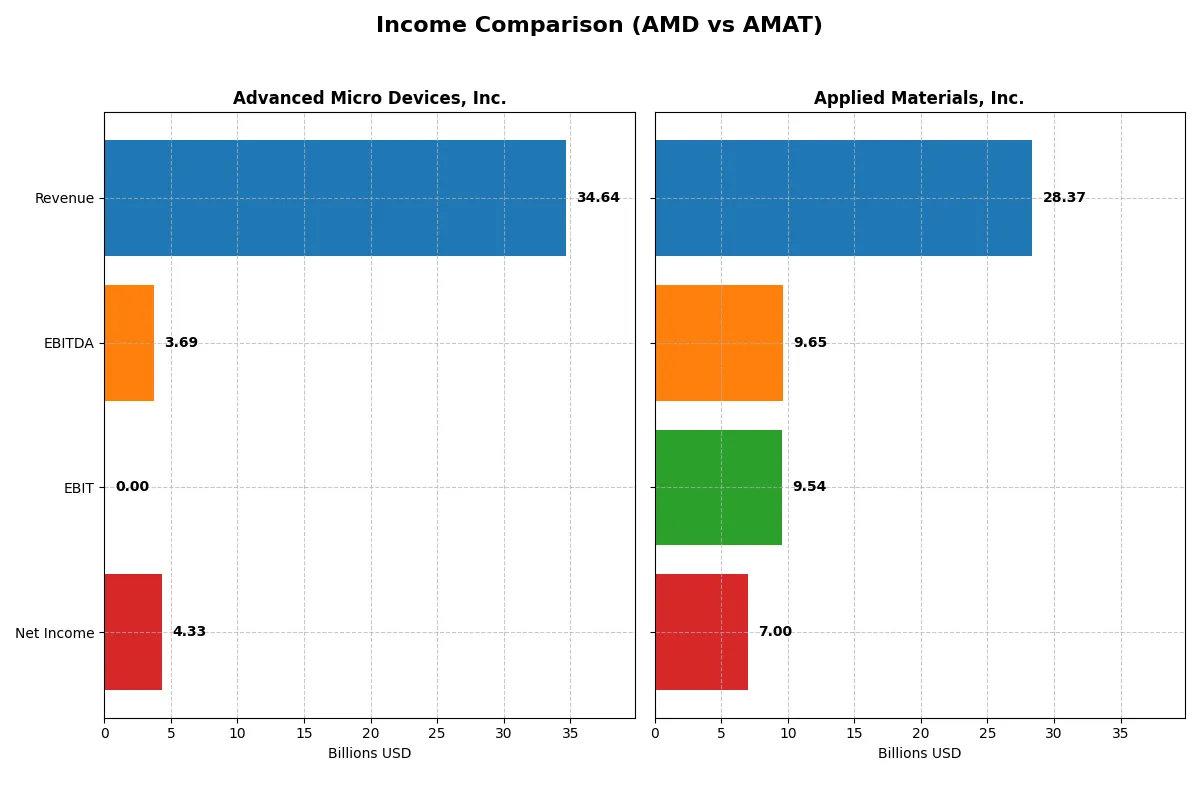
This data dissects the core profitability and scalability of both corporate engines to reveal who dominates the bottom line:
| Metric | Advanced Micro Devices, Inc. (AMD) | Applied Materials, Inc. (AMAT) |
|---|---|---|
| Revenue | 34.6B | 28.4B |
| Cost of Revenue | 17.5B | 14.6B |
| Operating Expenses | 13.5B | 5.5B |
| Gross Profit | 17.2B | 13.8B |
| EBITDA | 3.7B | 9.7B |
| EBIT | 3.7B | 9.5B |
| Interest Expense | 131M | 269M |
| Net Income | 4.3B | 7.0B |
| EPS | 2.67 | 8.71 |
| Fiscal Year | 2025 | 2025 |
Income Statement Analysis: The Bottom-Line Duel
This income statement comparison reveals which company runs a more efficient and profitable corporate engine through recent financial performance.
Advanced Micro Devices, Inc. Analysis
AMD’s revenue surged from 16.4B in 2021 to 34.6B in 2025, reflecting a strong growth trajectory. Net income followed, climbing from 3.16B to 4.34B, though the EBIT margin collapsed to zero in 2025, signaling operational pressure. The gross margin remains robust at 49.5%, while net margin stands at a solid 12.5%, showing improving bottom-line efficiency despite EBIT weakness.
Applied Materials, Inc. Analysis
AMAT’s revenue grew steadily from 23.1B in 2021 to 28.4B in 2025, with net income rising from 5.89B to 7.0B. The company sustains a healthy gross margin of 48.7% and an impressive EBIT margin above 33%, reflecting strong operational control. Net margin at 24.7% outperforms AMD significantly, although revenue growth slowed to a modest 4.4% last year, indicating a mature growth phase.
Margin Power vs. Revenue Scale
AMAT delivers superior profitability with a 24.7% net margin and strong EBIT margin, outperforming AMD’s thinner 12.5% net margin and zero EBIT margin in 2025. AMD boasts faster revenue growth, doubling sales in five years, but at the cost of margin compression. Investors seeking robust profitability and steady returns may favor AMAT’s profile, while growth-oriented investors might lean toward AMD’s top-line momentum.
Financial Ratios Comparison
These vital ratios act as a diagnostic tool to expose the underlying fiscal health, valuation premiums, and capital efficiency of the companies analyzed:
| Ratios | Advanced Micro Devices, Inc. (AMD) | Applied Materials, Inc. (AMAT) |
|---|---|---|
| ROE | 2.85% (2024) | 34.28% (2025) |
| ROIC | 2.49% (2024) | 21.96% (2025) |
| P/E | 124 (2024) | 26.58 (2025) |
| P/B | 3.52 (2024) | 9.11 (2025) |
| Current Ratio | 2.62 (2024) | 2.61 (2025) |
| Quick Ratio | 1.83 (2024) | 1.87 (2025) |
| D/E | 0.038 (2024) | 0.345 (2025) |
| Debt-to-Assets | 3.20% (2024) | 19.42% (2025) |
| Interest Coverage | 20.65 (2024) | 30.81 (2025) |
| Asset Turnover | 0.37 (2024) | 0.78 (2025) |
| Fixed Asset Turnover | 10.63 (2024) | 5.54 (2025) |
| Payout Ratio | 0% (2024) | 19.78% (2025) |
| Dividend Yield | 0% (2024) | 0.74% (2025) |
| Fiscal Year | 2024 | 2025 |
Efficiency & Valuation Duel: The Vital Signs
Financial ratios act as a company’s DNA, exposing hidden risks and operational strengths crucial for investment decisions.
Advanced Micro Devices, Inc.
AMD shows a stretched valuation with a high P/E of 80.54, signaling expensive stock pricing. Its net margin stands at a modest 12.51%, but both ROE and ROIC remain unfavorable at zero. AMD reinvests heavily in R&D, prioritizing growth over dividends, reflecting a long-term innovation focus despite weak shareholder returns.
Applied Materials, Inc.
AMAT demonstrates strong profitability with a 24.67% net margin and a robust 34.28% ROE. Its P/E of 26.58 is lower than AMD’s but still elevated, indicating a relatively expensive valuation. AMAT balances growth with shareholder returns, maintaining a 0.74% dividend yield and solid capital efficiency metrics, signaling operational discipline alongside shareholder rewards.
Premium Valuation vs. Operational Safety
AMAT offers a superior balance of profitability and financial health, with favorable ratios and consistent dividends. AMD’s valuation appears stretched with weaker returns but focuses on growth through R&D. AMAT fits investors seeking operational safety; AMD suits those prioritizing long-term growth ambitions.
Which one offers the Superior Shareholder Reward?
Advanced Micro Devices (AMD) does not pay dividends, focusing heavily on reinvestment in R&D and growth, with a high price-to-free-cash-flow ratio around 63–84. Applied Materials (AMAT) offers a modest dividend yield near 0.7–0.9% and a payout ratio around 15–20%, alongside steady buybacks supporting free cash flow of 7B to 9B. AMAT’s sustainable dividend, solid cash flow, and consistent buybacks deliver more balanced shareholder rewards. I conclude AMAT presents the superior total return profile in 2026, blending income and capital appreciation more prudently than AMD’s growth-only approach.
Comparative Score Analysis: The Strategic Profile
The radar chart reveals the fundamental DNA and strategic trade-offs of Advanced Micro Devices, Inc. and Applied Materials, Inc.:
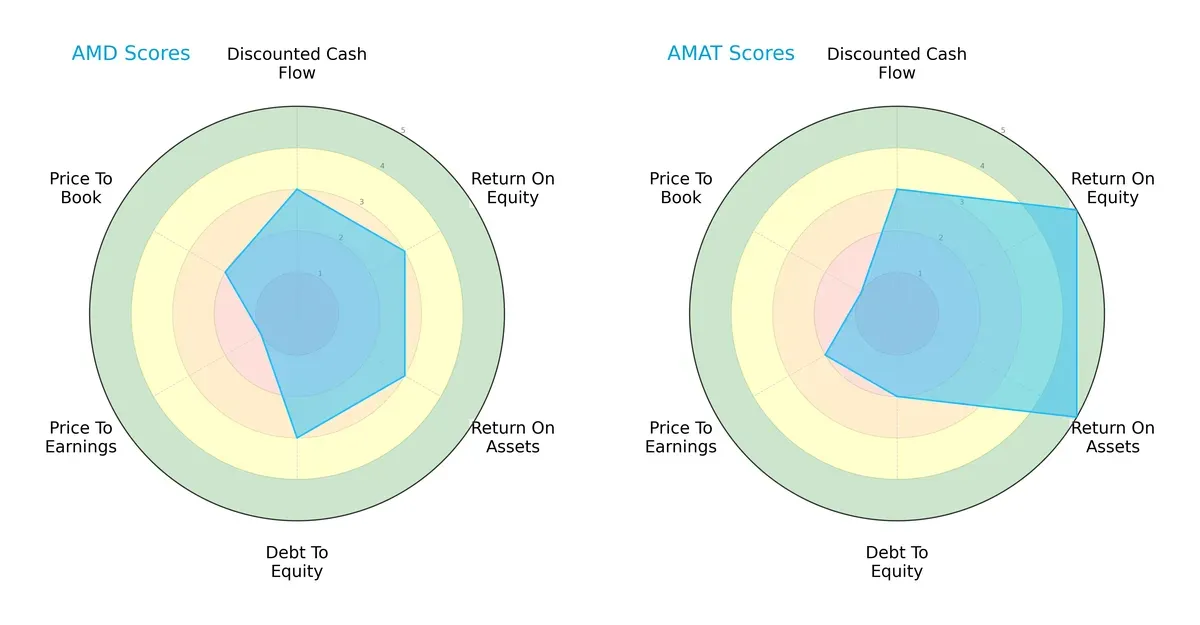
Both companies share a moderate overall score and DCF outlook, signaling balanced cash flow expectations. Applied Materials excels with very favorable ROE and ROA scores (5 vs. 3), showing superior profitability and asset efficiency. However, AMD holds a stronger debt-to-equity score (3 vs. 2), indicating a more conservative leverage approach. AMD’s valuation metrics are weaker, especially its P/E score (1 vs. 2), suggesting it trades at a less attractive earnings multiple. Overall, Applied Materials presents a more performance-driven profile, while AMD leans on financial discipline.
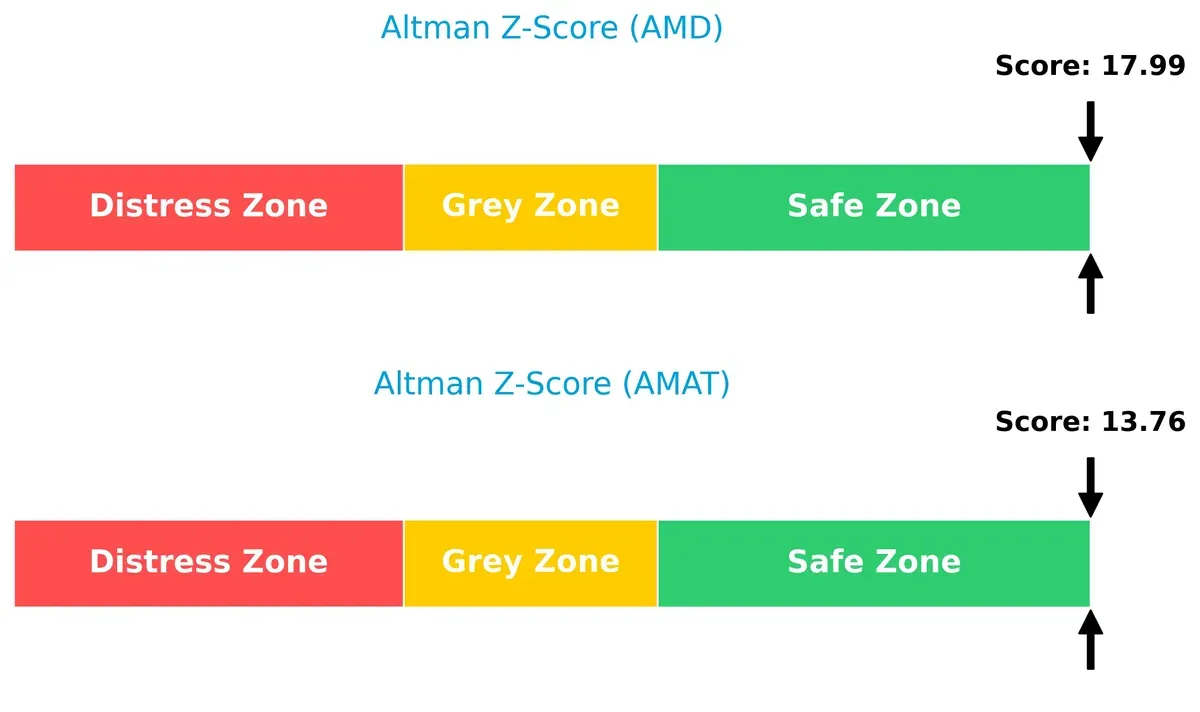
Bankruptcy Risk: Solvency Showdown
The Altman Z-Scores place both firms well within the safe zone, with AMD at 18.0 and Applied Materials at 13.8, reflecting strong solvency and low bankruptcy risk in today’s market cycle:
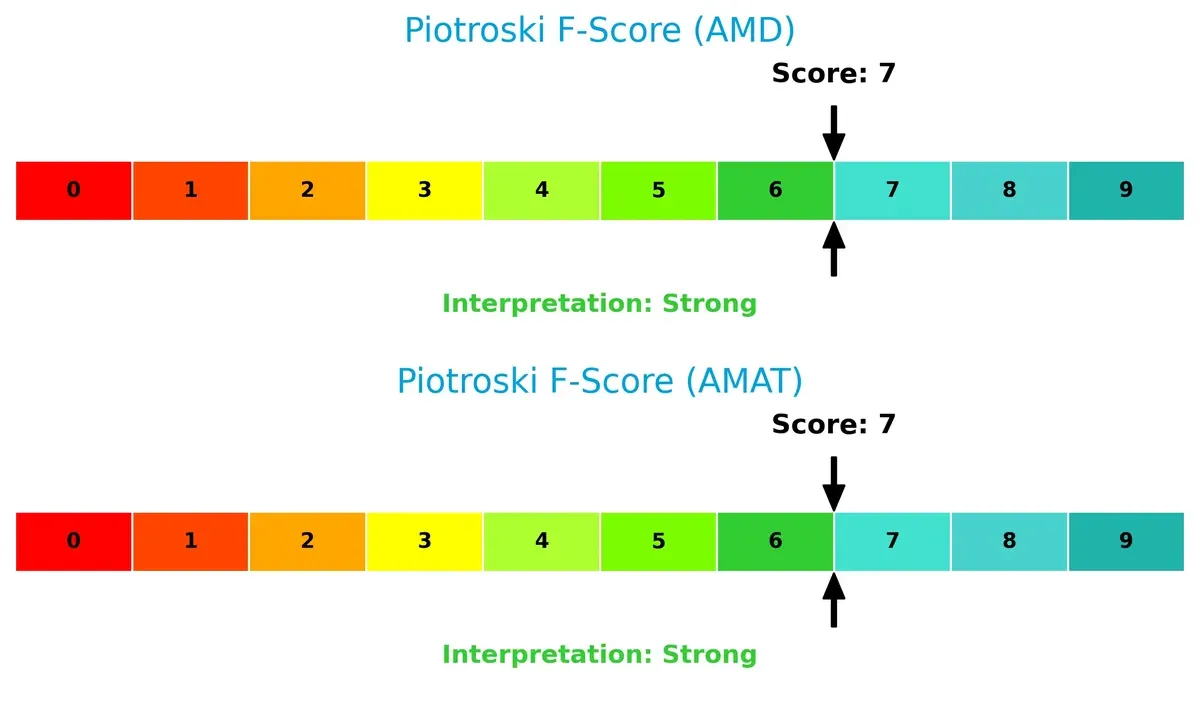
Financial Health: Quality of Operations
Both Advanced Micro Devices and Applied Materials score a strong 7 on the Piotroski F-Score, demonstrating robust financial health and solid internal metrics, with no immediate red flags for operational weakness:
How are the two companies positioned?
This section dissects AMD’s and AMAT’s operational DNA by comparing their revenue distribution and internal dynamics of strengths and weaknesses. The goal is to confront their economic moats and identify which business model offers the most resilient, sustainable competitive advantage today.
Revenue Segmentation: The Strategic Mix
This visual comparison dissects how Advanced Micro Devices, Inc. and Applied Materials, Inc. diversify their income streams and where their primary sector bets lie:
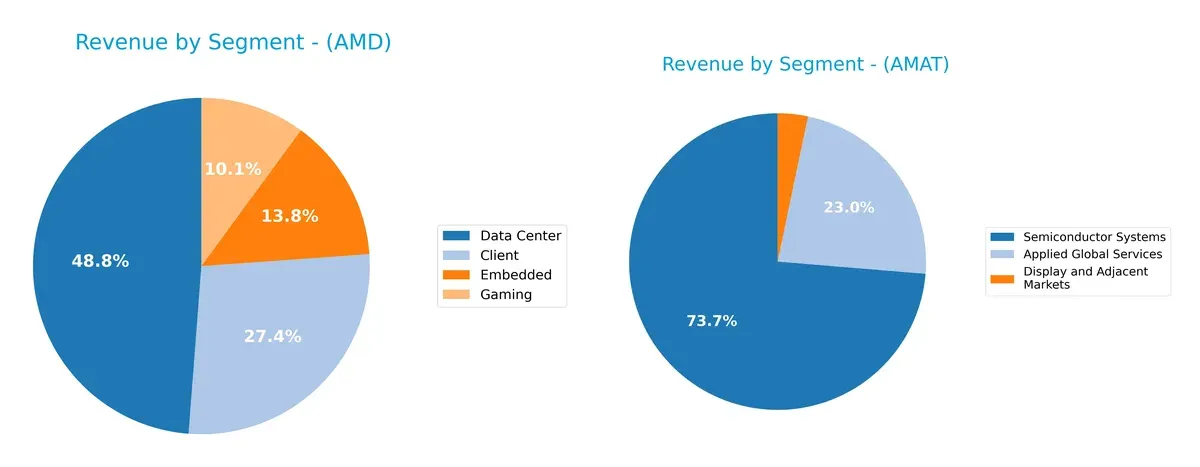
AMD’s revenue splits more evenly across Data Center ($12.6B), Client ($7.1B), Embedded ($3.6B), and Gaming ($2.6B). AMAT anchors its revenue heavily in Semiconductor Systems ($19.9B), dwarfs smaller segments like Applied Global Services ($6.2B) and Display ($0.9B). AMD’s balanced mix reduces concentration risk, while AMAT’s dominance in semiconductor infrastructure signals strong ecosystem lock-in but higher cyclicality exposure.
Strengths and Weaknesses Comparison
This table compares the Strengths and Weaknesses of AMD and AMAT:
AMD Strengths
- Significant diversification across Client, Data Center, Embedded, and Gaming segments
- Growing revenue in high-demand computing and graphics markets
- Strong presence in the US and China markets
AMAT Strengths
- Broad product segmentation with Applied Global Services and Semiconductor Systems
- High profitability with favorable net margin, ROE, and ROIC
- Solid liquidity ratios and controlled leverage
- Diverse global footprint including China, Korea, and Taiwan
AMD Weaknesses
- Unfavorable ROE and ROIC indicating weak returns on capital
- Lack of available WACC data limits cost of capital analysis
- Poor liquidity ratios and negative interest coverage raise financial risk concerns
- High P/E ratio signals possible overvaluation
AMAT Weaknesses
- Unfavorable P/E and high P/B ratios suggest valuation concerns
- WACC above ROIC may pressure capital efficiency
- Moderate dividend yield could limit income appeal
Both companies show strong diversification and global reach in semiconductor-related markets. However, AMD faces challenges in capital efficiency and liquidity, while AMAT’s valuation metrics may constrain future upside. These factors will influence their strategic financial positioning moving forward.
The Moat Duel: Analyzing Competitive Defensibility
A structural moat is the only true defense against profit erosion from competition over the long term. Let’s dissect the core moats of two semiconductor giants:
Advanced Micro Devices, Inc. (AMD): Innovation-Driven Product Moat
AMD’s moat stems from cutting-edge chip design and brand momentum in CPUs and GPUs. The firm shows strong revenue growth and margin stability, but declining ROIC signals caution. Expansion into data centers and gaming could deepen this moat if execution stays sharp in 2026.
Applied Materials, Inc. (AMAT): Capital-Intensive Equipment Moat
AMAT’s moat lies in high barriers to entry through specialized manufacturing equipment and entrenched customer relationships. Unlike AMD’s product focus, AMAT generates stable, high returns on capital despite a recent ROIC dip. Its broad geographic reach and service integration may fuel modest growth and protect market share.
Innovation Velocity vs. Capital Moat: Who Defends Better?
AMD drives rapid innovation but faces a weakening capital efficiency trend. AMAT, with a capital-intensive moat, creates steady value despite some profitability decline. I see AMAT’s moat as deeper and more durable, better suited to defend market share amid semiconductor cycles.
Which stock offers better returns?
The past year shows strong bullish momentum for both stocks, with notable price appreciations and varying trading volume dynamics shaping market behavior.
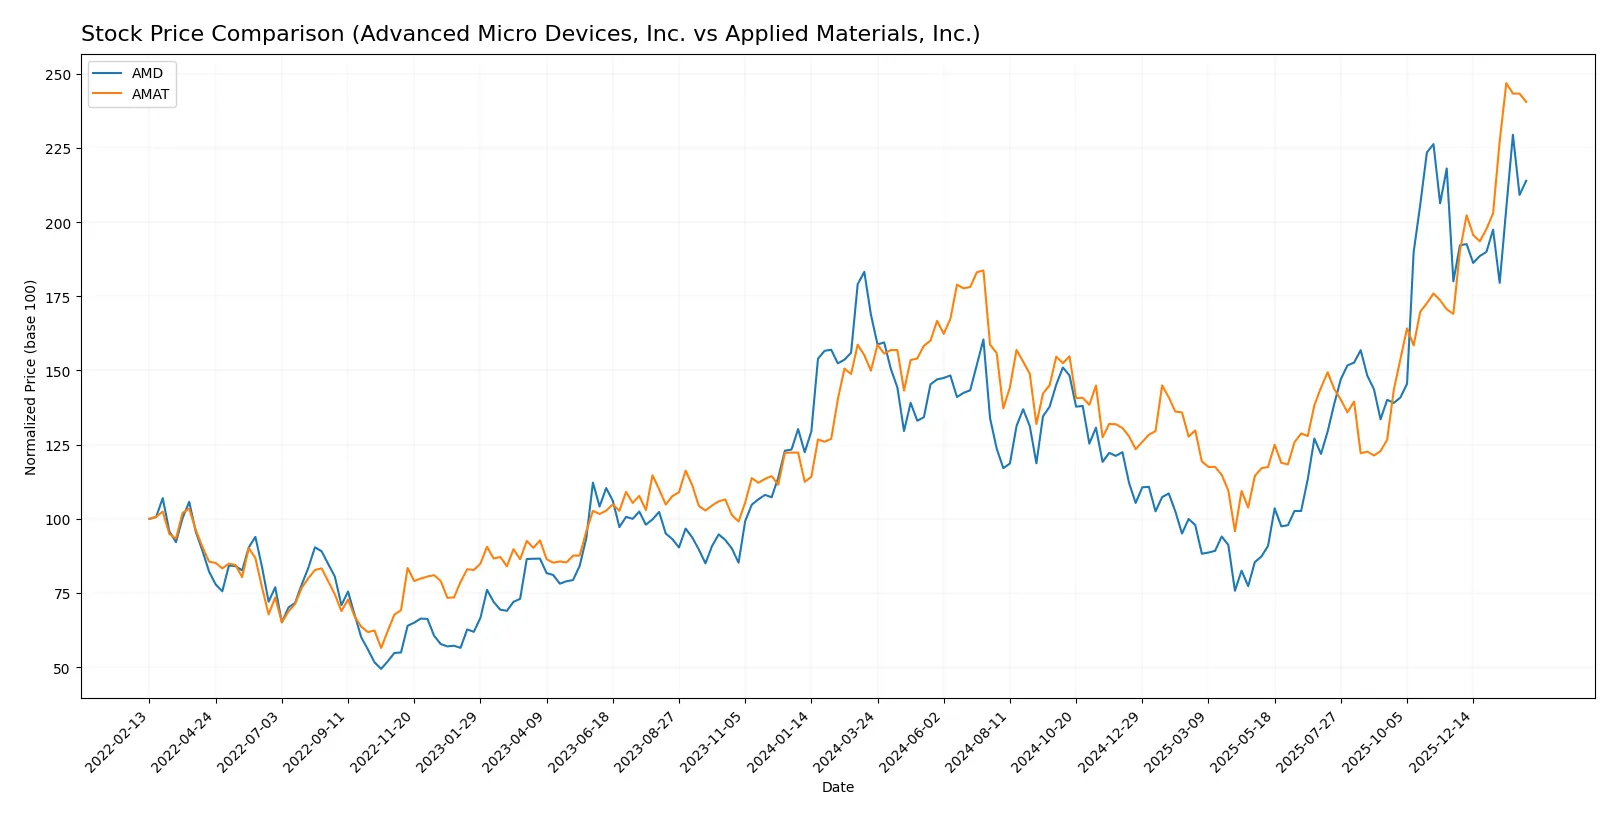
Trend Comparison
Advanced Micro Devices, Inc. (AMD) posted a 26.72% price gain over the past 12 months, signaling a bullish trend with accelerating momentum from a low of 85.76 to a high of 259.68. Its recent 18.81% rise confirms sustained strength despite volume decreasing overall.
Applied Materials, Inc. (AMAT) outperformed with a 60.42% increase over the same period, also bullish and accelerating. The stock ranged from 126.95 to 327.01, with a strong recent surge of 42.26%, although recent volume shows slight seller dominance.
AMAT delivered the highest market performance with a 60.42% gain, significantly surpassing AMD’s 26.72%, reflecting stronger price appreciation and accelerating trend dynamics.
Target Prices
Analysts show a robust target consensus for both Advanced Micro Devices, Inc. and Applied Materials, Inc.
| Company | Target Low | Target High | Consensus |
|---|---|---|---|
| Advanced Micro Devices, Inc. | 225 | 380 | 291.56 |
| Applied Materials, Inc. | 290 | 405 | 360.56 |
The consensus targets surpass current prices significantly, indicating strong analyst optimism. AMD’s target consensus exceeds its $242 price by 20%, while AMAT’s $360 consensus is roughly 13% above its $319 stock price.

Don’t Let Luck Decide Your Entry Point
Optimize your entry points with our advanced ProRealTime indicators. You’ll get efficient buy signals with precise price targets for maximum performance. Start outperforming now!
How do institutions grade them?
Here is a summary of recent institutional grades assigned to Advanced Micro Devices, Inc. and Applied Materials, Inc.:
Advanced Micro Devices, Inc. Grades
This table shows recent grades and actions from reputable grading companies for AMD.
| Grading Company | Action | New Grade | Date |
|---|---|---|---|
| Wells Fargo | Maintain | Overweight | 2026-01-30 |
| Piper Sandler | Maintain | Overweight | 2026-01-26 |
| UBS | Maintain | Buy | 2026-01-26 |
| Bernstein | Maintain | Market Perform | 2026-01-21 |
| Keybanc | Upgrade | Overweight | 2026-01-13 |
| Truist Securities | Maintain | Buy | 2025-12-19 |
| Cantor Fitzgerald | Maintain | Overweight | 2025-12-16 |
| Morgan Stanley | Maintain | Equal Weight | 2025-11-12 |
| Wedbush | Maintain | Outperform | 2025-11-12 |
| Rosenblatt | Maintain | Buy | 2025-11-12 |
Applied Materials, Inc. Grades
This table presents recent institutional grades and rating changes for AMAT.
| Grading Company | Action | New Grade | Date |
|---|---|---|---|
| Morgan Stanley | Maintain | Overweight | 2026-02-02 |
| Mizuho | Upgrade | Outperform | 2026-01-28 |
| Deutsche Bank | Upgrade | Buy | 2026-01-23 |
| Needham | Maintain | Buy | 2026-01-20 |
| Keybanc | Maintain | Overweight | 2026-01-16 |
| Barclays | Upgrade | Overweight | 2026-01-15 |
| Wells Fargo | Maintain | Overweight | 2026-01-15 |
| Stifel | Maintain | Buy | 2026-01-14 |
| B of A Securities | Maintain | Buy | 2026-01-13 |
| Susquehanna | Upgrade | Positive | 2026-01-12 |
Which company has the best grades?
Applied Materials, Inc. has received more upgrades and consistently positive ratings, including multiple “Buy” and “Outperform” grades. Advanced Micro Devices, Inc. shows solid but more mixed grades, including “Market Perform” and “Equal Weight.” Investors might view AMAT’s stronger grade trend as a signal of greater institutional confidence.
Risks specific to each company
The following categories identify the critical pressure points and systemic threats facing both firms in the 2026 market environment:
1. Market & Competition
Advanced Micro Devices, Inc. (AMD)
- Faces intense competition in CPUs and GPUs from larger incumbents; needs constant innovation to maintain market share.
Applied Materials, Inc. (AMAT)
- Competes in semiconductor equipment with high capital barriers but must adapt to cyclical chip industry demand.
2. Capital Structure & Debt
Advanced Micro Devices, Inc. (AMD)
- Exhibits very low debt, supporting financial flexibility but shows weak liquidity metrics.
Applied Materials, Inc. (AMAT)
- Maintains moderate debt levels with strong interest coverage and healthy current and quick ratios.
3. Stock Volatility
Advanced Micro Devices, Inc. (AMD)
- High beta near 1.95 indicates significant volatility, reflecting sensitivity to market swings.
Applied Materials, Inc. (AMAT)
- Lower beta at 1.68 shows less price volatility, offering relatively smoother stock performance.
4. Regulatory & Legal
Advanced Micro Devices, Inc. (AMD)
- Subject to export controls and antitrust scrutiny in a highly politicized semiconductor sector.
Applied Materials, Inc. (AMAT)
- Faces regulatory risks tied to international manufacturing standards and environmental compliance.
5. Supply Chain & Operations
Advanced Micro Devices, Inc. (AMD)
- Dependent on foundry partners for chip fabrication, vulnerable to supply disruptions and capacity constraints.
Applied Materials, Inc. (AMAT)
- Exposure to raw materials and complex manufacturing equipment supply chains with operational scaling challenges.
6. ESG & Climate Transition
Advanced Micro Devices, Inc. (AMD)
- Increasing pressure to improve energy efficiency in products and reduce carbon footprint in operations.
Applied Materials, Inc. (AMAT)
- Faces strong ESG demands due to manufacturing intensity; invests in sustainability but risks remain high.
7. Geopolitical Exposure
Advanced Micro Devices, Inc. (AMD)
- High exposure to US-China tensions impacting semiconductor trade and technology transfer restrictions.
Applied Materials, Inc. (AMAT)
- Global operations subject to geopolitical risks in Asia-Pacific and trade policy fluctuations.
Which company shows a better risk-adjusted profile?
Applied Materials carries a more balanced risk profile due to stronger capital structure, liquidity, and profitability metrics. AMD’s high market volatility and weak liquidity ratios present notable red flags. AMAT’s operational scale and ESG initiatives mitigate some sector-specific risks, despite geopolitical exposures. AMD’s greatest risk is its strained liquidity and elevated stock volatility, while AMAT’s main concern lies in cyclical demand and geopolitical tensions. Overall, AMAT offers a safer risk-adjusted investment stance supported by robust financial health and lower beta.
Final Verdict: Which stock to choose?
Advanced Micro Devices, Inc. (AMD) excels as a high-innovation growth engine fueled by relentless R&D investment. Its superpower lies in pioneering chip technology that drives rapid revenue expansion. However, its profitability metrics and capital efficiency suggest a point of vigilance for those wary of valuation stretch and operational leverage. AMD suits aggressive growth portfolios willing to accept volatility for potential market disruption.
Applied Materials, Inc. (AMAT) stands out with a strategic moat built on industry-leading manufacturing equipment and strong operational cash flow. Its robust return on invested capital well above cost signals consistent value creation. Compared to AMD, AMAT offers a steadier financial profile and higher profitability, aligning well with GARP investors seeking growth balanced with reasonable valuation and financial resilience.
If you prioritize high-growth potential and innovation exposure, AMD is the compelling choice due to its disruptive technology and expansion trajectory. However, if you seek better stability and proven capital efficiency, AMAT offers superior risk-adjusted returns and a more durable economic moat. Each appeals to distinct investor avatars balancing growth ambition against financial prudence.
Disclaimer: Investment carries a risk of loss of initial capital. The past performance is not a reliable indicator of future results. Be sure to understand risks before making an investment decision.
Go Further
I encourage you to read the complete analyses of Advanced Micro Devices, Inc. and Applied Materials, Inc. to enhance your investment decisions: