Home > Comparison > Technology > AMD vs ADI
The strategic rivalry between Advanced Micro Devices, Inc. (AMD) and Analog Devices, Inc. (ADI) shapes the semiconductor sector’s evolution. AMD operates as a high-growth, innovative chip designer focusing on CPUs and GPUs for computing and graphics. In contrast, ADI emphasizes analog and mixed-signal integrated circuits for industrial and automotive applications. This analysis evaluates which company’s operational model offers superior risk-adjusted returns for a diversified portfolio amid shifting technology demands.
Table of contents
Companies Overview
Advanced Micro Devices and Analog Devices shape the semiconductor landscape with distinct yet overlapping market roles.
Advanced Micro Devices, Inc.: Innovator in Computing and Graphics
Advanced Micro Devices dominates the semiconductor sector through its Computing and Graphics and Enterprise segments. It generates revenue by selling x86 microprocessors, GPUs, and semi-custom SoC products. In 2026, AMD focuses on expanding its data center and professional GPU offerings, leveraging its strong brand in CPUs and graphics to capture growing cloud and gaming markets.
Analog Devices, Inc.: Leader in Analog and Mixed-Signal ICs
Analog Devices specializes in analog, mixed-signal, and digital signal processing technologies. It earns primarily from integrated circuits that convert and manage power signals for automotive, industrial, and communications sectors. In 2026, ADI prioritizes innovation in power management and sensor technologies to serve high-growth markets like aerospace and automotive electronics.
Strategic Collision: Similarities & Divergences
Both companies thrive in semiconductors but differ sharply in business philosophies. AMD pursues a high-performance computing ecosystem focused on CPUs and GPUs, while ADI emphasizes analog signal precision and power efficiency. Their primary battleground is the industrial and automotive segments where digital meets analog. This contrast creates distinct investment profiles—AMD targets aggressive growth in data centers, ADI favors steady innovation in specialized analog solutions.
Income Statement Comparison
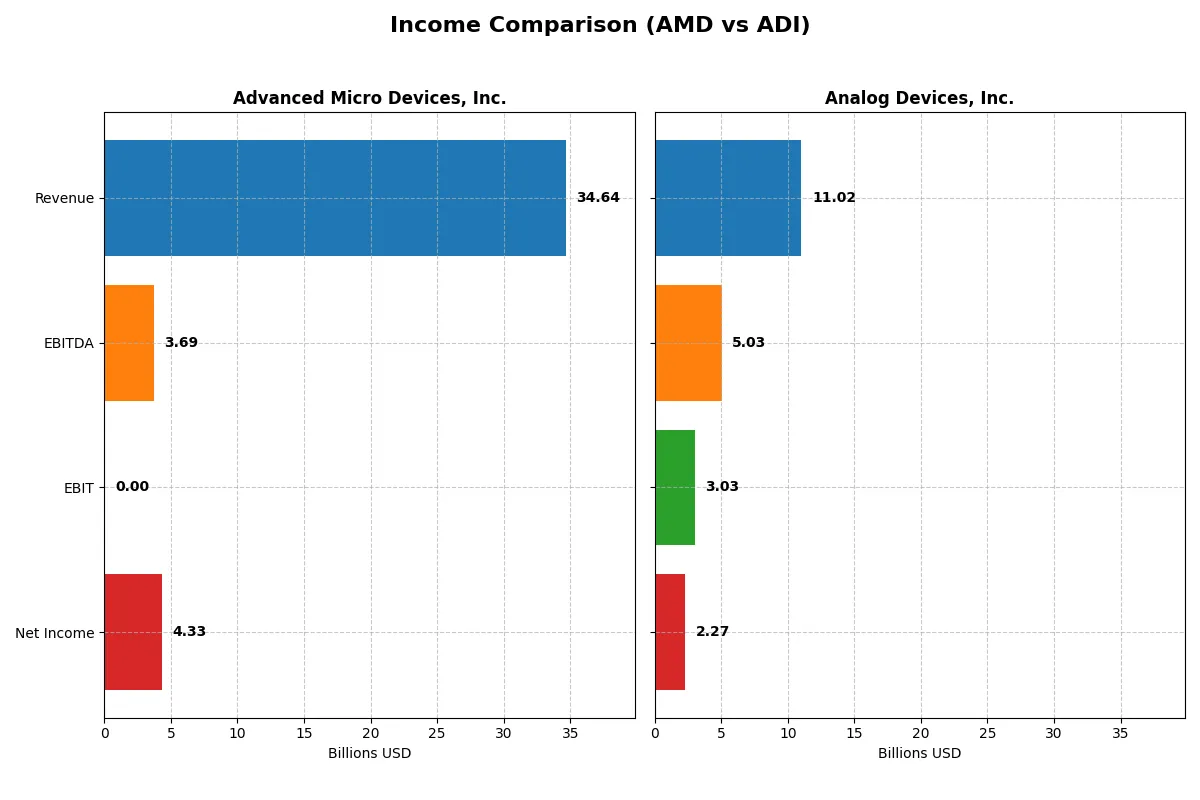
The following data dissects the core profitability and scalability of both corporate engines to reveal who dominates the bottom line:
| Metric | Advanced Micro Devices, Inc. (AMD) | Analog Devices, Inc. (ADI) |
|---|---|---|
| Revenue | 34.6B | 11.0B |
| Cost of Revenue | 17.5B | 5.0B |
| Operating Expenses | 13.5B | 3.0B |
| Gross Profit | 17.2B | 6.0B |
| EBITDA | 3.7B | 5.0B |
| EBIT | 3.7B | 3.0B |
| Interest Expense | 131M | 318M |
| Net Income | 4.3B | 2.3B |
| EPS | 2.67 | 4.59 |
| Fiscal Year | 2025 | 2025 |
Income Statement Analysis: The Bottom-Line Duel
This income statement comparison reveals which company runs a more efficient and profitable corporate engine over recent years.
Advanced Micro Devices, Inc. (AMD) Analysis
AMD’s revenue surged from $16.4B in 2021 to $34.6B in 2025, doubling in four years. Net income rose from $3.16B to $4.34B, showing strong profit growth. Gross margin stands healthy at 49.5%, but EBIT margin fell to zero in 2025, signaling operational challenges. The latest year’s momentum is marked by sharp revenue gains and a doubling of net margin to 12.5%.
Analog Devices, Inc. (ADI) Analysis
ADI’s revenue grew steadily from $7.3B in 2021 to $11B in 2025, marking consistent expansion. Net income increased from $1.39B to $2.27B, with margins particularly robust—gross margin at 54.7% and EBIT margin at 27.5%. The company demonstrates efficient cost control and margin improvement, delivering strong EPS growth of 39% in the past year and a net margin above 20%.
Margin Power vs. Revenue Scale
ADI leads with superior margin stability and operational efficiency, maintaining a 27.5% EBIT margin versus AMD’s zero in 2025. However, AMD boasts faster revenue growth, more than doubling in five years. For investors, ADI’s consistent profitability offers reliability, while AMD’s explosive top-line expansion presents higher growth potential but with operational risks.
Financial Ratios Comparison
These vital ratios act as a diagnostic tool to expose the underlying fiscal health, valuation premiums, and capital efficiency of the companies compared below:
| Ratios | Advanced Micro Devices, Inc. (AMD) | Analog Devices, Inc. (ADI) |
|---|---|---|
| ROE | 2.85% (2024) | 6.70% (2025) |
| ROIC | 2.49% (2024) | 5.55% (2025) |
| P/E | 124x (2024) | 51x (2025) |
| P/B | 3.52 (2024) | 3.42 (2025) |
| Current Ratio | 2.62 (2024) | 2.19 (2025) |
| Quick Ratio | 1.83 (2024) | 1.68 (2025) |
| D/E (Debt-to-Equity) | 0.038 (2024) | 0.256 (2025) |
| Debt-to-Assets | 3.20% (2024) | 18.05% (2025) |
| Interest Coverage | 20.65x (2024) | 9.45x (2025) |
| Asset Turnover | 0.37 (2024) | 0.23 (2025) |
| Fixed Asset Turnover | 10.63 (2024) | 3.32 (2025) |
| Payout ratio | 0% (2024) | 85% (2025) |
| Dividend yield | 0% (2024) | 1.66% (2025) |
| Fiscal Year | 2024 | 2025 |
Efficiency & Valuation Duel: The Vital Signs
Financial ratios act as a company’s DNA, exposing hidden risks and signaling operational excellence to guide investor decisions precisely.
Advanced Micro Devices, Inc.
AMD posts a modest net margin of 12.51% but shows zero return on equity and invested capital, flagging weak profitability. Its P/E ratio at 80.54 signals an expensive valuation. The absence of dividends indicates reinvestment focused heavily on R&D, aligning with growth ambitions despite operational inefficiencies.
Analog Devices, Inc.
ADI delivers a stronger net margin of 20.58% and a 6.7% ROE, reflecting better profitability though still below ideal benchmarks. Its P/E of 51.05 remains high but less stretched than AMD’s. ADI maintains a modest 1.66% dividend yield, balancing shareholder returns with moderate growth investments and healthy liquidity ratios.
Premium Valuation vs. Operational Safety
AMD shows stretched valuation and weak returns, increasing risk despite innovation focus. ADI offers a better mix of profitability, dividend income, and financial stability. Investors seeking operational safety may prefer ADI’s profile, while growth-oriented investors might tolerate AMD’s premium for potential long-term gains.
Which one offers the Superior Shareholder Reward?
I observe that AMD pays no dividends, focusing all cash flow on growth and innovation, with free cash flow per share at 3.4 and no dividend payout. Its lack of buybacks limits direct shareholder returns. Conversely, ADI offers a 1.6% dividend yield, with a payout ratio near 85%, supported by strong free cash flow of 8.7 per share. ADI also maintains consistent buybacks, enhancing total returns. ADI’s balanced distribution via dividends and buybacks appears more sustainable and attractive for income and growth investors in 2026. I conclude ADI offers the superior shareholder reward this year.
Comparative Score Analysis: The Strategic Profile
The radar chart reveals the fundamental DNA and trade-offs of Advanced Micro Devices, Inc. (AMD) and Analog Devices, Inc. (ADI), highlighting their financial strengths and valuation nuances:
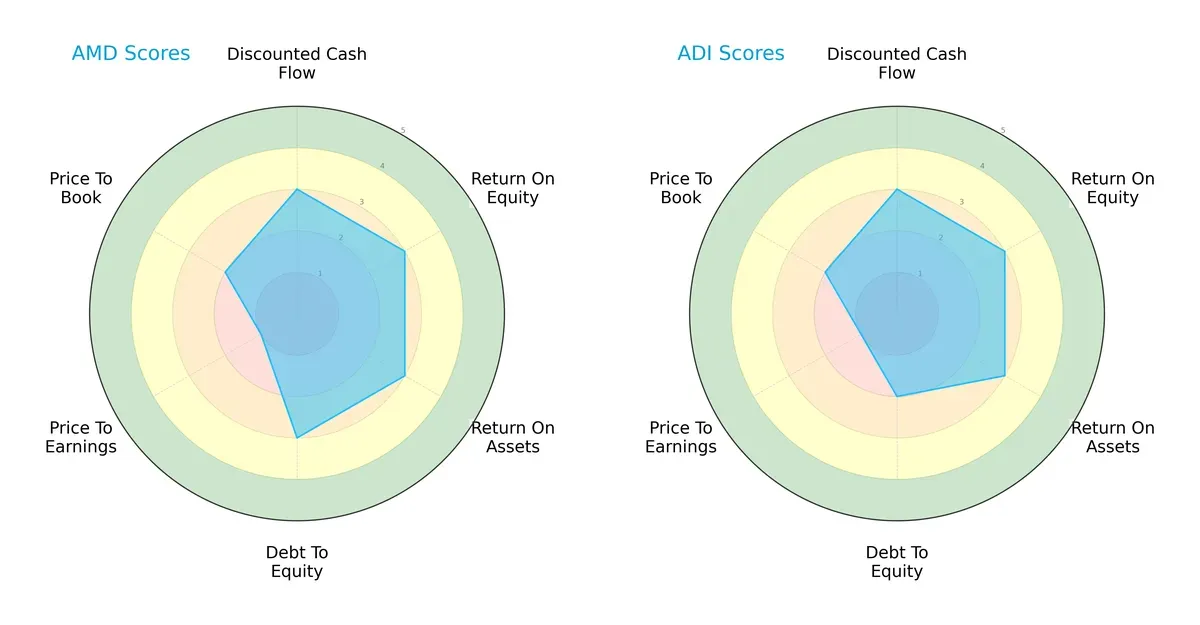
Both companies show parity in Discounted Cash Flow, Return on Equity, and Return on Assets scores, signaling solid operational efficiency. AMD edges out ADI with a better Debt-to-Equity score, indicating stronger leverage management. However, both firms suffer from very unfavorable Price-to-Earnings valuations, reflecting market skepticism or sector-wide pricing pressure. AMD presents a slightly more balanced profile overall, while ADI relies more on operational metrics than capital structure advantages.
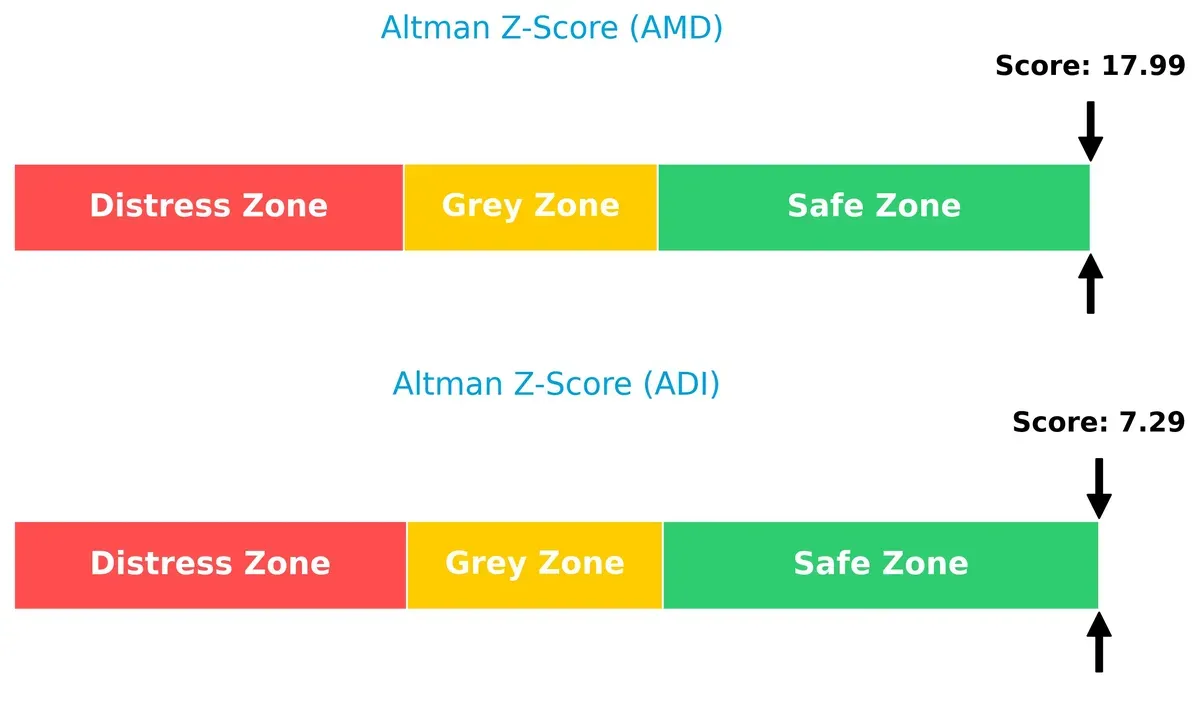
Bankruptcy Risk: Solvency Showdown
The Altman Z-Score gap between AMD (18.0) and ADI (7.3) confirms both firms remain firmly in the safe zone, although AMD’s score signals an exceptionally secure solvency position for this cycle:
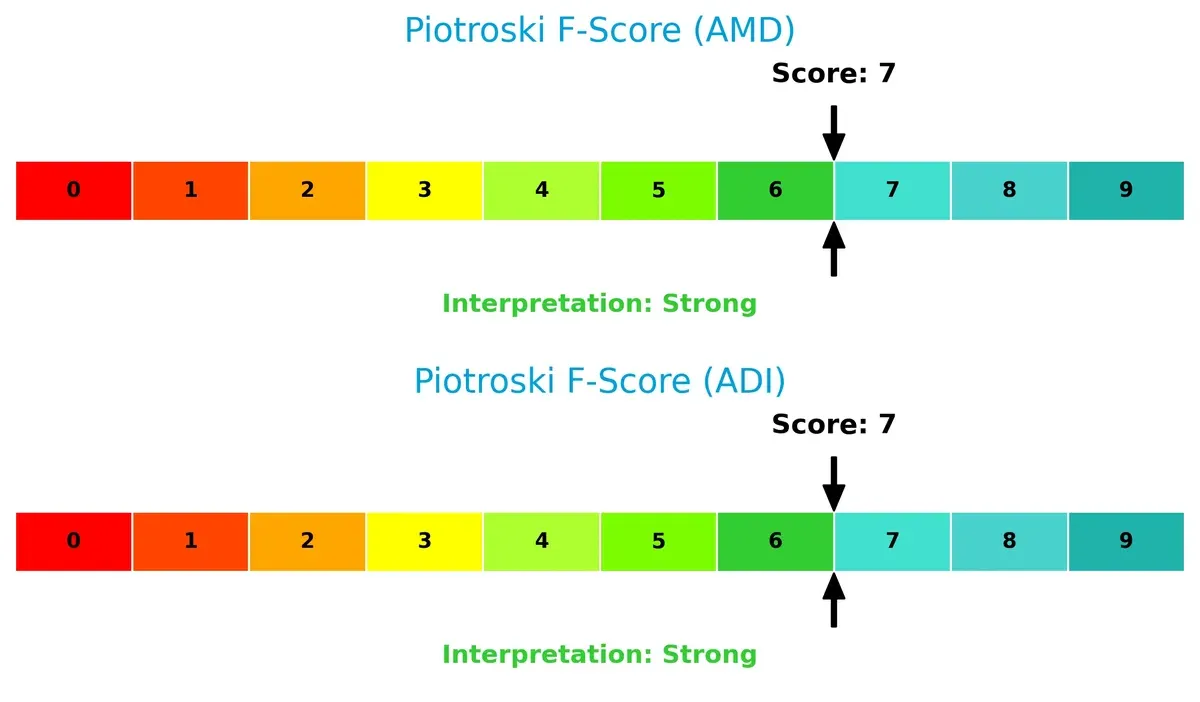
Financial Health: Quality of Operations
Both AMD and ADI score a strong 7 on the Piotroski F-Score, indicating robust financial health and operational quality with no immediate red flags in profitability, liquidity, or efficiency metrics:
How are the two companies positioned?
This section dissects AMD and ADI’s operational DNA by comparing their revenue distribution and internal strengths and weaknesses. The goal is to confront their economic moats and identify the more resilient, sustainable competitive advantage today.
Revenue Segmentation: The Strategic Mix
The following visual comparison dissects how Advanced Micro Devices, Inc. and Analog Devices, Inc. diversify their income streams and where their primary sector bets lie:
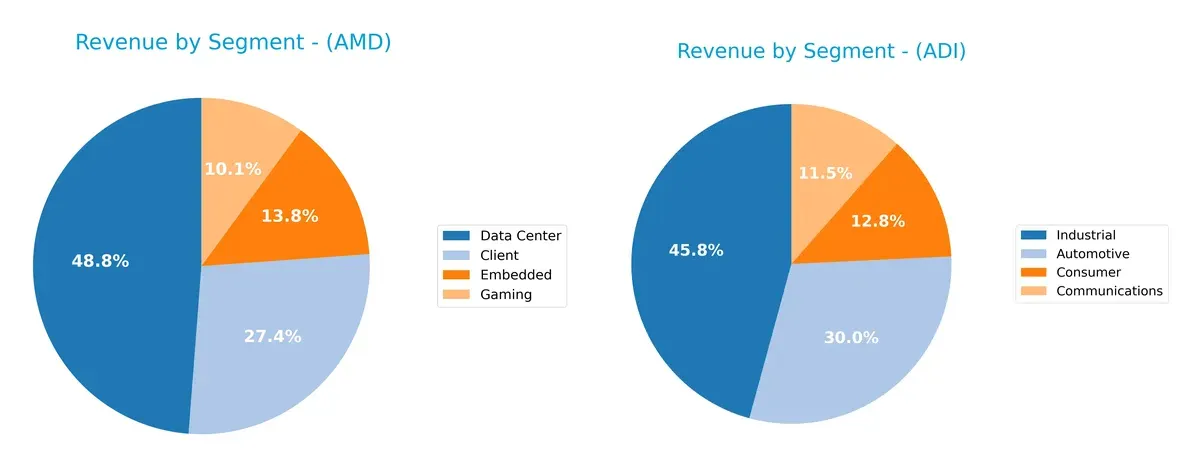
AMD’s revenue pivots heavily on Data Center at $12.6B, dwarfing its Client ($7.1B) and Embedded ($3.6B) segments. This concentration signals a strategic lock-in on cloud infrastructure and enterprise computing. Conversely, ADI maintains a more balanced portfolio with Industrial leading at $4.3B, followed by Automotive at $2.8B and Consumer near $1.2B. ADI’s mix reduces concentration risk and leverages diversified end markets, anchoring resilience across economic cycles.
Strengths and Weaknesses Comparison
This table compares the strengths and weaknesses of AMD and ADI based on diversification, profitability, financials, innovation, global presence, and market share:
AMD Strengths
- Diversified revenue across Client, Data Center, Embedded, and Gaming segments
- Favorable net margin at 12.51%
- Low debt levels and favorable debt-to-assets ratio
- Strong presence in key global markets including US, China, Singapore, Taiwan
- Significant market share in high-growth computing sectors
ADI Strengths
- Higher net margin at 20.58% and favorable liquidity ratios (current 2.19, quick 1.68)
- Favorable debt management and strong interest coverage
- Broad industrial and automotive product diversification
- Robust global footprint with balanced revenue from US, Europe, China, and Asia
- High fixed asset turnover indicating efficient use of assets
AMD Weaknesses
- Unfavorable ROE and ROIC at 0% indicating weak capital returns
- Unavailable WACC and high P/E ratio at 80.54 signal valuation concerns
- Poor liquidity ratios (current and quick ratio at 0) suggest cash flow risks
- Negative interest coverage ratio and low asset turnover hint at operational inefficiency
- No dividend yield limits income appeal
ADI Weaknesses
- Moderate ROE (6.7%) and neutral ROIC (5.55%) below WACC (8.42%)
- Unfavorable P/B ratio at 3.42 and relatively high P/E at 51.05
- Lower asset turnover at 0.23 reduces operational efficiency
- Dividend yield is low and only neutral in status, limiting income potential
Both companies demonstrate clear industrial strengths and global reach, yet differ sharply in profitability and liquidity profiles. AMD shows impressive diversification but struggles with operational efficiency and liquidity. ADI boasts stronger profitability and financial health but faces valuation and capital return challenges. These contrasts highlight distinct strategic priorities for optimizing growth and shareholder value.
The Moat Duel: Analyzing Competitive Defensibility
A structural moat is the only reliable shield that protects long-term profits from relentless competition erosion. Let’s examine the competitive moats of AMD and Analog Devices:
Advanced Micro Devices, Inc. (AMD): Innovation-Driven Chip Design Moat
AMD’s primary advantage lies in its cutting-edge processor architectures and graphics technologies. This manifests in rapid revenue growth of 34% in 2025 and expanding market penetration. However, its declining ROIC trend signals potential margin pressure, posing a risk if innovation pace slows in 2026.
Analog Devices, Inc. (ADI): Precision Analog & Mixed-Signal Integration Moat
ADI’s moat centers on high-performance analog and mixed-signal ICs, securing strong EBIT margins near 27.5%. Unlike AMD, ADI shows a growing ROIC trend, reflecting efficient capital usage and operational strength. Expansion into automotive and industrial markets may widen its moat in 2026.
Innovation Velocity vs. Operational Excellence: Who Defends Market Share Better?
AMD drives faster top-line growth through innovation but struggles with declining capital returns. ADI, while growing more modestly, improves profitability and capital efficiency. I see ADI’s deeper moat as better equipped to defend market share amid rising industry competition.
Which stock offers better returns?
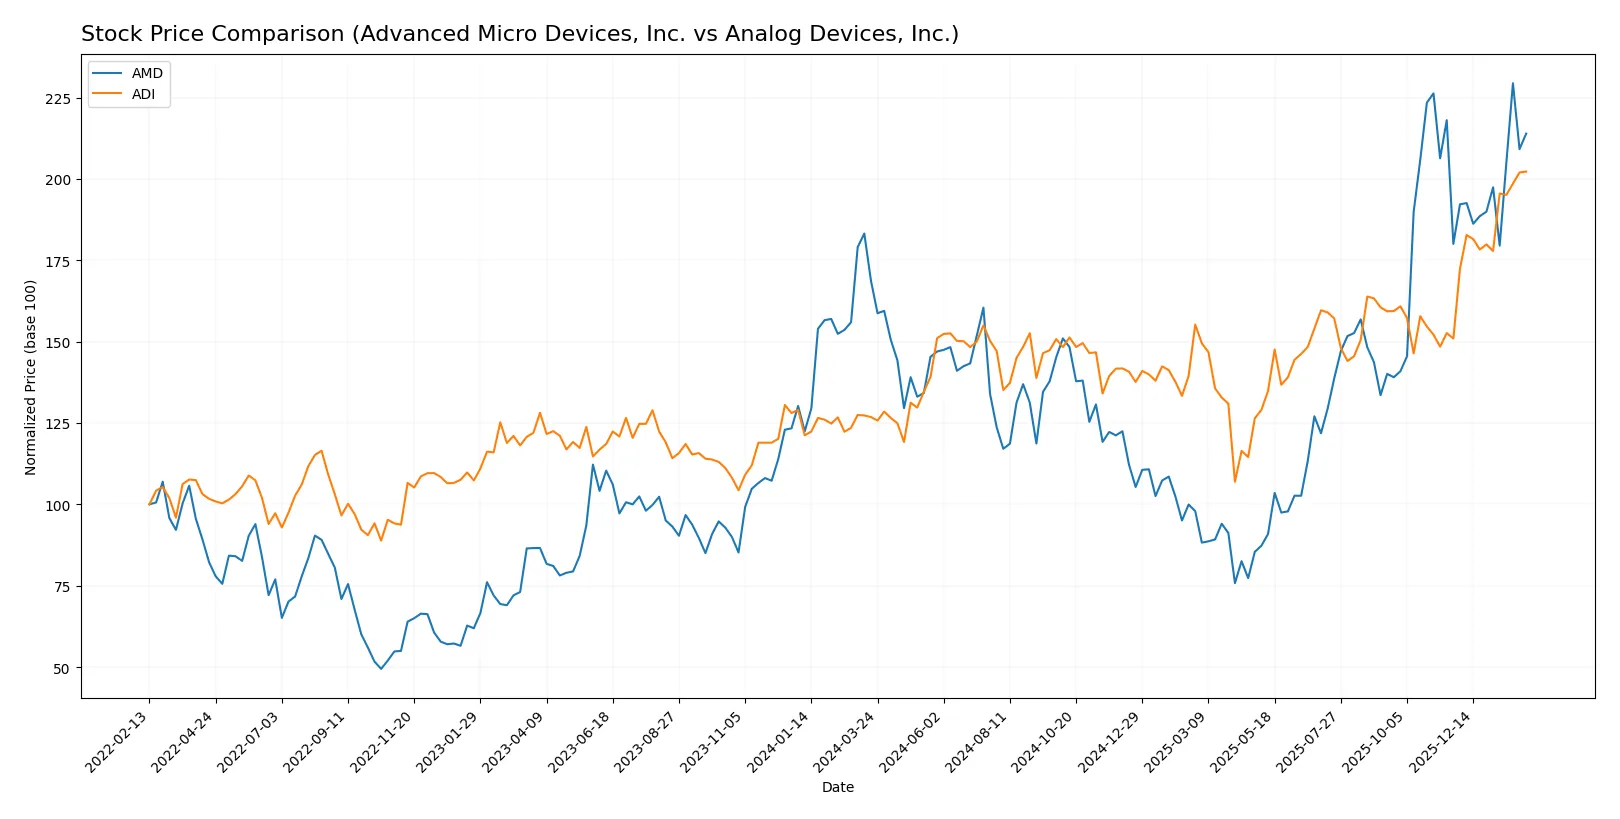
Both Advanced Micro Devices, Inc. (AMD) and Analog Devices, Inc. (ADI) showed strong bullish trends over the past year, with notable acceleration and significant price appreciation.
Trend Comparison
AMD’s stock rose 26.72% over the past 12 months, showing a bullish trend with accelerating momentum. The price ranged from 85.76 to 259.68, reflecting high volatility (std dev 41.61).
ADI’s stock increased 59.47% over the same period, also bullish with acceleration. The price fluctuated between 164.6 and 311.29, with moderate volatility (std dev 27.48).
Comparing both, ADI outperformed AMD with a 59.47% gain versus 26.72%, delivering the higher market return over the last year.
Target Prices
Analysts present a bullish consensus for both Advanced Micro Devices, Inc. and Analog Devices, Inc.
| Company | Target Low | Target High | Consensus |
|---|---|---|---|
| Advanced Micro Devices, Inc. | 225 | 380 | 291.56 |
| Analog Devices, Inc. | 270 | 375 | 316 |
The consensus targets exceed current prices, signaling positive analyst expectations. AMD trades at $242, below its $292 consensus, while ADI at $311 nears its $316 target.

Don’t Let Luck Decide Your Entry Point
Optimize your entry points with our advanced ProRealTime indicators. You’ll get efficient buy signals with precise price targets for maximum performance. Start outperforming now!
How do institutions grade them?
Here is a summary of recent institutional grades for Advanced Micro Devices, Inc. and Analog Devices, Inc.:
Advanced Micro Devices, Inc. Grades
The table below shows recent grades from major financial institutions for AMD.
| Grading Company | Action | New Grade | Date |
|---|---|---|---|
| Wells Fargo | Maintain | Overweight | 2026-01-30 |
| UBS | Maintain | Buy | 2026-01-26 |
| Piper Sandler | Maintain | Overweight | 2026-01-26 |
| Bernstein | Maintain | Market Perform | 2026-01-21 |
| Keybanc | Upgrade | Overweight | 2026-01-13 |
| Truist Securities | Maintain | Buy | 2025-12-19 |
| Cantor Fitzgerald | Maintain | Overweight | 2025-12-16 |
| Wells Fargo | Maintain | Overweight | 2025-11-12 |
| B of A Securities | Maintain | Buy | 2025-11-12 |
| Rosenblatt | Maintain | Buy | 2025-11-12 |
Analog Devices, Inc. Grades
The table below lists recent grades from key institutions for ADI.
| Grading Company | Action | New Grade | Date |
|---|---|---|---|
| Susquehanna | Maintain | Positive | 2026-01-22 |
| B of A Securities | Maintain | Buy | 2026-01-21 |
| Stifel | Maintain | Buy | 2026-01-16 |
| Oppenheimer | Maintain | Outperform | 2026-01-16 |
| Citigroup | Maintain | Buy | 2026-01-15 |
| Wells Fargo | Upgrade | Overweight | 2026-01-15 |
| Keybanc | Maintain | Overweight | 2026-01-13 |
| Truist Securities | Maintain | Hold | 2025-12-19 |
| UBS | Maintain | Buy | 2025-12-08 |
| Evercore ISI Group | Maintain | Outperform | 2025-11-26 |
Which company has the best grades?
Both AMD and ADI receive predominantly positive ratings, with many “Buy,” “Overweight,” and “Outperform” grades. AMD shows a strong consensus around “Buy” and “Overweight,” while ADI includes several “Outperform” ratings. Investors may interpret these grades as a sign of institutional confidence in both companies, though ADI’s inclusion of “Outperform” might suggest a slightly higher growth expectation.
Risks specific to each company
The following categories identify the critical pressure points and systemic threats facing both firms in the 2026 market environment:
1. Market & Competition
Advanced Micro Devices, Inc.
- Faces intense competition in high-growth GPU and CPU markets with rapid innovation cycles.
Analog Devices, Inc.
- Competes in niche analog and mixed-signal segments with steady industrial and automotive demand.
2. Capital Structure & Debt
Advanced Micro Devices, Inc.
- Favorable debt metrics but low interest coverage signals potential risks in servicing debt under stress.
Analog Devices, Inc.
- Maintains moderate leverage with strong interest coverage, supporting financial flexibility.
3. Stock Volatility
Advanced Micro Devices, Inc.
- High beta (1.949) indicates significant price swings, increasing investor risk.
Analog Devices, Inc.
- Beta near 1.0 shows relative stability versus the market benchmark.
4. Regulatory & Legal
Advanced Micro Devices, Inc.
- Subject to US and global technology export restrictions impacting semiconductor supply chains.
Analog Devices, Inc.
- Faces regulatory scrutiny mainly in automotive and industrial safety standards compliance.
5. Supply Chain & Operations
Advanced Micro Devices, Inc.
- Vulnerable to semiconductor fabrication capacity constraints and geopolitical disruptions.
Analog Devices, Inc.
- Benefits from diversified supplier base but exposed to raw material price fluctuations.
6. ESG & Climate Transition
Advanced Micro Devices, Inc.
- Under pressure to improve energy efficiency in data centers and reduce carbon footprint.
Analog Devices, Inc.
- Proactive in sustainability initiatives with focus on energy-efficient products for industrial markets.
7. Geopolitical Exposure
Advanced Micro Devices, Inc.
- Significant exposure to China-related trade tensions affecting manufacturing and sales.
Analog Devices, Inc.
- More geographically diversified revenue base, mitigating single-region geopolitical risks.
Which company shows a better risk-adjusted profile?
AMD’s biggest risk lies in its high stock volatility and fragile interest coverage amid intense competition. ADI faces moderate leverage but benefits from operational stability and lower volatility. ADI’s stronger liquidity and more stable market position support a better risk-adjusted profile. The widening beta gap and AMD’s unfavorable interest coverage underscore my heightened concern for AMD’s risk exposure in 2026.
Final Verdict: Which stock to choose?
Advanced Micro Devices, Inc. (AMD) wields an impressive growth engine fueled by dynamic innovation and aggressive R&D spending. Its superpower lies in rapid market share gains and revenue acceleration. However, a declining return on invested capital signals a point of vigilance. AMD suits an aggressive growth portfolio comfortable with volatility.
Analog Devices, Inc. (ADI) boasts a strategic moat rooted in steady recurring revenue and strong operational cash flow. Its safety profile surpasses AMD’s, with healthier margins and more stable capital allocation despite modest ROIC challenges. ADI fits well within a GARP (Growth at a Reasonable Price) portfolio seeking balance between growth and financial resilience.
If you prioritize high-growth potential and are willing to accept execution risks, AMD is the compelling choice due to its innovation momentum and market expansion. However, if you seek better stability and consistent profitability, ADI offers superior financial discipline and a more durable operational moat. Both names command attention but cater to distinct investor profiles.
Disclaimer: Investment carries a risk of loss of initial capital. The past performance is not a reliable indicator of future results. Be sure to understand risks before making an investment decision.
Go Further
I encourage you to read the complete analyses of Advanced Micro Devices, Inc. and Analog Devices, Inc. to enhance your investment decisions: