Home > Comparison > Technology > AMD vs AMBA
The strategic rivalry between Advanced Micro Devices, Inc. (AMD) and Ambarella, Inc. shapes the semiconductor industry’s future. AMD operates as a diversified technology heavyweight with broad computing and graphics solutions. Ambarella, by contrast, focuses on specialized video processing chips with AI capabilities. This analysis contrasts their growth models to identify which trajectory offers superior risk-adjusted returns for a balanced portfolio amid evolving tech demands.

Table of contents
Companies Overview
Advanced Micro Devices, Inc. and Ambarella, Inc. both drive innovation in the semiconductor industry with distinct market roles.
Advanced Micro Devices, Inc.: Semiconductor Powerhouse
AMD dominates as a global semiconductor company focusing on high-performance processors and graphics solutions. Its revenue stems from CPUs and GPUs for PCs, servers, and consoles. In 2026, AMD emphasizes expanding its data center presence and enhancing chip performance to capture growing cloud and AI workloads.
Ambarella, Inc.: Vision Processing Innovator
Ambarella specializes in semiconductor solutions for video compression and AI-powered image processing. It monetizes through system-on-chip designs serving automotive, security, and consumer cameras. The firm’s 2026 strategy targets autonomous vehicle systems and smart camera technologies, leveraging AI for advanced driver assistance and visual analytics.
Strategic Collision: Similarities & Divergences
Both firms excel in semiconductor innovation but diverge sharply: AMD pursues broad computing platforms while Ambarella focuses on specialized video and AI chips. They compete indirectly in AI-driven markets, with AMD targeting cloud computing and Ambarella carving out niche intelligent vision. Their investment profiles contrast: AMD stands as a large-cap growth leader; Ambarella operates as a nimble specialist in embedded AI.
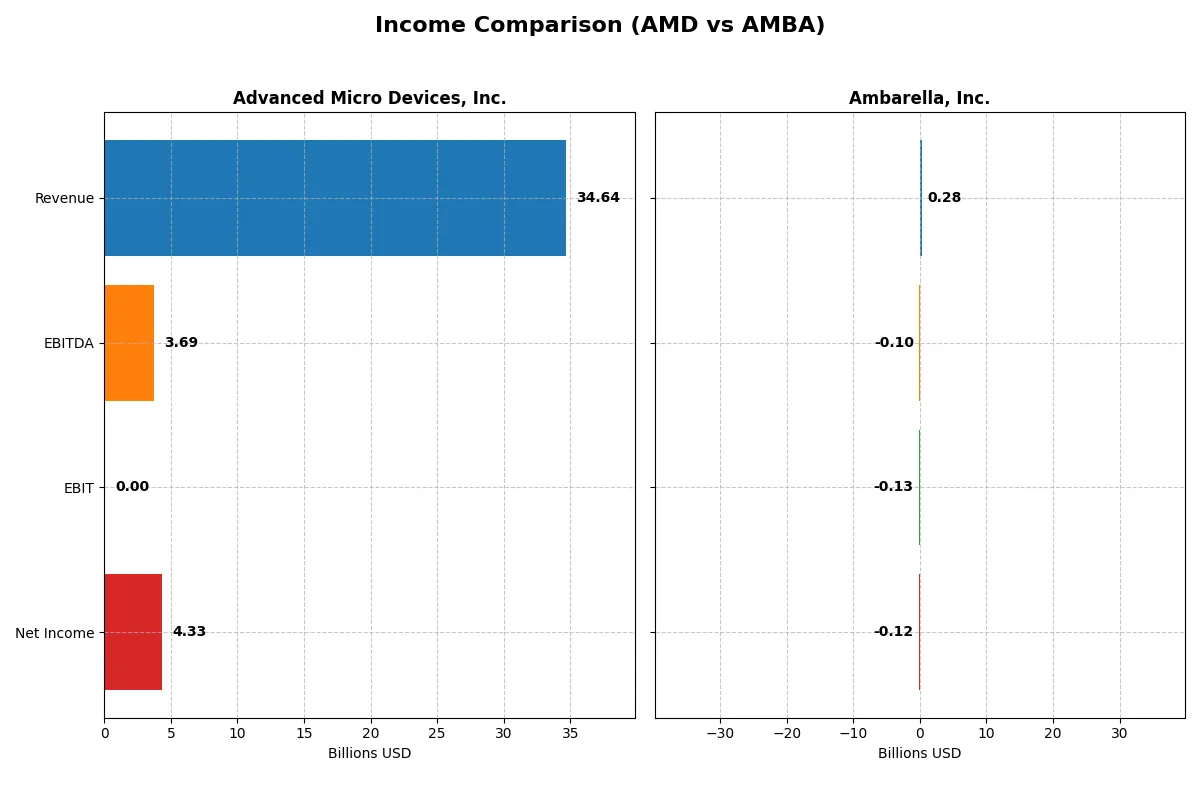
Income Statement Comparison
This data dissects the core profitability and scalability of both corporate engines to reveal who dominates the bottom line:
| Metric | Advanced Micro Devices, Inc. (AMD) | Ambarella, Inc. (AMBA) |
|---|---|---|
| Revenue | 34.6B | 285M |
| Cost of Revenue | 17.5B | 113M |
| Operating Expenses | 13.5B | 299M |
| Gross Profit | 17.2B | 172M |
| EBITDA | 3.7B | -101M |
| EBIT | 3.7B | -127M |
| Interest Expense | 131M | 0 |
| Net Income | 4.3B | -117M |
| EPS | 2.67 | -2.84 |
| Fiscal Year | 2025 | 2025 |
Income Statement Analysis: The Bottom-Line Duel
This income statement comparison reveals which company operates with greater efficiency and delivers stronger bottom-line results.
Advanced Micro Devices, Inc. Analysis
AMD’s revenue surged from $16.4B in 2021 to $34.6B in 2025, showcasing robust growth. Net income nearly doubled from $3.16B to $4.33B, reflecting improved profitability. Gross margin remains strong at 49.5%, indicating efficient production. Despite a dip in EBIT margin, net margin stands healthy at 12.5%, showing solid operational momentum in 2025.
Ambarella, Inc. Analysis
Ambarella’s revenue grew moderately by 25.8% year-over-year to $285M in 2025, but net income remains deeply negative at -$117M. The company boasts a high gross margin of 60.5%, yet its EBIT margin plummets to -44.4%, underscoring operational losses. Although recent margin improvements suggest some efficiency gains, persistent net losses highlight ongoing challenges.
Margin Strength vs. Profit Scale
AMD outpaces Ambarella with significantly higher revenue and positive net income, reflecting superior scale and profitability. Ambarella’s elevated gross margin contrasts with its steep losses, emphasizing growth without profit. For investors, AMD’s proven ability to convert revenue into earnings offers a more attractive and stable financial profile.
Financial Ratios Comparison
These vital ratios act as a diagnostic tool to expose the underlying fiscal health, valuation premiums, and capital efficiency of the companies compared below:
| Ratios | Advanced Micro Devices, Inc. (AMD) | Ambarella, Inc. (AMBA) |
|---|---|---|
| ROE | 2.85% (2024) | -20.86% (2025) |
| ROIC | 2.49% (2024) | -21.96% (2025) |
| P/E | 124 (2024) | -27.05 (2025) |
| P/B | 3.52 (2024) | 5.64 (2025) |
| Current Ratio | 2.62 (2024) | 2.65 (2025) |
| Quick Ratio | 1.83 (2024) | 2.36 (2025) |
| D/E | 0.038 (2024) | 0.009 (2025) |
| Debt-to-Assets | 3.20% (2024) | 0.76% (2025) |
| Interest Coverage | 20.65 (2024) | 0 (2025) |
| Asset Turnover | 0.37 (2024) | 0.41 (2025) |
| Fixed Asset Turnover | 10.63 (2024) | 19.96 (2025) |
| Payout ratio | 0% (2024) | 0% (2025) |
| Dividend yield | 0% (2024) | 0% (2025) |
| Fiscal Year | 2024 | 2025 |
Efficiency & Valuation Duel: The Vital Signs
Ratios act as a company’s DNA, uncovering hidden risks and operational strengths that raw numbers alone cannot reveal.
Advanced Micro Devices, Inc.
AMD shows a favorable net margin of 12.51%, indicating operational efficiency despite a zero ROE and ROIC, signaling weak profitability. The stock trades at a stretched P/E of 80.54, suggesting high market expectations. AMD offers no dividends, focusing on reinvestment in R&D, which accounts for 25% of revenue, aiming to fuel growth.
Ambarella, Inc.
Ambarella suffers from a deeply negative net margin of -41.12% and ROE of -20.86%, reflecting profitability challenges. Its P/E is negative, technically “favorable,” but likely due to losses, while a high P/B of 5.64 points to overvaluation. The company also pays no dividend, investing heavily in R&D at nearly 80% of revenue to drive turnaround.
Profitability Strength vs. Valuation Stretch
AMD balances operational efficiency with a high valuation, while Ambarella struggles with losses despite heavy R&D investment. AMD’s profile suits investors seeking growth backed by operational strength. Ambarella fits those willing to accept elevated risk for potential recovery.
Which one offers the Superior Shareholder Reward?
I observe that neither AMD nor Ambarella pays dividends, focusing instead on reinvestment and buybacks. AMD’s free cash flow per share stands at 3.4 in 2025, significantly higher than Ambarella’s 0.57. AMD’s payout via buybacks is more intense and sustainable, supported by strong operating cash flow and capital expenditure coverage ratios above 4. Ambarella’s negative margins and volatile earnings weaken its buyback capacity. Historically in tech, consistent free cash flow and prudent buybacks drive superior total returns. Therefore, I conclude AMD offers a more attractive and sustainable total shareholder reward in 2026.
Comparative Score Analysis: The Strategic Profile
The radar chart reveals the fundamental DNA and trade-offs of Advanced Micro Devices, Inc. (AMD) and Ambarella, Inc. (AMBA), highlighting their financial strengths and vulnerabilities:
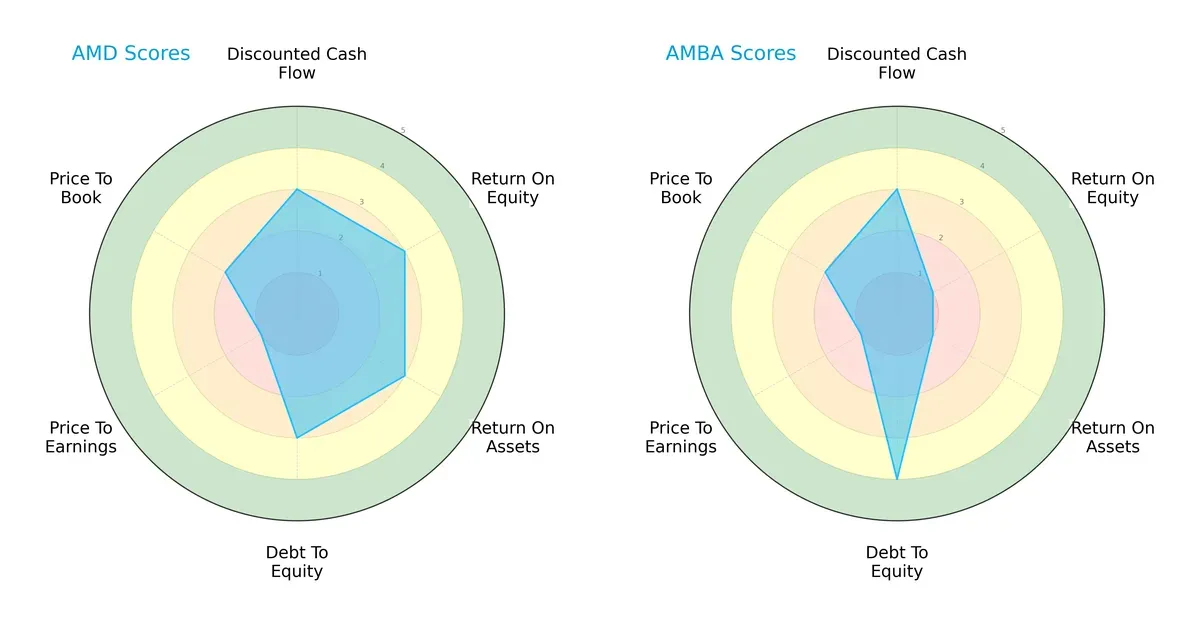
AMD presents a more balanced profile, scoring moderately across DCF, ROE, ROA, and Debt/Equity metrics. AMBA relies heavily on a favorable Debt/Equity score but lags significantly in ROE and ROA, indicating weaker profitability and asset efficiency. Both share low valuation scores, signaling market caution.
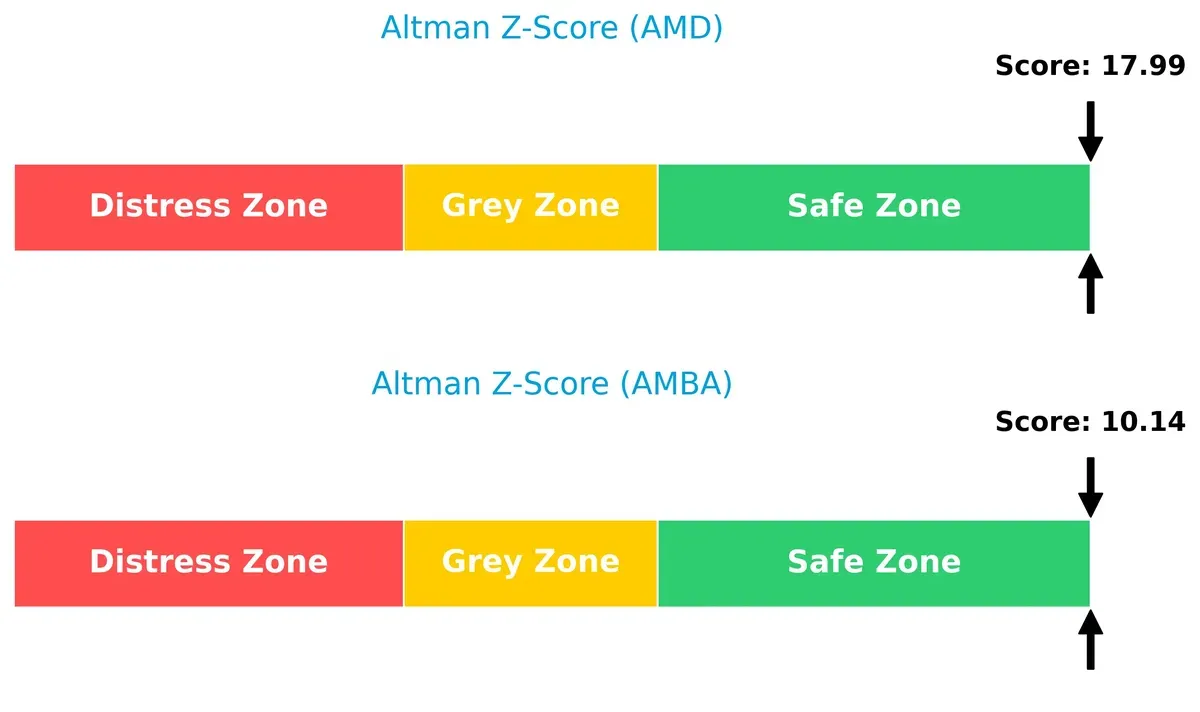
Bankruptcy Risk: Solvency Showdown
AMD’s Altman Z-Score of 18 vastly exceeds AMBA’s 10, placing both safely above distress thresholds but underscoring AMD’s superior solvency and lower bankruptcy risk in this cycle:
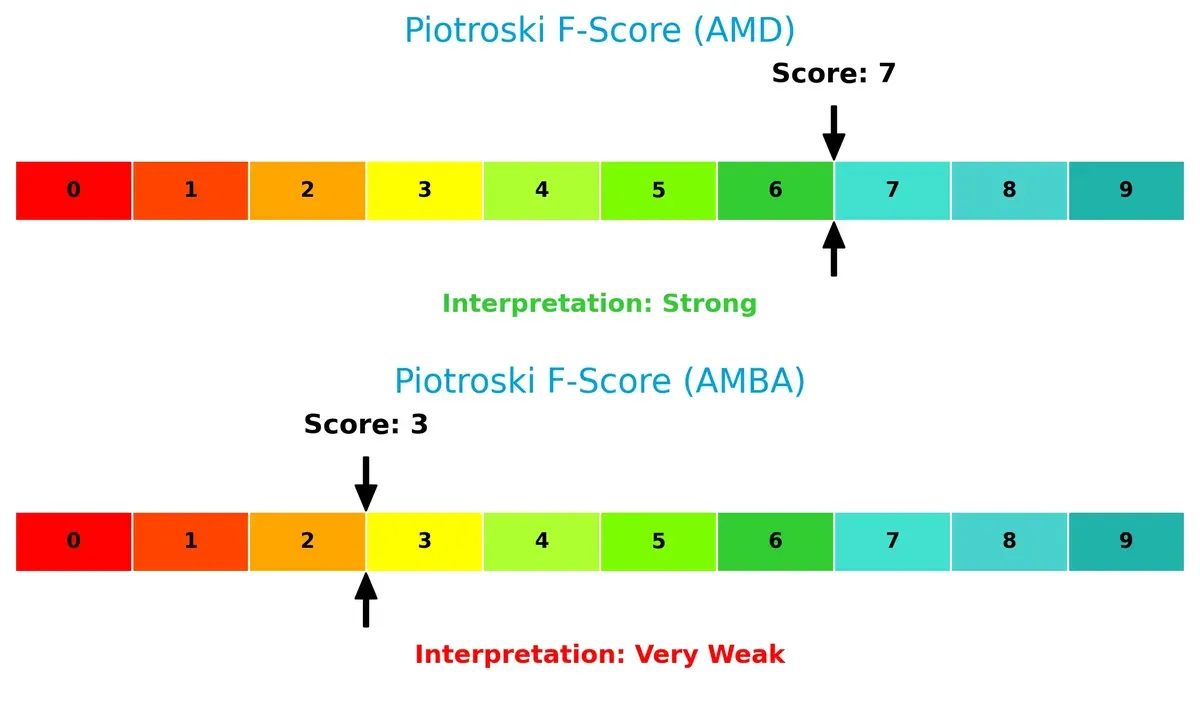
Financial Health: Quality of Operations
AMD’s Piotroski F-Score of 7 indicates strong financial health and operational quality. AMBA’s score of 3 raises red flags, suggesting underlying internal weaknesses and less reliable fundamentals:
How are the two companies positioned?
This section dissects AMD and AMBA’s operational DNA by comparing revenue distribution and internal dynamics. The goal is to confront their economic moats to identify the most resilient competitive advantage today.
Revenue Segmentation: The Strategic Mix
This comparison dissects how Advanced Micro Devices, Inc. and Ambarella, Inc. diversify their income streams and where their primary sector bets lie:
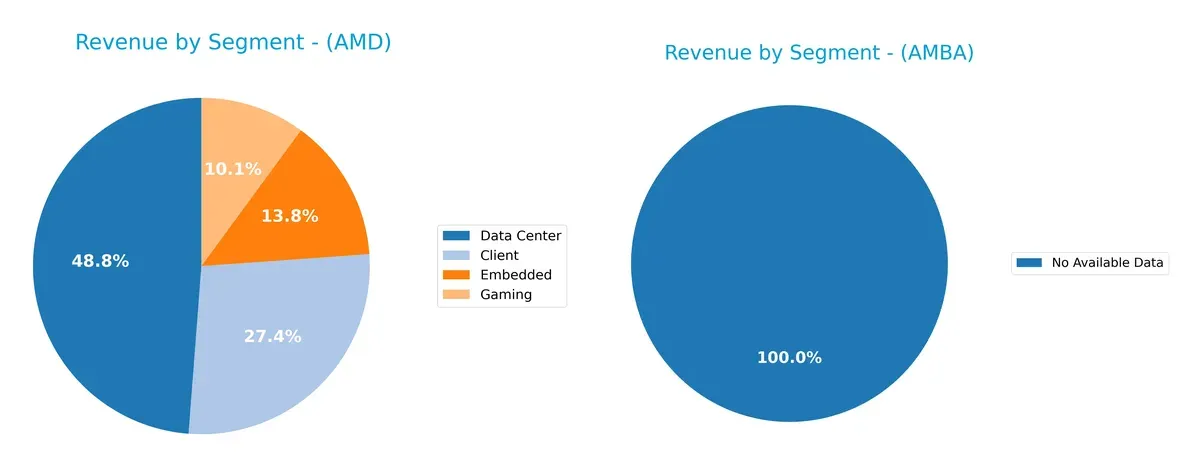
AMD’s 2024 revenue splits across Client $7.1B, Data Center $12.6B, Embedded $3.6B, and Gaming $2.6B. Ambarella lacks segment data, precluding direct comparison. AMD’s diversified portfolio pivots on a dominant Data Center segment, anchoring growth and ecosystem lock-in. Its broad mix mitigates concentration risk, unlike a single-segment dependency. This multi-pronged strategy strengthens AMD’s infrastructure dominance amid evolving tech cycles.
Strengths and Weaknesses Comparison
This table compares the Strengths and Weaknesses of AMD and Ambarella based on diversification, profitability, financials, innovation, global presence, and market share:
AMD Strengths
- Diversified revenue streams across Client, Data Center, Embedded, and Gaming segments
- Favorable net margin at 12.51%
- Low debt-to-assets ratio indicating strong balance sheet discipline
- Significant global sales including US, China, and Singapore
- Large market presence with high revenues in multiple regions
Ambarella Strengths
- Strong liquidity with current and quick ratios above 2.3
- Very low debt-to-assets ratio enhances financial stability
- Favorable fixed asset turnover at 19.96 indicating operational efficiency
- Presence in Asia Pacific, Taiwan, and Europe markets
- Reasonably diversified geographic footprint despite smaller scale
AMD Weaknesses
- Unfavorable ROE and ROIC at zero, signaling weak capital efficiency
- High P/E ratio at 80.54, possibly overvalued
- Poor current and quick ratios at 0, raising liquidity concerns
- Negative interest coverage ratio
- Asset turnover metrics unfavorable, challenging operational leverage
- No dividend yield reflecting lack of shareholder return
Ambarella Weaknesses
- Negative net margin (-41.12%) and negative ROE and ROIC show profitability struggles
- WACC at 12.97% is relatively high, pressuring returns
- Unfavorable PE and PB ratios suggest valuation concerns
- Interest coverage ratio at zero indicates financial risk
- Asset turnover of 0.41 is modest, limiting revenue generation efficiency
- No dividend yield, limiting income appeal
Overall, AMD shows strong diversification and profitability but struggles with capital efficiency and liquidity, which may affect its operational flexibility. Ambarella maintains good liquidity and asset efficiency but faces significant profitability and valuation challenges. These factors shape each company’s strategic focus on balancing growth with financial health.
The Moat Duel: Analyzing Competitive Defensibility
A structural moat guards long-term profits from competitive erosion. Without it, market gains quickly vanish:
Advanced Micro Devices, Inc. (AMD): Innovation and Scale Moat
AMD’s competitive edge lies in its cutting-edge processor technology and broad product scope. This drives high gross margins near 50% and robust revenue growth above 30%. Expansion into data centers and gaming GPUs promises to deepen its moat in 2026.
Ambarella, Inc. (AMBA): Niche AI-Driven Semiconductor Moat
Ambarella relies on specialized AI video processing chips, contrasting AMD’s scale. Despite strong gross margins above 60%, it struggles with profitability and declining ROIC. Growth in automotive and security cameras offers upside but sustainability remains uncertain.
Moat Strength: Scale Innovation vs. Niche Specialization
AMD’s wider moat stems from technology leadership and market breadth, reflected in stable margin and revenue expansion. Ambarella’s narrow moat is challenged by shrinking profitability and value destruction. AMD is better positioned to defend and grow market share.
Which stock offers better returns?
The past year shows distinct price dynamics: AMD surged with accelerating gains, while Ambarella posted strong yearly growth but recent declines.
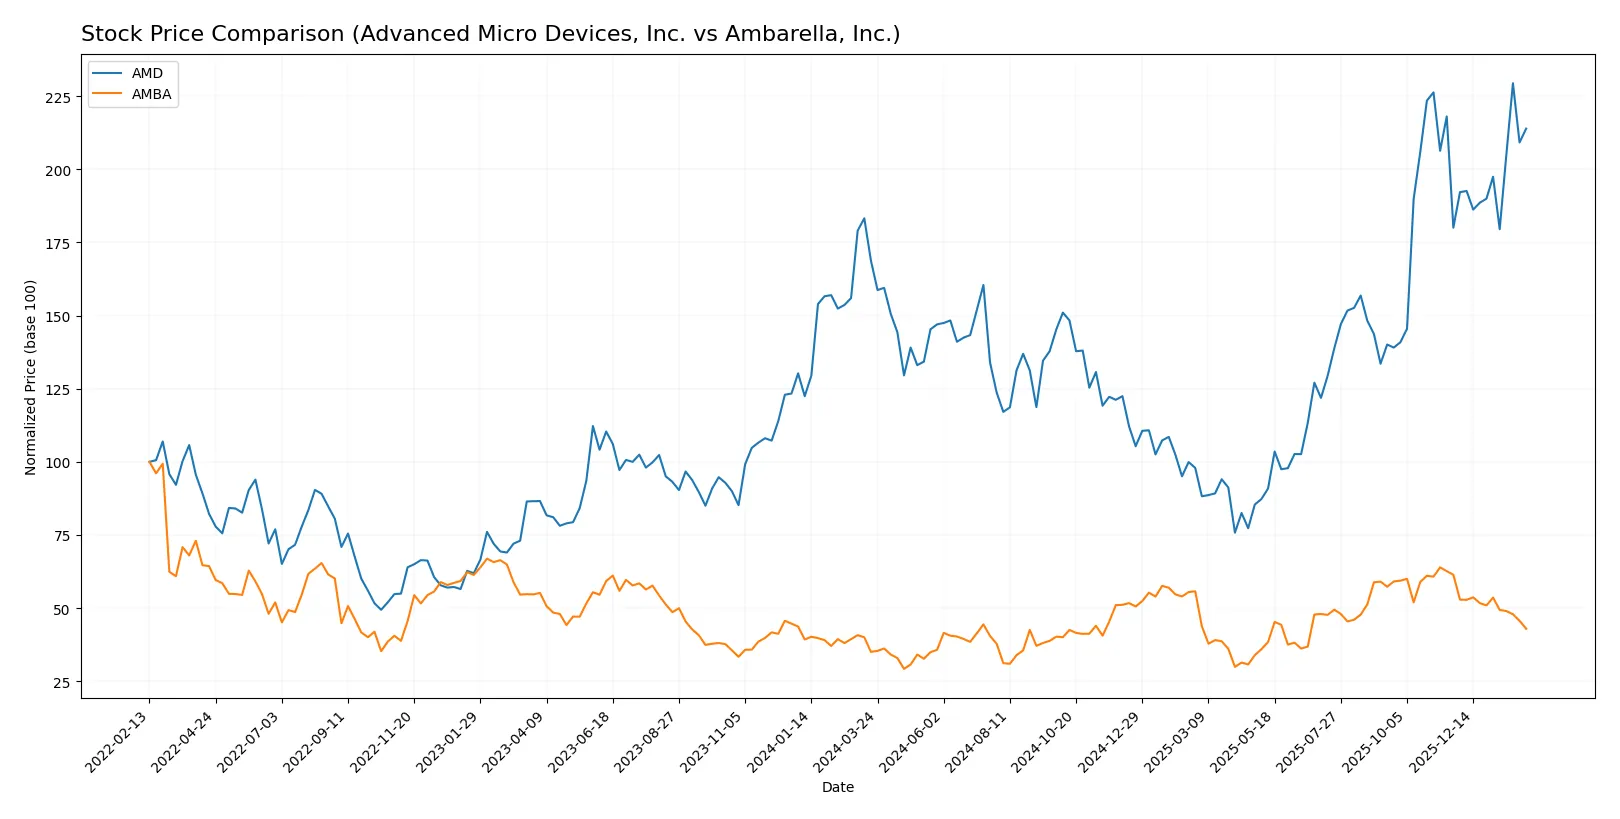
Trend Comparison
Advanced Micro Devices, Inc. (AMD) experienced a bullish trend with a 26.72% price increase over 12 months, showing acceleration and a high volatility of 41.61%.
Ambarella, Inc. (AMBA) also followed a bullish trend, rising 22.54% over the year but with deceleration and lower volatility of 12.78%. Recent months showed a sharp 30.08% decline.
AMD outperformed AMBA over the full year with a higher price gain and accelerating momentum, despite AMBA’s recent weakness and decelerating trend.
Target Prices
Analysts present a bullish consensus on Advanced Micro Devices, Inc. and Ambarella, Inc.
| Company | Target Low | Target High | Consensus |
|---|---|---|---|
| Advanced Micro Devices, Inc. | 225 | 380 | 291.56 |
| Ambarella, Inc. | 80 | 115 | 97.5 |
The consensus target for AMD trades roughly 20% above its current price of 242.11, signaling significant upside potential. Ambarella’s target consensus implies a near 62% premium over its 60.23 market price, reflecting strong analyst optimism.

Don’t Let Luck Decide Your Entry Point
Optimize your entry points with our advanced ProRealTime indicators. You’ll get efficient buy signals with precise price targets for maximum performance. Start outperforming now!
How do institutions grade them?
Advanced Micro Devices, Inc. Grades
The table below shows recent grades from well-known financial institutions for AMD.
| Grading Company | Action | New Grade | Date |
|---|---|---|---|
| Wells Fargo | maintain | Overweight | 2026-01-30 |
| Piper Sandler | maintain | Overweight | 2026-01-26 |
| UBS | maintain | Buy | 2026-01-26 |
| Bernstein | maintain | Market Perform | 2026-01-21 |
| Keybanc | upgrade | Overweight | 2026-01-13 |
| Truist Securities | maintain | Buy | 2025-12-19 |
| Cantor Fitzgerald | maintain | Overweight | 2025-12-16 |
| Morgan Stanley | maintain | Equal Weight | 2025-11-12 |
| Wedbush | maintain | Outperform | 2025-11-12 |
| Rosenblatt | maintain | Buy | 2025-11-12 |
Ambarella, Inc. Grades
This table summarizes ratings from verified institutions covering Ambarella, Inc.
| Grading Company | Action | New Grade | Date |
|---|---|---|---|
| B of A Securities | maintain | Neutral | 2025-11-26 |
| Rosenblatt | maintain | Buy | 2025-11-26 |
| Stifel | maintain | Buy | 2025-11-26 |
| Needham | maintain | Buy | 2025-11-26 |
| Rosenblatt | maintain | Buy | 2025-11-24 |
| B of A Securities | maintain | Neutral | 2025-08-29 |
| Northland Capital Markets | maintain | Outperform | 2025-08-29 |
| Morgan Stanley | maintain | Overweight | 2025-08-29 |
| Oppenheimer | maintain | Perform | 2025-08-29 |
| Rosenblatt | maintain | Buy | 2025-08-29 |
Which company has the best grades?
AMD generally holds stronger grades, including multiple “Buy” and “Overweight” ratings from top firms. Ambarella shows solid “Buy” ratings but more “Neutral” and “Perform” grades. Investors may see AMD as favored by analysts.
Risks specific to each company
The following categories identify the critical pressure points and systemic threats facing both firms in the 2026 market environment:
1. Market & Competition
Advanced Micro Devices, Inc.
- Operates in a highly competitive semiconductor sector dominated by large peers like Intel and Nvidia.
Ambarella, Inc.
- Faces niche competition in video processing chips but limited scale compared to larger semiconductor companies.
2. Capital Structure & Debt
Advanced Micro Devices, Inc.
- Demonstrates a conservative debt profile with favorable debt-to-equity and debt-to-assets ratios.
Ambarella, Inc.
- Maintains minimal debt levels, showing strong liquidity with current and quick ratios above 2.0.
3. Stock Volatility
Advanced Micro Devices, Inc.
- High beta (~1.95) indicating sensitivity to tech sector swings and market cycles.
Ambarella, Inc.
- Similar beta (~1.94) suggests comparable exposure to market volatility and cyclical risks.
4. Regulatory & Legal
Advanced Micro Devices, Inc.
- Subject to global semiconductor export controls and intellectual property litigation risks.
Ambarella, Inc.
- Faces regulatory scrutiny linked to AI and video surveillance technology exports and data privacy laws.
5. Supply Chain & Operations
Advanced Micro Devices, Inc.
- Relies on complex global supply chains vulnerable to geopolitical tensions and chip shortages.
Ambarella, Inc.
- Smaller scale supply chain, but still exposed to semiconductor manufacturing and component sourcing risks.
6. ESG & Climate Transition
Advanced Micro Devices, Inc.
- Increasing focus on energy efficiency in products and operations, with moderate ESG initiatives.
Ambarella, Inc.
- Emerging efforts in sustainability but limited disclosure and measurable climate impact strategies.
7. Geopolitical Exposure
Advanced Micro Devices, Inc.
- Significant exposure to US-China tensions affecting semiconductor trade and technology transfer.
Ambarella, Inc.
- Some exposure to geopolitical risks through global customers and supply chains, but less direct than AMD.
Which company shows a better risk-adjusted profile?
AMD’s largest risk lies in fierce market competition and its stretched valuation (PE of 80.54). Ambarella suffers from severe profitability weaknesses and limited scale but benefits from a stronger liquidity buffer. AMD’s Altman Z-Score and Piotroski Score signal stronger financial stability. Despite AMD’s valuation risk, its diversified operations and capital structure give it a superior risk-adjusted profile for 2026. Ambarella’s negative margins and weak ROE highlight deeper operational challenges, raising caution for investors amid market uncertainties.
Final Verdict: Which stock to choose?
Advanced Micro Devices, Inc. (AMD) stands out as a cash-generating powerhouse with robust revenue growth and strong income quality. Its main point of vigilance lies in a declining return on invested capital, signaling potential efficiency challenges ahead. AMD fits well in an Aggressive Growth portfolio seeking market leadership in semiconductors.
Ambarella, Inc. (AMBA) offers a niche strategic moat through its specialized R&D focus and solid current liquidity. Relative to AMD, AMBA presents a more cautious safety profile but struggles with profitability and value destruction. It aligns better with a GARP portfolio that values potential turnaround opportunities over immediate returns.
If you prioritize scalable growth with proven cash flow, AMD is the compelling choice due to its dominant market position and favorable income trends. However, if you seek speculative exposure with a focus on innovation and recovery potential, AMBA offers better stability in liquidity but commands a premium on risk. Both warrant careful risk management given their distinct financial profiles.
Disclaimer: Investment carries a risk of loss of initial capital. The past performance is not a reliable indicator of future results. Be sure to understand risks before making an investment decision.
Go Further
I encourage you to read the complete analyses of Advanced Micro Devices, Inc. and Ambarella, Inc. to enhance your investment decisions: