Home > Comparison > Technology > ADBE vs ZS
The strategic rivalry between Adobe Inc. and Zscaler, Inc. shapes the evolving landscape of technology infrastructure software. Adobe operates as a diversified software powerhouse with a broad portfolio spanning digital media and experience, while Zscaler focuses exclusively on cloud security solutions. This head-to-head contrasts a mature, cash-generative business against a high-growth specialist. My analysis aims to identify which trajectory offers superior risk-adjusted returns for a balanced, diversified portfolio in 2026.
Table of contents
Companies Overview
Adobe Inc. and Zscaler, Inc. stand as pivotal players in the software infrastructure market, each commanding significant market positions.
Adobe Inc.: Creative and Experience Software Powerhouse
Adobe dominates as a diversified software company focusing on Digital Media and Experience. Its core revenue engine is the Creative Cloud subscription, enabling content creation and management for enterprises and individuals. In 2026, Adobe prioritizes enhancing its integrated platform to optimize customer experiences across marketing, analytics, and commerce.
Zscaler, Inc.: Cloud Security Innovator
Zscaler leads as a cloud security specialist delivering secure access to SaaS and private cloud applications. Its primary revenue driver is the Zscaler Internet Access and Private Access platforms, which protect users and workloads globally. The company’s 2026 strategy centers on expanding digital experience monitoring and workload segmentation to mitigate cybersecurity risks.
Strategic Collision: Similarities & Divergences
Adobe and Zscaler pursue contrasting philosophies: Adobe invests in a broad ecosystem for content and customer experience, while Zscaler focuses on a specialized cloud security infrastructure. Their primary battleground is enterprise cloud adoption—Adobe in creative and marketing workflows, Zscaler in secure connectivity. These distinct focuses yield divergent investment profiles: Adobe leverages scale and diversification, Zscaler bets on cybersecurity specialization and innovation.
Income Statement Comparison
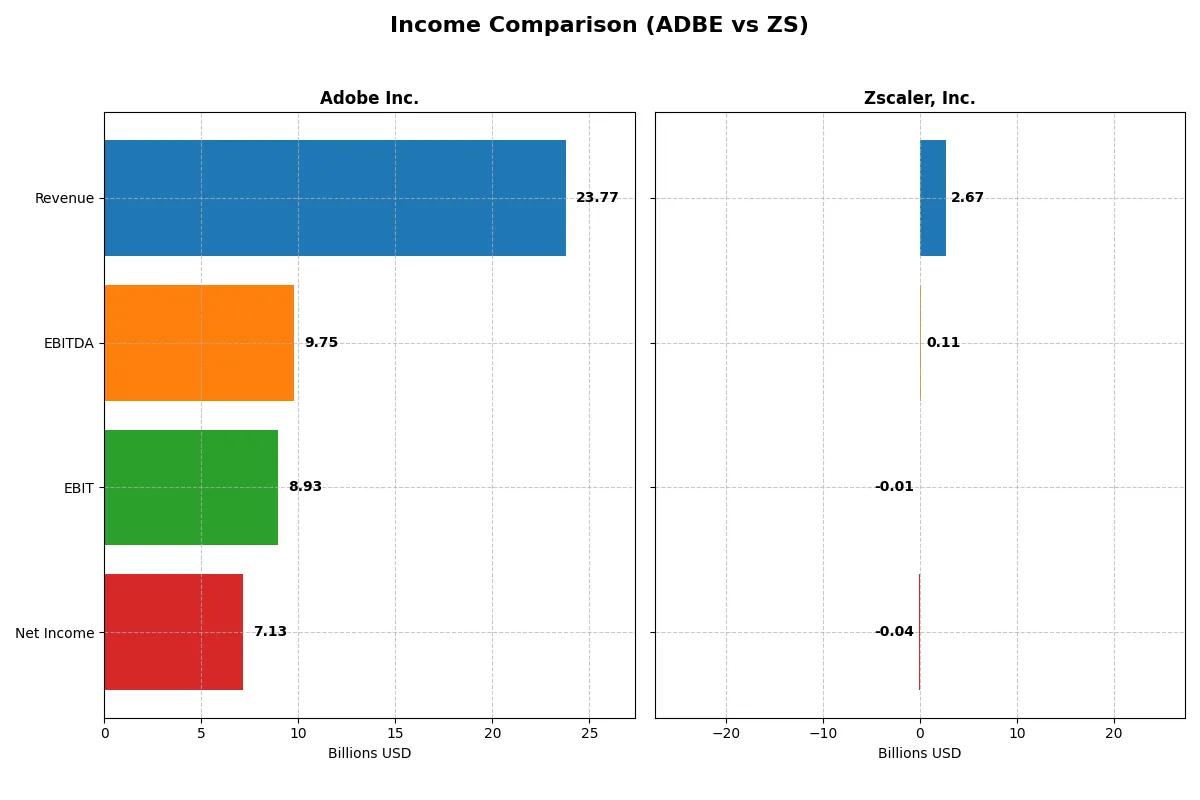
The following data dissects the core profitability and scalability of both corporate engines to reveal who dominates the bottom line:
| Metric | Adobe Inc. (ADBE) | Zscaler, Inc. (ZS) |
|---|---|---|
| Revenue | 23.8B | 2.67B |
| Cost of Revenue | 2.71B | 618M |
| Operating Expenses | 12.4B | 2.18B |
| Gross Profit | 21.1B | 2.05B |
| EBITDA | 9.75B | 112M |
| EBIT | 8.93B | -8.77M |
| Interest Expense | 263M | 9.52M |
| Net Income | 7.13B | -41.5M |
| EPS | 16.73 | -0.27 |
| Fiscal Year | 2025 | 2025 |
Income Statement Analysis: The Bottom-Line Duel
This income statement comparison reveals the true efficiency and profitability of each company’s business engine over recent years.
Adobe Inc. Analysis
Adobe’s revenue consistently climbs, reaching $23.8B in 2025, with net income hitting $7.13B. The company maintains a robust gross margin of 88.6% and a strong net margin of 30%. In 2025, Adobe accelerates EBIT growth by 25.8%, showcasing exceptional operational efficiency and expanding profitability momentum.
Zscaler, Inc. Analysis
Zscaler’s revenue surges 23.3% to $2.67B in 2025, reflecting rapid scaling. However, the company remains unprofitable with a negative net margin of -1.55% despite a gross margin of 76.9%. The sharp improvement in EBIT by 45.7% signals operational progress but does not yet translate into positive net income.
Verdict: Efficiency and Profitability vs. Growth and Scaling
Adobe dominates in profitability and margin strength, demonstrating efficient capital allocation and consistent income growth. Zscaler impresses with explosive revenue and earnings growth but still struggles to convert scale into net profits. For investors prioritizing stable profits, Adobe’s profile stands out as more attractive.
Financial Ratios Comparison
These vital ratios act as a diagnostic tool to expose the underlying fiscal health, valuation premiums, and capital efficiency of the companies compared below:
| Ratios | Adobe Inc. (ADBE) | Zscaler, Inc. (ZS) |
|---|---|---|
| ROE | 61.3% | -2.3% |
| ROIC | 36.7% | -3.2% |
| P/E | 19.1 | -1063.0 |
| P/B | 11.7 | 24.5 |
| Current Ratio | 1.0 | 2.0 |
| Quick Ratio | 1.0 | 2.0 |
| D/E | 0.57 | 1.00 |
| Debt-to-Assets | 22.5% | 28.0% |
| Interest Coverage | 33.1 | -13.5 |
| Asset Turnover | 0.81 | 0.42 |
| Fixed Asset Turnover | 10.9 | 4.2 |
| Payout ratio | 0% | 0% |
| Dividend yield | 0% | 0% |
| Fiscal Year | 2025 | 2025 |
Efficiency & Valuation Duel: The Vital Signs
Financial ratios serve as a company’s DNA, unveiling hidden risks and operational strengths that shape investor decisions.
Adobe Inc.
Adobe demonstrates robust profitability with a 61.3% ROE and a 30% net margin, signaling strong operational efficiency. Its P/E ratio of 19.13 suggests a fairly valued stock, neither cheap nor expensive by tech standards. Adobe does not pay dividends but reinvests heavily in R&D, fueling sustained growth and shareholder value.
Zscaler, Inc.
Zscaler struggles with negative returns: ROE at -2.3% and a net margin below zero, reflecting operational challenges. Its valuation is complex; a negative P/E technically favors valuation, but a high P/B of 24.5 indicates stretched investor expectations. The company pays no dividend, focusing on aggressive R&D investment to drive future expansion.
Premium Valuation vs. Operational Safety
Adobe balances profitability and valuation more effectively, with solid returns justifying its price. Zscaler’s high valuation contrasts sharply with weak profitability and operational inefficiencies. Investors prioritizing stable returns and operational strength may lean toward Adobe’s profile, while risk-tolerant growth seekers might consider Zscaler’s potential.
Which one offers the Superior Shareholder Reward?
I observe Adobe Inc. (ADBE) and Zscaler, Inc. (ZS) both pay no dividends, prioritizing reinvestment. Adobe’s cash-generative model yields a robust free cash flow per share of 23.1 versus Zscaler’s 4.7M. Adobe’s buyback intensity is substantial, enhancing shareholder value sustainably. Zscaler shows negative net margins and high leverage, signaling riskier capital allocation. Adobe’s stable margins and capital discipline outpace Zscaler’s growth-at-any-cost approach. For a 2026 investor, Adobe offers a more attractive and durable total return profile.
Comparative Score Analysis: The Strategic Profile
The radar chart reveals the fundamental DNA and trade-offs of Adobe Inc. and Zscaler, Inc., highlighting their distinct financial strengths and weaknesses:
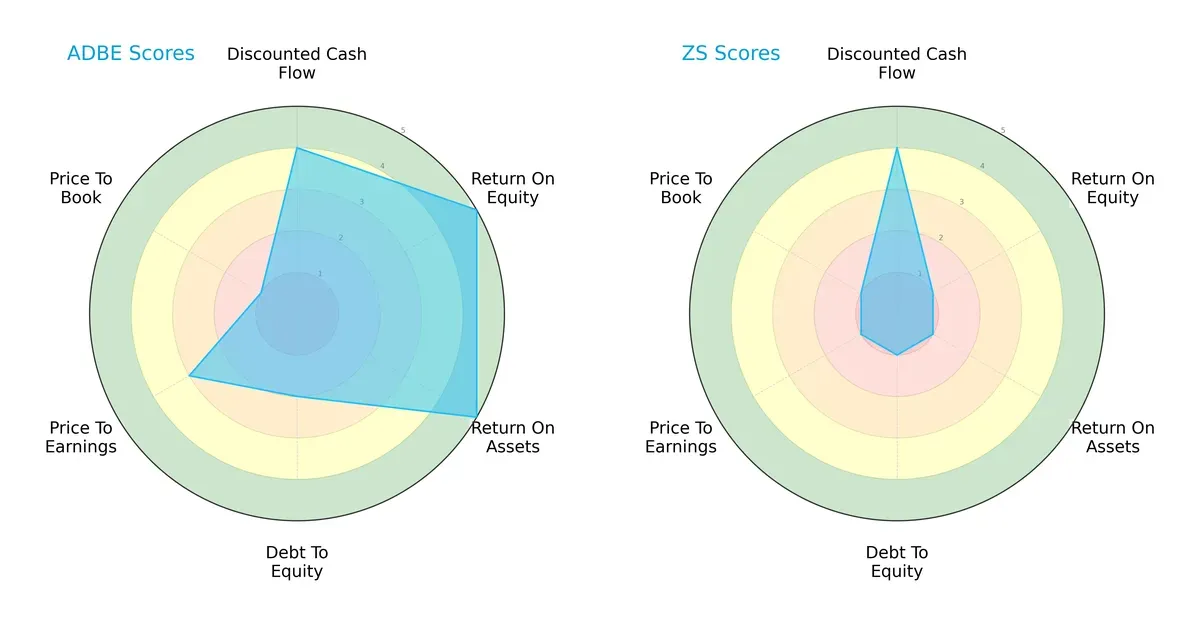
Adobe demonstrates a more balanced profile with high scores in ROE (5) and ROA (5), showing efficient profit and asset use. Zscaler matches Adobe only in discounted cash flow (4) but lags badly in profitability and leverage. Adobe’s moderate debt-to-equity (2) contrasts with Zscaler’s very unfavorable leverage (1). Valuation metrics favor Adobe modestly, signaling a more stable investment foundation.
Bankruptcy Risk: Solvency Showdown
Adobe’s Altman Z-Score of 8.14 substantially exceeds Zscaler’s 4.96, both safely above distress thresholds, but Adobe’s stronger buffer indicates superior long-term solvency in this cycle:

Financial Health: Quality of Operations
Adobe’s Piotroski F-Score of 6 signals solid financial health, while Zscaler’s 3 raises red flags about operational quality and balance sheet strength:

How are the two companies positioned?
This section dissects Adobe and Zscaler’s operational DNA by comparing revenue distribution and internal strengths and weaknesses. The goal is to confront their economic moats and identify which model offers the most resilient, sustainable advantage today.
Revenue Segmentation: The Strategic Mix
This visual comparison dissects how Adobe Inc. and Zscaler, Inc. diversify their income streams and where their primary sector bets lie:

Adobe Inc. showcases a diversified revenue base with $40.4B from Digital Media and $5.9B from Digital Experience, balancing innovation and ecosystem lock-in. Zscaler, by contrast, relies solely on a $2.67B Reportable Segment, reflecting concentration risk but clear focus on its core cybersecurity niche. Adobe’s mix anchors resilience; Zscaler pivots sharply on infrastructure dominance in cloud security.
Strengths and Weaknesses Comparison
This table compares the strengths and weaknesses of Adobe Inc. and Zscaler, Inc. based on diversification, profitability, financials, innovation, global presence, and market share:
Adobe Inc. Strengths
- Strong profitability with 30% net margin
- High ROE of 61.34% and ROIC of 36.69%
- Favorable debt-to-assets at 22.54%
- Robust fixed asset turnover of 10.88
- Diverse revenue streams across Digital Media, Experience, and Print
- Significant global presence with large Americas and EMEA revenues
Zscaler, Inc. Strengths
- Favorable current and quick ratios above 2.0 indicate strong liquidity
- Favorable P/E despite negative profitability metrics
- Favorable debt-to-assets at 27.98%
- Fixed asset turnover at 4.22 supports operational efficiency
- Revenue concentrated but growing in cybersecurity segment
Adobe Inc. Weaknesses
- Unfavorable WACC at 10.6% higher than ROIC spread
- Low current ratio of 1.0 signals liquidity risk
- High Price-to-Book of 11.73 suggests overvaluation
- No dividend yield limits income appeal
- Neutral asset turnover at 0.81 may constrain growth
- Print and Publishing segment declining in size
Zscaler, Inc. Weaknesses
- Negative net margin (-1.55%), ROE (-2.31%), and ROIC (-3.18%) indicate losses
- Unfavorable interest coverage at -0.92 risks debt servicing
- Unfavorable asset turnover at 0.42 limits asset efficiency
- High Price-to-Book of 24.51 signals valuation risk
- Revenue and geography less diversified with US concentration
- No dividend yield restricts shareholder returns
Adobe’s strengths lie in strong profitability, diversified business lines, and global reach. However, its liquidity and valuation pose caution. Zscaler shows solid liquidity and operational efficiency but struggles with profitability and concentration risks. These factors shape each company’s strategic outlook and risk profile.
The Moat Duel: Analyzing Competitive Defensibility
A structural moat is the only reliable shield protecting long-term profits from relentless competitive erosion in technology firms:
Adobe Inc.: Intangible Assets and Ecosystem Lock-in
Adobe’s moat stems from its dominant Creative Cloud ecosystem and strong brand loyalty. This drives stable 37.6% EBIT margins and 30% net margins. Expanding digital experience tools in 2026 should deepen its defensibility.
Zscaler, Inc.: Network Effects in Cloud Security
Zscaler’s moat relies on network effects from its cloud security platform, securing enterprise traffic globally. Unlike Adobe, Zscaler shows negative EBIT margins but rapid revenue growth of 23% in 2025. Market expansion in zero-trust security offers upside.
Moat Battle: Intangible Dominance vs. Emerging Network Strength
Adobe exhibits a wider and deeper moat with 26% ROIC excess over WACC, signaling durable value creation. Zscaler’s rising ROIC trend is promising but still destroys value. Adobe remains better positioned to defend market share long-term.
Which stock offers better returns?
The past year reveals starkly different price trajectories for Adobe Inc. and Zscaler, Inc., with Adobe enduring a sharp decline while Zscaler’s price remains nearly flat amid contrasting trading volumes.

Trend Comparison
Adobe Inc. shows a bearish trend over the past 12 months with a -46.85% price decline and decelerating losses. The stock peaked at 578.34 and hit a low of 293.25, signaling significant downside volatility.
Zscaler, Inc. displays a mild bullish trend with a 0.66% price increase over the year but recent months reveal a sharp -33.21% reversal and decelerating momentum. The stock ranged between 156.78 and 331.14.
Comparing both trends, Adobe’s steep long-term decline contrasts with Zscaler’s near-flat annual return. Zscaler delivered the highest market performance despite recent weakness.
Target Prices
Analysts present a bullish consensus for both Adobe Inc. and Zscaler, Inc., signaling strong growth potential ahead.
| Company | Target Low | Target High | Consensus |
|---|---|---|---|
| Adobe Inc. | 280 | 500 | 390.31 |
| Zscaler, Inc. | 260 | 360 | 311.41 |
Adobe’s consensus target sits roughly 33% above its current price of 293.25, reflecting confidence in its diversified software leadership. Zscaler’s target consensus exceeds its 200.01 price by over 55%, indicating high expectations for its cloud security growth trajectory.

Don’t Let Luck Decide Your Entry Point
Optimize your entry points with our advanced ProRealTime indicators. You’ll get efficient buy signals with precise price targets for maximum performance. Start outperforming now!
How do institutions grade them?
The following tables summarize recent grades assigned to Adobe Inc. and Zscaler, Inc. by leading financial institutions:
Adobe Inc. Grades
This table lists recent grade changes and actions from reputable grading firms for Adobe Inc.
| Grading Company | Action | New Grade | Date |
|---|---|---|---|
| UBS | Maintain | Neutral | 2026-01-26 |
| Oppenheimer | Downgrade | Perform | 2026-01-13 |
| BMO Capital | Downgrade | Market Perform | 2026-01-09 |
| Jefferies | Downgrade | Hold | 2026-01-05 |
| Citigroup | Maintain | Neutral | 2025-12-17 |
| BMO Capital | Maintain | Outperform | 2025-12-15 |
| Keybanc | Downgrade | Underweight | 2025-12-15 |
| Wolfe Research | Maintain | Outperform | 2025-12-11 |
| TD Cowen | Maintain | Hold | 2025-12-11 |
| Oppenheimer | Maintain | Outperform | 2025-12-11 |
Zscaler, Inc. Grades
This table includes recent institutional grades and actions for Zscaler, Inc.
| Grading Company | Action | New Grade | Date |
|---|---|---|---|
| Citigroup | Maintain | Buy | 2026-01-13 |
| Keybanc | Maintain | Overweight | 2026-01-12 |
| Piper Sandler | Maintain | Neutral | 2026-01-05 |
| RBC Capital | Maintain | Outperform | 2026-01-05 |
| Mizuho | Upgrade | Outperform | 2025-12-16 |
| Bernstein | Downgrade | Market Perform | 2025-12-01 |
| Citigroup | Maintain | Buy | 2025-12-01 |
| Baird | Maintain | Outperform | 2025-11-26 |
| B of A Securities | Maintain | Buy | 2025-11-26 |
| BTIG | Maintain | Buy | 2025-11-26 |
Which company has the best grades?
Zscaler, Inc. holds generally more positive and consistent buy and outperform ratings. Adobe Inc. faces several downgrades and more cautious neutral or hold grades. Investors may view Zscaler’s grades as signaling stronger near-term confidence.
Risks specific to each company
The following categories identify the critical pressure points and systemic threats facing both firms in the 2026 market environment:
1. Market & Competition
Adobe Inc.
- Dominates with diversified software segments but faces intense competition in creative and digital experience markets.
Zscaler, Inc.
- Operates in cloud security, a rapidly evolving niche, facing competition from larger cybersecurity providers.
2. Capital Structure & Debt
Adobe Inc.
- Maintains moderate leverage (D/E 0.57) with favorable interest coverage (33.96), signaling strong debt service capacity.
Zscaler, Inc.
- Higher leverage (D/E 1.0) and negative interest coverage (-0.92) raise concerns about debt sustainability.
3. Stock Volatility
Adobe Inc.
- Higher beta at 1.526 indicates greater market sensitivity and volatility.
Zscaler, Inc.
- Beta near market average at 1.022 suggests moderate volatility relative to the sector.
4. Regulatory & Legal
Adobe Inc.
- Faces standard tech sector compliance risks but benefits from established operational history.
Zscaler, Inc.
- Cybersecurity focus exposes it to heightened regulatory scrutiny on data privacy and security compliance.
5. Supply Chain & Operations
Adobe Inc.
- Relies on digital infrastructure and distribution networks with stable operational resilience.
Zscaler, Inc.
- Cloud infrastructure dependence adds operational risk amid rapid technological changes and cloud service disruptions.
6. ESG & Climate Transition
Adobe Inc.
- Industry pressure to enhance sustainability in software operations and data centers; moderate ESG risks.
Zscaler, Inc.
- Faces increasing ESG expectations, especially around data security and responsible cloud management.
7. Geopolitical Exposure
Adobe Inc.
- Global operations expose it to trade tensions and international regulatory risks.
Zscaler, Inc.
- Similar global footprint with additional risks from geopolitical tensions affecting cybersecurity policies.
Which company shows a better risk-adjusted profile?
Adobe’s strongest risk lies in market volatility due to its high beta. Zscaler struggles with capital structure, highlighted by negative interest coverage and weak profitability. Adobe’s robust debt service and profitability metrics grant it a superior risk-adjusted profile. Notably, Zscaler’s negative net margin and ROIC in 2025 confirm its financial fragility, justifying caution despite its favorable liquidity ratios.
Final Verdict: Which stock to choose?
Adobe Inc. wields unmatched capital efficiency, consistently generating returns well above its cost of capital. This durable competitive advantage fuels strong profitability and cash flow, making it a powerhouse for value creation. A point of vigilance is its tight liquidity position, which could pose short-term risks. Adobe suits investors targeting aggressive growth with an appetite for quality.
Zscaler, Inc. builds its moat on cloud security innovation and recurring revenues, offering strategic positioning in a high-growth niche. Compared to Adobe, it presents a safer liquidity profile but struggles with profitability and value destruction. Zscaler fits well in growth-at-a-reasonable-price (GARP) portfolios willing to tolerate volatility for future upside.
If you prioritize resilient value creation and proven profitability, Adobe is the compelling choice due to its durable economic moat and robust returns. However, if you seek exposure to emerging cloud security growth with better short-term liquidity, Zscaler offers superior strategic positioning despite current financial headwinds. Each scenario demands disciplined risk management aligned with your investment goals.
Disclaimer: Investment carries a risk of loss of initial capital. The past performance is not a reliable indicator of future results. Be sure to understand risks before making an investment decision.
Go Further
I encourage you to read the complete analyses of Adobe Inc. and Zscaler, Inc. to enhance your investment decisions: