Home > Comparison > Technology > ADBE vs WIX
The strategic rivalry between Adobe Inc. and Wix.com Ltd. shapes the Software – Infrastructure industry’s future. Adobe operates as a diversified software powerhouse with a broad enterprise focus, while Wix offers a cloud-based platform targeting small businesses and individual creators. This clash highlights a contest between scale-driven innovation and accessible digital tools. This analysis aims to identify which company’s trajectory delivers superior risk-adjusted returns for a balanced portfolio in 2026.
Table of contents
Companies Overview
Adobe and Wix.com stand as pivotal innovators in the global software infrastructure market.
Adobe Inc.: Leader in Creative and Digital Experience Solutions
Adobe dominates the creative software sector, generating revenue primarily through its Creative Cloud subscription service. It targets content creators and enterprises with integrated digital media, experience, and publishing platforms. In 2026, Adobe focuses on expanding its Digital Experience segment, aiming to deepen enterprise customer engagement through analytics and commerce solutions.
Wix.com Ltd.: Pioneer in User-Friendly Website Creation
Wix.com leads in cloud-based website development, earning revenue via premium subscriptions for its drag-and-drop visual editor and business automation tools. Its platform empowers millions globally to build and manage websites without coding. In 2026, Wix prioritizes enhancing its suite of vertical-specific applications to support small business growth and online commerce integration.
Strategic Collision: Similarities & Divergences
Both firms emphasize cloud-based software but diverge in scale and complexity—Adobe offers a broad enterprise ecosystem, while Wix champions accessibility for individuals and SMBs. Their primary battleground is the digital content creation and management space, with Adobe targeting professional workflows and Wix focusing on ease of use. These differences create distinct investment profiles: Adobe as a mature, diversified tech giant; Wix as a high-growth platform geared toward democratizing web presence.
Income Statement Comparison
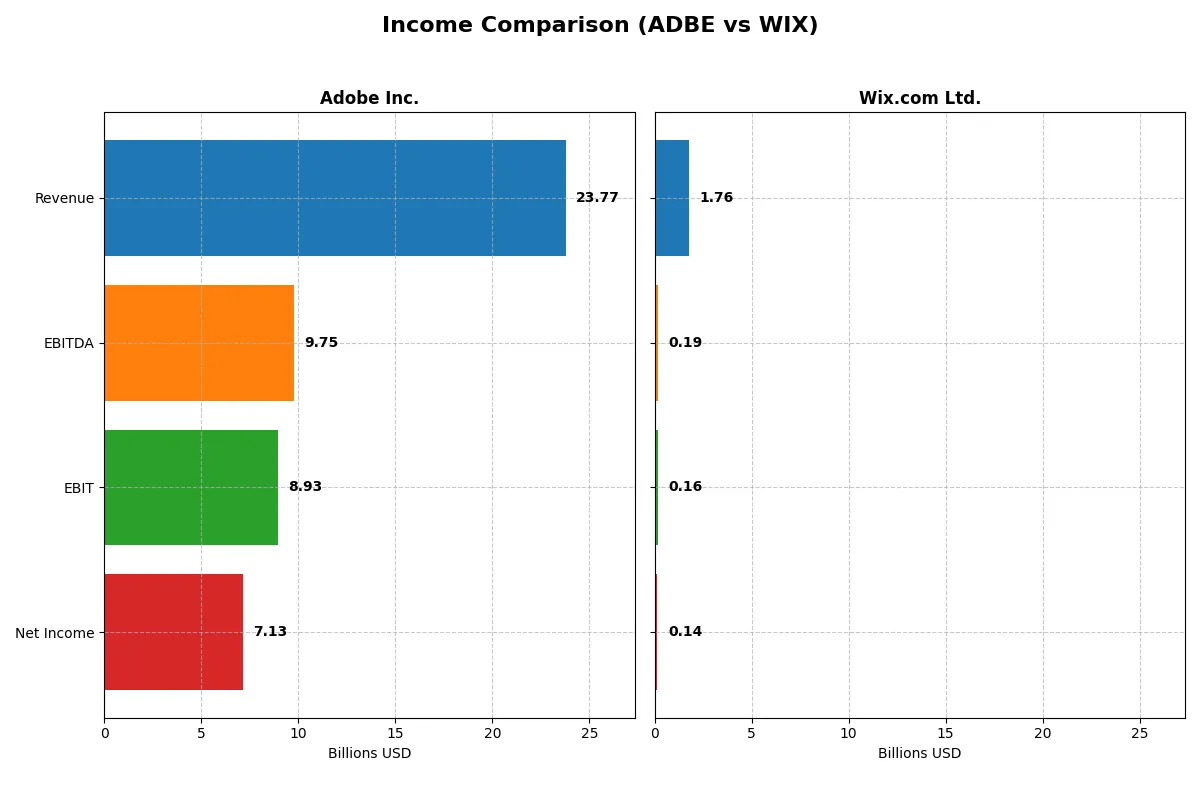
This analysis dissects the core profitability and scalability of both corporate engines to reveal who dominates the bottom line:
| Metric | Adobe Inc. (ADBE) | Wix.com Ltd. (WIX) |
|---|---|---|
| Revenue | 23.8B | 1.76B |
| Cost of Revenue | 2.71B | 565M |
| Operating Expenses | 12.4B | 1.10B |
| Gross Profit | 21.1B | 1.20B |
| EBITDA | 9.75B | 186M |
| EBIT | 8.93B | 155M |
| Interest Expense | 263M | 3.86M |
| Net Income | 7.13B | 138M |
| EPS | 16.73 | 2.49 |
| Fiscal Year | 2025 | 2024 |
Income Statement Analysis: The Bottom-Line Duel
This income statement comparison reveals which company converts revenue into profit with greater efficiency and momentum.
Adobe Inc. Analysis
Adobe’s revenue climbed steadily from 15.8B in 2021 to 23.8B in 2025, with net income rising from 4.8B to 7.1B. Its gross margin remains robust near 89%, while the net margin holds at a strong 30%. In 2025, Adobe accelerated EBIT growth by 25.8%, signaling superior operational leverage and profitability momentum.
Wix.com Ltd. Analysis
Wix expanded revenue from 985M in 2020 to 1.76B in 2024, with net income improving from a -167M loss to 138M profit. Gross margin improved to 68%, while net margin stayed modest at 7.9%. The latest year saw a remarkable 269% surge in EBIT and net margin, reflecting a rapid turnaround and growing operational efficiency.
Margin Power vs. Revenue Scale
Adobe leads with dominant margins and consistent profit scale, generating 7.1B net income on 23.8B revenue in 2025. Wix demonstrates impressive growth rates and margin expansion but remains smaller and less profitable in absolute terms. Investors prioritizing steady profits may favor Adobe’s scale; those seeking high growth might watch Wix’s momentum closely.
Financial Ratios Comparison
These vital ratios act as a diagnostic tool to expose the underlying fiscal health, valuation premiums, and capital efficiency of the companies compared:
| Ratios | Adobe Inc. (ADBE) | Wix.com Ltd. (WIX) |
|---|---|---|
| ROE | 61.3% | -175.6% |
| ROIC | 36.7% | 9.1% |
| P/E | 19.1 | 86.2 |
| P/B | 11.7 | -151.4 |
| Current Ratio | 1.0 | 0.84 |
| Quick Ratio | 1.0 | 0.84 |
| D/E | 0.57 | -12.3 |
| Debt-to-Assets | 22.5% | 50.7% |
| Interest Coverage | 33.1 | 25.9 |
| Asset Turnover | 0.81 | 0.92 |
| Fixed Asset Turnover | 10.9 | 3.33 |
| Payout ratio | 0% | 0% |
| Dividend yield | 0% | 0% |
| Fiscal Year | 2025 | 2024 |
Efficiency & Valuation Duel: The Vital Signs
Financial ratios act as a company’s DNA, exposing operational strengths and hidden risks crucial to investors’ confidence and decision-making.
Adobe Inc.
Adobe demonstrates stellar profitability with a 61.3% ROE and a strong 30% net margin, signaling exceptional operational efficiency. Its P/E of 19.1 is fairly valued against industry standards. Despite no dividend payout, Adobe reinvests heavily in R&D, fueling sustainable growth and shareholder value creation over time.
Wix.com Ltd.
Wix struggles with a negative ROE at -175.6%, reflecting profitability challenges despite a modest 7.9% net margin. The stock appears stretched with an elevated P/E of 86.2, raising valuation concerns. Wix returns to shareholders mainly through growth investments in R&D, lacking dividend distributions amid ongoing operational scaling.
Premium Valuation vs. Operational Safety
Adobe offers a superior balance of robust profitability and reasonable valuation, despite a lack of dividends. Wix’s high valuation and poor returns flag higher risk. Investors prioritizing operational safety and consistent returns will find Adobe’s profile more aligned with their goals.
Which one offers the Superior Shareholder Reward?
I observe that neither Adobe Inc. (ADBE) nor Wix.com Ltd. (WIX) pays dividends, focusing instead on reinvestment and buybacks. Adobe’s free cash flow per share stands at $23.1B with no payout ratio, signaling robust reinvestment capacity. Wix delivers a lower $8.6B free cash flow per share, also without dividends. Adobe’s buyback intensity is more credible, supported by a strong operating cash flow ratio near 1.0 and sustainable debt levels (debt to assets ~22%). Wix’s higher debt burden (debt to assets ~51%) and weaker cash flow coverage raise sustainability concerns. I conclude Adobe offers a superior total shareholder return profile in 2026, backed by stronger free cash flow generation and prudent capital allocation.
Comparative Score Analysis: The Strategic Profile
The radar chart reveals the fundamental DNA and trade-offs of Adobe Inc. and Wix.com Ltd., highlighting their strategic strengths and weaknesses:
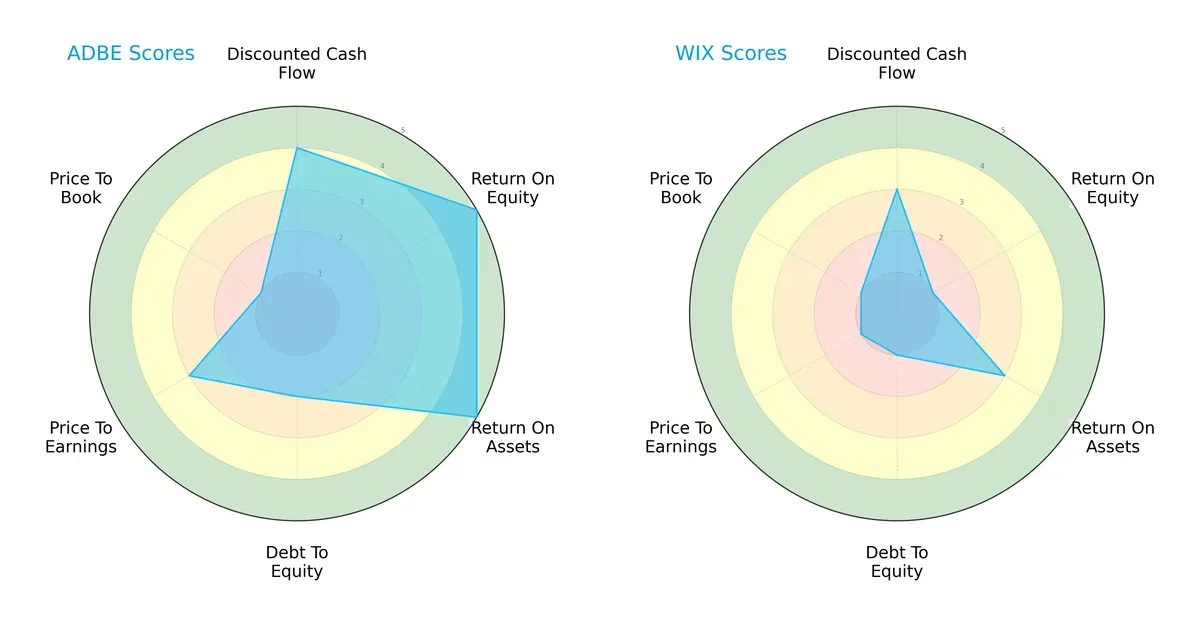
Adobe Inc. leads with a balanced profile, excelling in ROE (5) and ROA (5), signaling efficient capital and asset use. Wix.com shows weaker profitability scores (ROE 1, ROA 3) and struggles with financial leverage (Debt/Equity 1). Adobe’s moderate Debt/Equity score (2) and valuation metrics (P/E 3, P/B 1) reflect some risk in price-to-book valuation, but overall it maintains robustness. Wix relies on a narrower base, lacking operational efficiency and facing valuation challenges, exposing higher risk.
Bankruptcy Risk: Solvency Showdown
The Altman Z-Score gap underscores Adobe’s superior financial safety compared to Wix, implying stronger long-term survival prospects in the current cycle:
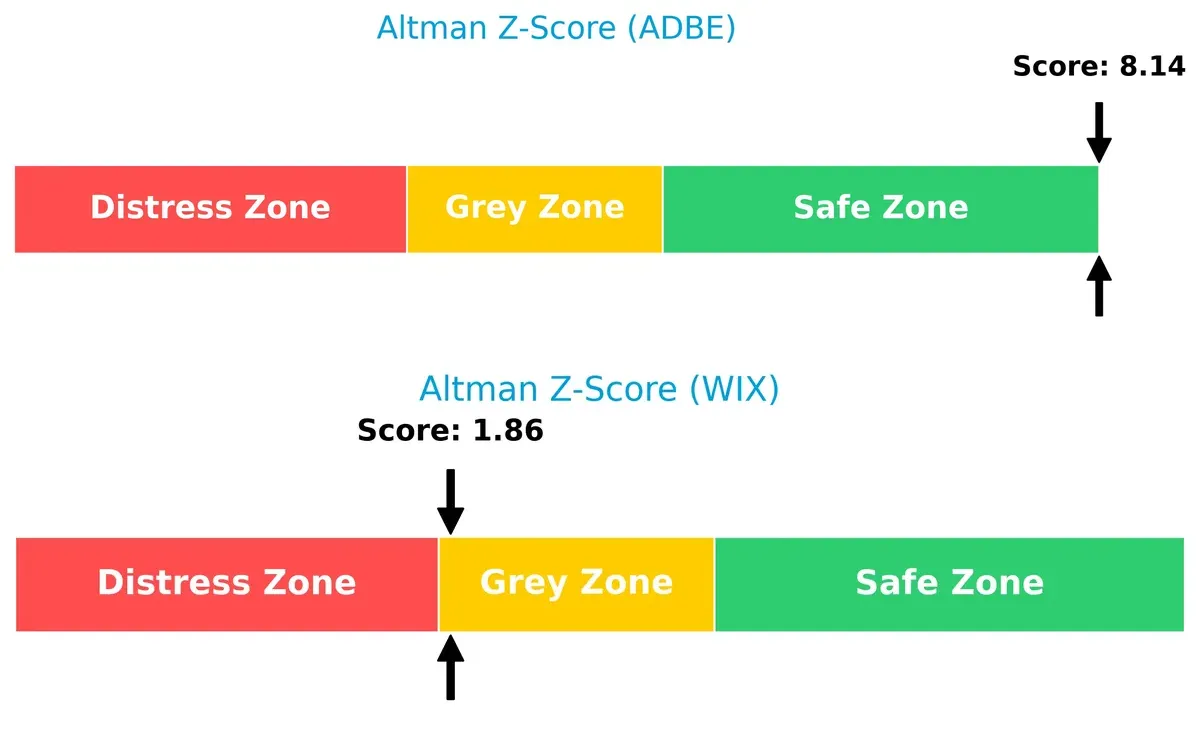
Adobe’s Z-Score of 8.14 places it firmly in the safe zone, indicating low bankruptcy risk. Wix’s 1.86 lands in the grey zone, signaling moderate distress risk. This difference highlights Adobe’s robust solvency while Wix faces cautionary red flags.
Financial Health: Quality of Operations
Both companies register a Piotroski F-Score of 6, reflecting average financial health but no clear dominance in operational quality:
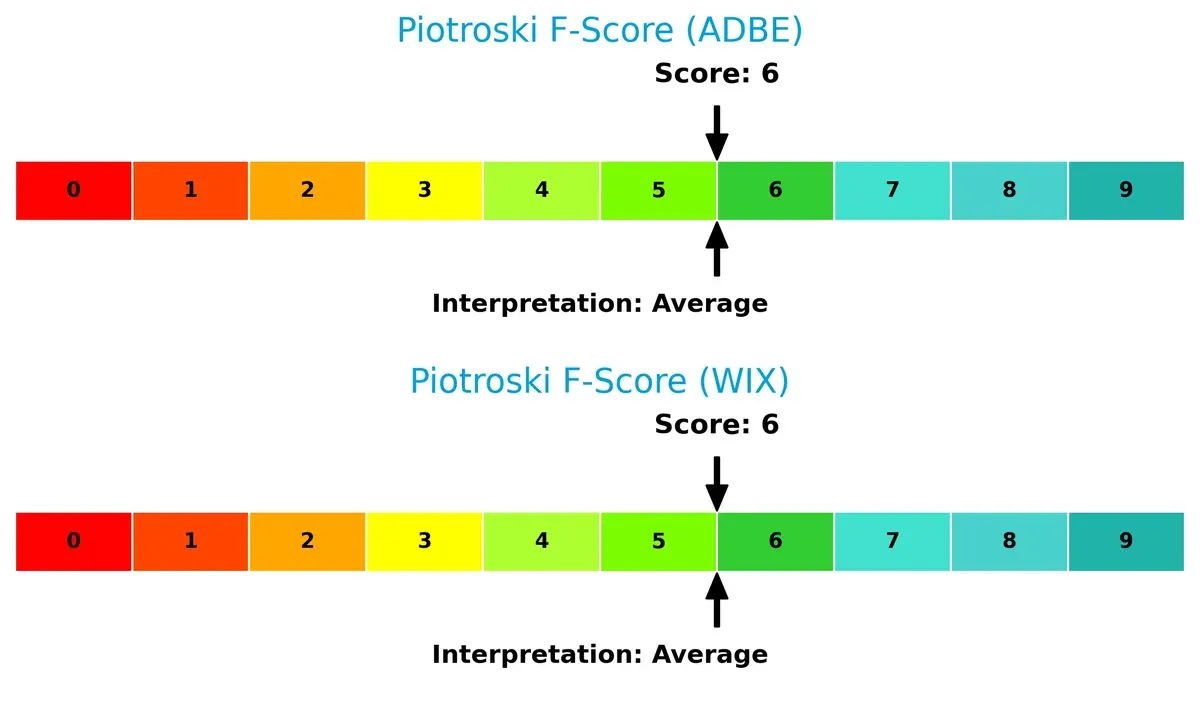
These scores suggest neither firm shows acute internal financial distress. However, neither achieves peak strength (8-9), so investors should watch for potential internal weaknesses and monitor improvements closely.
How are the two companies positioned?
This section dissects Adobe and Wix’s operational DNA by comparing revenue distribution and internal strengths and weaknesses. The goal is to confront their economic moats to reveal which model delivers the most resilient, sustainable competitive edge today.
Revenue Segmentation: The Strategic Mix
This visual comparison dissects how Adobe Inc. and Wix.com Ltd. diversify their income streams and where their primary sector bets lie:
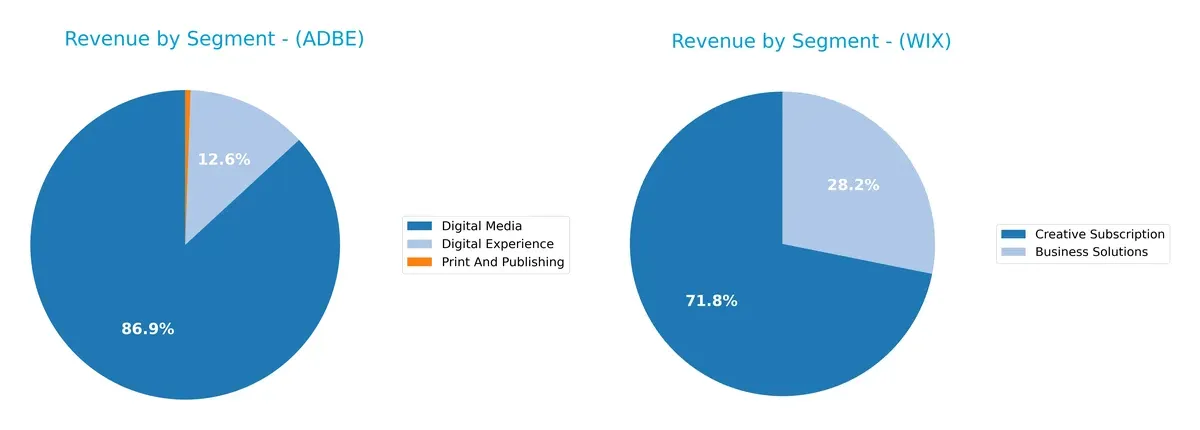
Adobe’s revenue dwarfs Wix’s, anchored heavily by its Digital Media segment at $40.4B in 2025, overshadowing Digital Experience at $5.9B and Print and Publishing at $256M. Wix pivots on Creative Subscription at $1.26B and Business Solutions at $496M, showing a more balanced split. Adobe’s concentration in Digital Media signals ecosystem dominance but heightens concentration risk. Wix’s diversified mix supports steady growth with less dependency on one segment.
Strengths and Weaknesses Comparison
This table compares the Strengths and Weaknesses of Adobe Inc. and Wix.com Ltd.:
Adobe Inc. Strengths
- Strong profitability with 30% net margin
- High ROE at 61.34% indicates efficient capital use
- Favorable debt-to-assets ratio at 22.54%
- High interest coverage at 33.96 supports debt servicing
- Significant global presence with strong Americas and EMEA sales
- Diversified product segments including Digital Experience and Media
Wix.com Ltd. Strengths
- Favorable interest coverage at 40.14 supports financial stability
- Positive fixed asset turnover at 3.33 shows asset utilization
- Favorable PB and DE ratios indicate potential undervaluation
- Geographic diversification across North America, Europe, Asia Pacific
- Growth in Creative Subscription and Business Solutions segments
Adobe Inc. Weaknesses
- Unfavorable WACC at 10.6% could pressure returns
- Low current ratio at 1.0 signals liquidity risk
- High PB ratio at 11.73 may indicate overvaluation
- No dividend yield limits income for investors
- Heavy reliance on Digital Media segment limits diversification
- Moderate asset turnover at 0.81 implies less efficient asset use
Wix.com Ltd. Weaknesses
- Negative ROE at -175.57% signals poor profitability
- Unfavorable debt-to-assets at 50.7% raises leverage concerns
- High PE ratio at 86.21 reflects high valuation risk
- Low current ratio at 0.84 highlights liquidity challenges
- Zero dividend yield reduces shareholder income
- Lower net margin at 7.86% suggests weaker profitability
Adobe’s strengths lie in robust profitability and financial stability with a wide global footprint. Wix shows solid asset utilization and geographic diversification but struggles with profitability and leverage. Both firms face liquidity concerns and lack dividend income, influencing their capital allocation strategies.
The Moat Duel: Analyzing Competitive Defensibility
A structural moat is the only defense long-term profits have against relentless competitive erosion in dynamic markets:
Adobe Inc.: Intangible Assets Powerhouse
Adobe’s moat stems from its deep intangible assets, notably Creative Cloud’s brand and ecosystem. High ROIC around 26% confirms strong value creation. New AI tools and enterprise expansions in 2026 should deepen this advantage.
Wix.com Ltd.: User-Friendly Platform with Scale Challenges
Wix relies on user-friendly platform design and network effects but lacks Adobe’s intangible asset depth. Its ROIC remains below WACC, signaling value destruction despite rapid growth. Expansion in e-commerce and payments may improve this in 2026.
Moat Battle: Intangible Assets vs. Platform Accessibility
Adobe’s intangible asset moat is wider and more durable, evidenced by a 26% ROIC well above WACC. Wix shows improving but still negative ROIC, making Adobe better equipped to protect market share in 2026.
Which stock offers better returns?
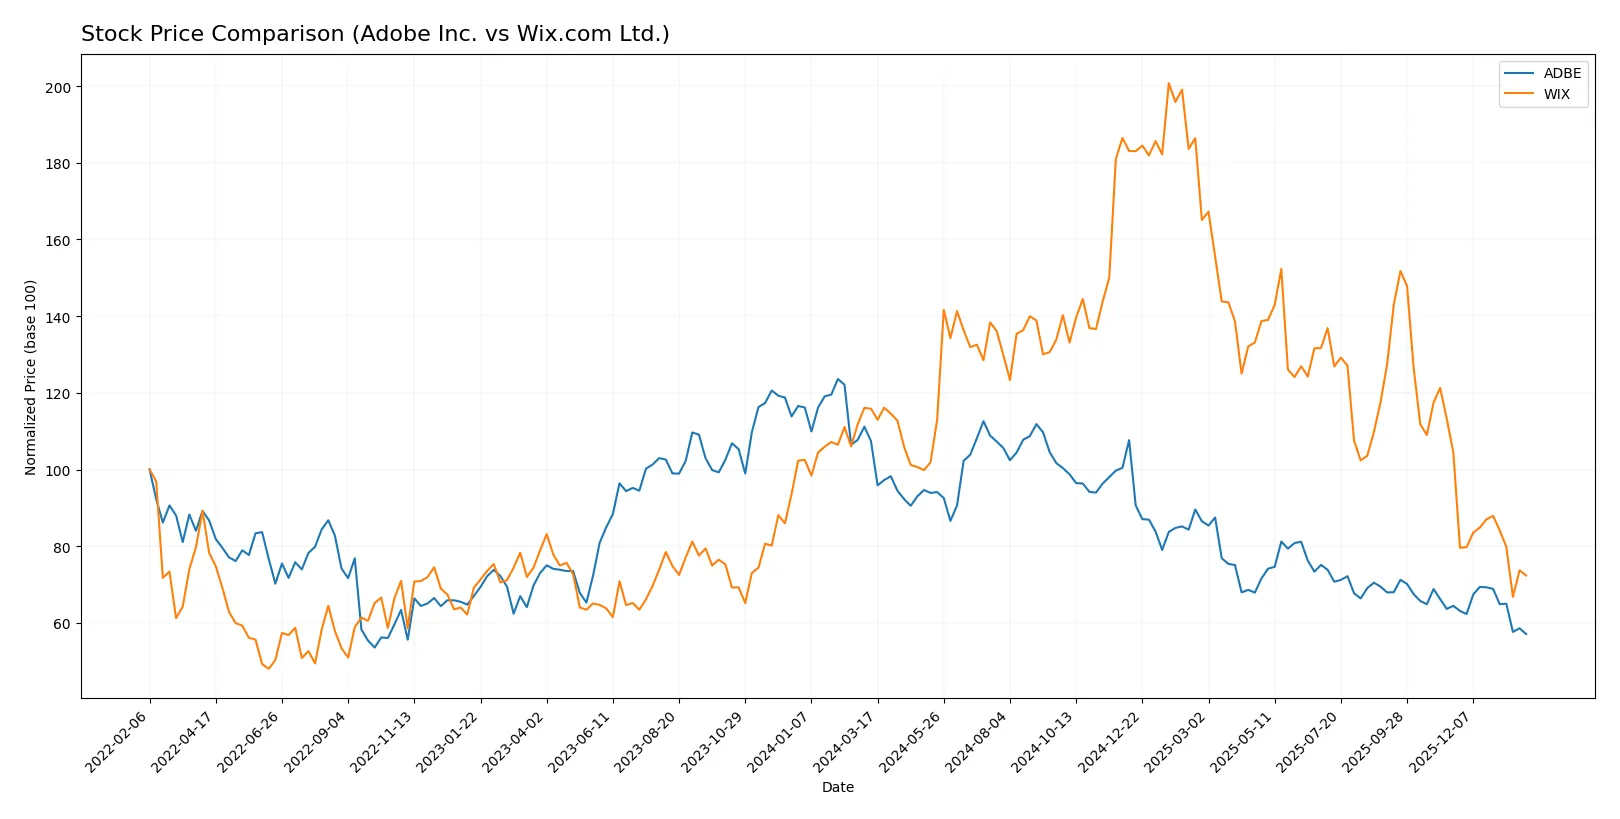
Over the past 12 months, both Adobe Inc. and Wix.com Ltd. have experienced significant price declines, reflecting bearish trends with decelerating momentum.
Trend Comparison
Adobe Inc.’s stock fell 46.85% over the past year, showing a bearish trend with decelerating losses and a high volatility level of 78.57. The price ranged from 578.34 at its peak to 293.25 at its low.
Wix.com Ltd. declined 37.54% in the same period, also bearish with deceleration. Volatility was lower at 35.68, and the price swung between 240.89 and 80.16.
Comparing both, Adobe’s stock delivered the weakest performance with a larger percentage drop. Wix.com’s decline was less severe, indicating relatively better market resilience.
Target Prices
Analysts project a broad but optimistic target range for Adobe Inc. and Wix.com Ltd., reflecting growth potential tempered by market volatility.
| Company | Target Low | Target High | Consensus |
|---|---|---|---|
| Adobe Inc. | 280 | 500 | 390.31 |
| Wix.com Ltd. | 70 | 210 | 159.82 |
Adobe’s consensus target sits roughly 33% above the current price of 293.25, signaling strong confidence in its infrastructure software moat. Wix’s target consensus nearly doubles its current 86.84 price, indicating high growth expectations despite recent weakness.

Don’t Let Luck Decide Your Entry Point
Optimize your entry points with our advanced ProRealTime indicators. You’ll get efficient buy signals with precise price targets for maximum performance. Start outperforming now!
How do institutions grade them?
Adobe Inc. Grades
The following table summarizes recent grade changes by recognized institutions for Adobe Inc.:
| Grading Company | Action | New Grade | Date |
|---|---|---|---|
| UBS | Maintain | Neutral | 2026-01-26 |
| Oppenheimer | Downgrade | Perform | 2026-01-13 |
| BMO Capital | Downgrade | Market Perform | 2026-01-09 |
| Jefferies | Downgrade | Hold | 2026-01-05 |
| Citigroup | Maintain | Neutral | 2025-12-17 |
| BMO Capital | Maintain | Outperform | 2025-12-15 |
| Keybanc | Downgrade | Underweight | 2025-12-15 |
| Wolfe Research | Maintain | Outperform | 2025-12-11 |
| TD Cowen | Maintain | Hold | 2025-12-11 |
| Oppenheimer | Maintain | Outperform | 2025-12-11 |
Wix.com Ltd. Grades
Below is a summary of recent institutional grades and actions for Wix.com Ltd.:
| Grading Company | Action | New Grade | Date |
|---|---|---|---|
| Citizens | Maintain | Market Outperform | 2026-01-22 |
| Barclays | Maintain | Overweight | 2026-01-21 |
| Morgan Stanley | Maintain | Overweight | 2026-01-15 |
| Wells Fargo | Maintain | Overweight | 2025-12-19 |
| Cantor Fitzgerald | Maintain | Overweight | 2025-12-11 |
| Citizens | Maintain | Market Outperform | 2025-11-20 |
| RBC Capital | Maintain | Outperform | 2025-11-20 |
| Wells Fargo | Maintain | Overweight | 2025-11-20 |
| Benchmark | Maintain | Buy | 2025-11-20 |
| Barclays | Maintain | Overweight | 2025-11-20 |
Which company has the best grades?
Wix.com Ltd. consistently receives stronger grades like Market Outperform and Overweight, while Adobe Inc. faces multiple downgrades ending at Neutral or Hold. This divergence may influence investor sentiment and capital allocation decisions.
Risks specific to each company
The following categories highlight critical pressure points and systemic threats facing Adobe Inc. and Wix.com Ltd. in the 2026 market environment:
1. Market & Competition
Adobe Inc.
- Dominates with diversified software and strong Digital Media segment; faces intense competition from established tech giants.
Wix.com Ltd.
- Focuses on cloud-based website creation; competes heavily with other SaaS platforms and new entrants in visual web development.
2. Capital Structure & Debt
Adobe Inc.
- Maintains moderate debt-to-assets (22.54%) with solid interest coverage (33.96x); current ratio at 1.0 signals liquidity risk.
Wix.com Ltd.
- High debt-to-assets (50.7%) with negative debt-to-equity ratio; interest coverage is strong (40.14x), but liquidity is weaker (current ratio 0.84).
3. Stock Volatility
Adobe Inc.
- Beta of 1.526 indicates above-average volatility aligned with tech sector; stock price range wide (284.6–465.7).
Wix.com Ltd.
- Beta of 1.418 shows slightly less volatility; stock price range very wide (75–239.7), reflecting greater market uncertainty.
4. Regulatory & Legal
Adobe Inc.
- Subject to US technology regulations and data privacy laws; risks from antitrust scrutiny remain moderate.
Wix.com Ltd.
- Faces Israeli and international compliance challenges, particularly data privacy and cross-border regulations, increasing legal complexity.
5. Supply Chain & Operations
Adobe Inc.
- Operates through global digital distribution with minimal physical supply chain risk; operational scale is robust.
Wix.com Ltd.
- Relies on cloud infrastructure globally; potential risks from vendor dependencies and tech service disruptions.
6. ESG & Climate Transition
Adobe Inc.
- Increasing ESG initiatives but no dividend yield may concern income-focused investors; climate transition risk moderate.
Wix.com Ltd.
- Limited ESG disclosure; no dividend yield and financial instability raise concerns about sustainable capital allocation.
7. Geopolitical Exposure
Adobe Inc.
- Primarily US-based but global operations expose it to trade tensions and cybersecurity risks.
Wix.com Ltd.
- Israel-based with strong international presence; geopolitical tensions in the Middle East may impact operations and investor sentiment.
Which company shows a better risk-adjusted profile?
Adobe faces its biggest risk in liquidity management with a current ratio at the lower threshold. Wix’s most critical threat lies in capital structure, marked by high debt-to-assets and negative debt-to-equity ratios. Adobe’s diversified revenue and strong profitability metrics underpin a better risk-adjusted profile. Recent financial scores confirm Adobe’s safe Altman Z-Score (8.14) versus Wix’s precarious grey zone (1.86), justifying caution on Wix’s financial health.
Final Verdict: Which stock to choose?
Adobe Inc. wields a powerful competitive advantage through its exceptional capital efficiency and robust value creation. Its ability to generate returns far above its cost of capital signals a durable moat. A point of vigilance remains its tight liquidity position, which may limit flexibility. Adobe suits portfolios seeking aggressive growth with resilience.
Wix.com Ltd. offers a strategic moat founded on rapid revenue growth and innovation-driven R&D investment. Though it currently sheds value relative to its cost of capital, its improving profitability trend suggests potential upside. Wix presents a higher-risk profile but appeals to growth-at-a-reasonable-price (GARP) investors seeking dynamic expansion.
If you prioritize strong economic moats and consistent value creation, Adobe outshines as a compelling choice thanks to its superior return metrics and financial stability. However, if you seek aggressive growth fueled by innovation and can tolerate more volatility, Wix offers better upside potential despite current challenges. Each reflects distinct investor risk appetites and strategic goals.
Disclaimer: Investment carries a risk of loss of initial capital. The past performance is not a reliable indicator of future results. Be sure to understand risks before making an investment decision.
Go Further
I encourage you to read the complete analyses of Adobe Inc. and Wix.com Ltd. to enhance your investment decisions: