Home > Comparison > Technology > ADBE vs VRSN
The strategic rivalry between Adobe Inc. and VeriSign, Inc. shapes the technology sector’s infrastructure landscape. Adobe operates as a diversified software powerhouse, focusing on creative and digital experience solutions, while VeriSign specializes in internet infrastructure and domain name registry services. This analysis contrasts Adobe’s broad innovation-driven growth with VeriSign’s niche, stable cash flow model. I aim to identify which trajectory offers superior risk-adjusted returns for a well-diversified portfolio.
Table of contents
Companies Overview
Adobe Inc. and VeriSign, Inc. stand as pivotal players shaping the software infrastructure landscape.
Adobe Inc.: Creative and Digital Experience Powerhouse
Adobe dominates as a diversified software company. Its core revenue stems from Creative Cloud subscriptions, empowering content creators globally. In 2026, Adobe focuses sharply on enhancing its Digital Experience platform, aiming to integrate analytics, commerce, and customer engagement tools for enterprise clients.
VeriSign, Inc.: Internet Security and Domain Registry Leader
VeriSign commands the internet infrastructure niche by managing critical domain name registries like .com and .net. Its competitive advantage lies in securing and stabilizing global internet navigation. In 2026, VeriSign prioritizes expanding its authoritative domain resolution services alongside reinforcing internet security and data integrity.
Strategic Collision: Similarities & Divergences
Both firms operate in software infrastructure but diverge sharply in philosophy. Adobe builds a closed ecosystem centered on creative and marketing tools, while VeriSign maintains an open infrastructure vital to internet functionality. Their main battleground is digital trust and platform reliance. Adobe offers growth via innovation and scale; VeriSign delivers stability and defensive moat in internet governance.
Income Statement Comparison
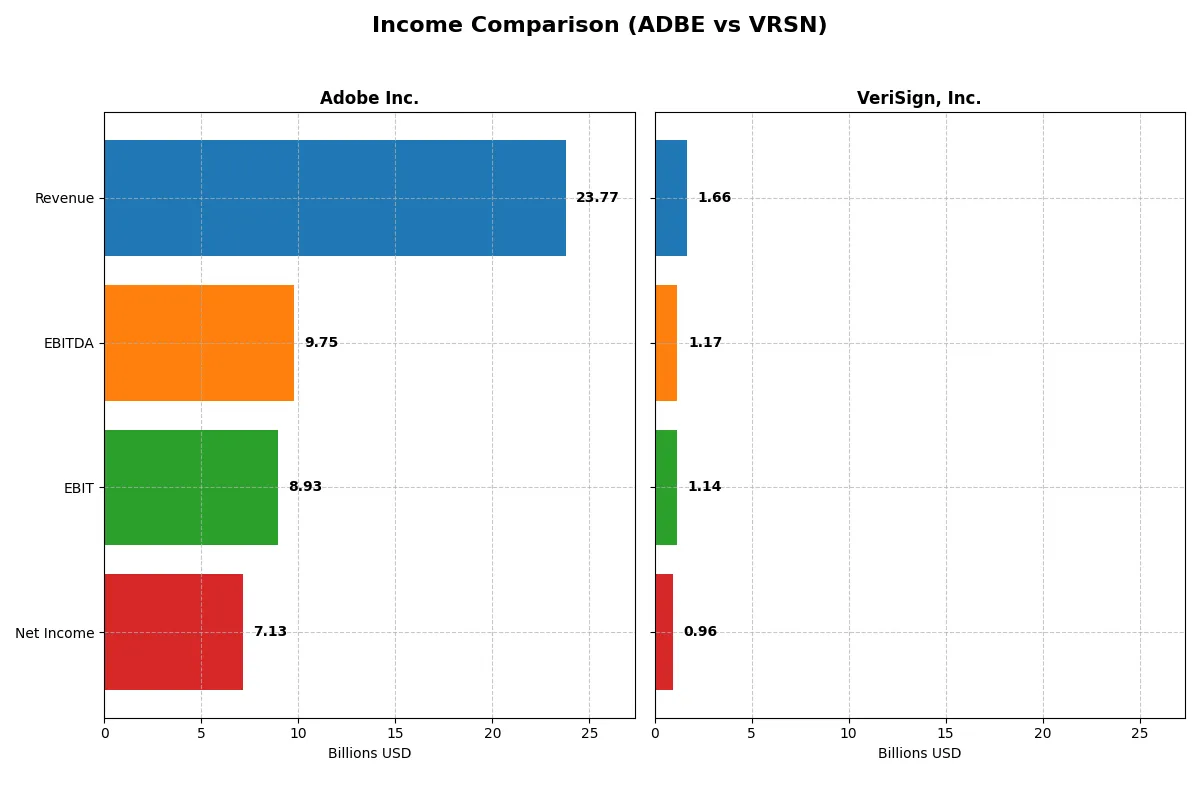
This data dissects the core profitability and scalability of both corporate engines to reveal who dominates the bottom line:
| Metric | Adobe Inc. (ADBE) | VeriSign, Inc. (VRSN) |
|---|---|---|
| Revenue | 23.8B | 1.66B |
| Cost of Revenue | 2.71B | 196M |
| Operating Expenses | 12.4B | 339M |
| Gross Profit | 21.1B | 1.46B |
| EBITDA | 9.75B | 1.17B |
| EBIT | 8.93B | 1.14B |
| Interest Expense | 263M | 77M |
| Net Income | 7.13B | 956M |
| EPS | 16.73 | 8.83 |
| Fiscal Year | 2025 | 2025 |
Income Statement Analysis: The Bottom-Line Duel
This income statement comparison reveals which company runs a more efficient and profitable corporate engine through recent financial trends.
Adobe Inc. Analysis
Adobe’s revenue rose sharply from 15.8B in 2021 to 23.8B in 2025, with net income climbing from 4.8B to 7.1B. Its gross margin remains strong at 88.6%, and the net margin holds a healthy 30%. In 2025, Adobe accelerates earnings with a 16% net margin growth, signaling robust operational momentum and expanding profitability.
VeriSign, Inc. Analysis
VeriSign’s revenue grew moderately from 1.33B in 2021 to 1.66B in 2025, with net income rising from 785M to 956M. The company sustains an impressive 88.2% gross margin and an exceptional 57.7% net margin. However, growth rates are more measured; 2025’s net margin improved by 14%, reflecting steady but less dynamic earnings expansion compared to Adobe.
Margin Dominance vs. Scale Momentum
Adobe leads in revenue scale and income growth, expanding top-line by over 50% since 2021 with strong net margin gains. VeriSign excels in margin dominance, boasting nearly double Adobe’s net margin but with slower revenue growth. Investors seeking rapid growth may favor Adobe’s momentum, while margin-focused profiles might prefer VeriSign’s efficiency.
Financial Ratios Comparison
These vital ratios act as a diagnostic tool to expose the underlying fiscal health, valuation premiums, and capital efficiency of the companies compared below:
| Ratios | Adobe Inc. (ADBE) | VeriSign, Inc. (VRSN) |
|---|---|---|
| ROE | 61.3% | -64.8% |
| ROIC | 36.7% | -152.0% |
| P/E | 19.1 | 23.5 |
| P/B | 11.7 | -15.2 |
| Current Ratio | 1.00 | 0.49 |
| Quick Ratio | 1.00 | 0.49 |
| D/E | 0.57 | -1.21 |
| Debt-to-Assets | 22.5% | 265.5% |
| Interest Coverage | 33.1 | 14.6 |
| Asset Turnover | 0.81 | 2.46 |
| Fixed Asset Turnover | 10.9 | 7.75 |
| Payout ratio | 0 | 22.5% |
| Dividend yield | 0 | 0.96% |
| Fiscal Year | 2025 | 2025 |
Efficiency & Valuation Duel: The Vital Signs
Financial ratios serve as a company’s DNA, unveiling hidden risks and operational strengths that numbers alone cannot capture.
Adobe Inc.
Adobe posts a robust 61.3% ROE and a solid 30% net margin, confirming strong profitability. Its P/E of 19.1 suggests a fairly valued stock, neither stretched nor cheap. Adobe avoids dividends, instead reinvesting heavily in R&D at 18% of revenue, fueling sustained growth and operational efficiency.
VeriSign, Inc.
VeriSign shows an impressive 57.7% net margin but suffers a negative ROE of -64.8%, signaling profitability issues despite operational strength. Its P/E of 23.5 indicates a neutral valuation. VeriSign pays a modest 0.96% dividend, though negative ROIC and high debt ratios raise caution on capital efficiency.
Profitability vs. Risk: A Delicate Balance
Adobe offers a superior blend of profitability and capital efficiency with manageable debt, fitting growth-focused investors. VeriSign’s high margins contrast with troubling returns on equity and capital, suiting investors willing to endure risk for potential turnaround gains.
Which one offers the Superior Shareholder Reward?
Adobe Inc. (ADBE) pays no dividends but generates robust free cash flow (FCF) of 23.1/share in 2025, supporting sustainable growth and moderate buybacks. VeriSign, Inc. (VRSN) offers a 0.96% dividend yield with a 22.5% payout ratio, alongside steady buybacks funded by 11.6/share FCF. I observe Adobe’s reinvestment in growth and disciplined buybacks as more sustainable. VeriSign’s dividend adds income but risks cash strain given its weak liquidity ratios. In 2026, Adobe’s superior FCF coverage and capital allocation promise stronger total shareholder returns than VeriSign’s modest yield and higher leverage.
Comparative Score Analysis: The Strategic Profile
The radar chart reveals the fundamental DNA and trade-offs of Adobe Inc. and VeriSign, Inc., highlighting their unique financial strengths and weaknesses:
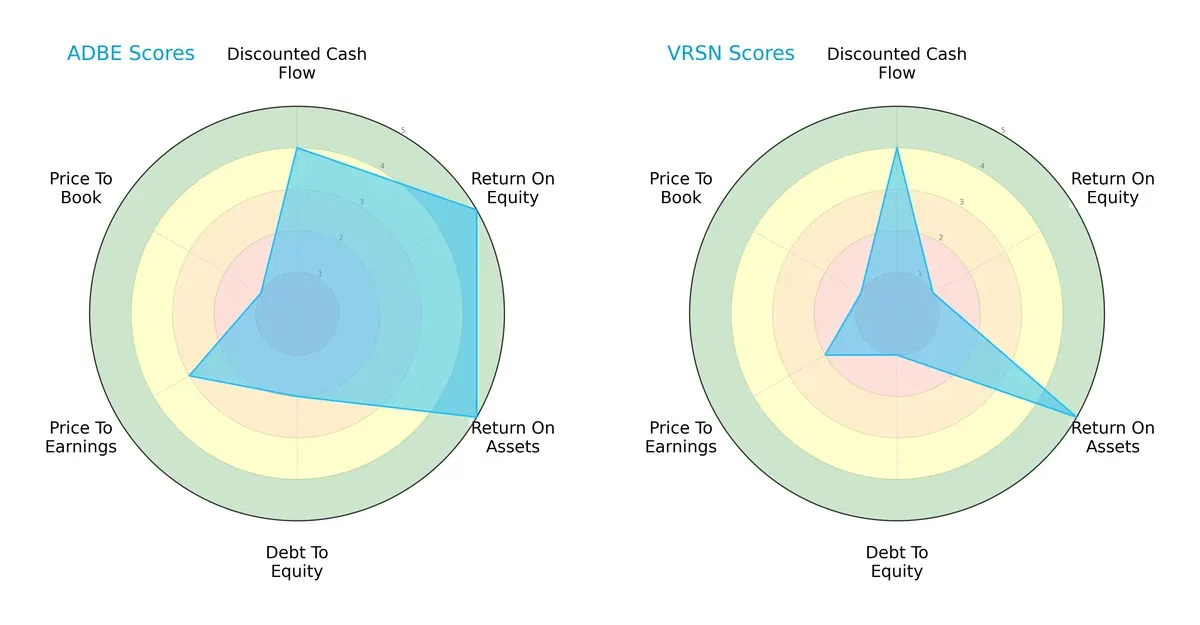
Adobe displays a balanced profile with strong returns on equity (5) and assets (5), and a favorable DCF score (4). However, its debt-to-equity score (2) flags some leverage risk. VeriSign relies heavily on asset efficiency (ROA 5) but scores poorly on ROE (1) and debt-to-equity (1), indicating financial risk and weaker profitability. Adobe offers a more stable, diversified edge, while VeriSign depends on asset utilization.
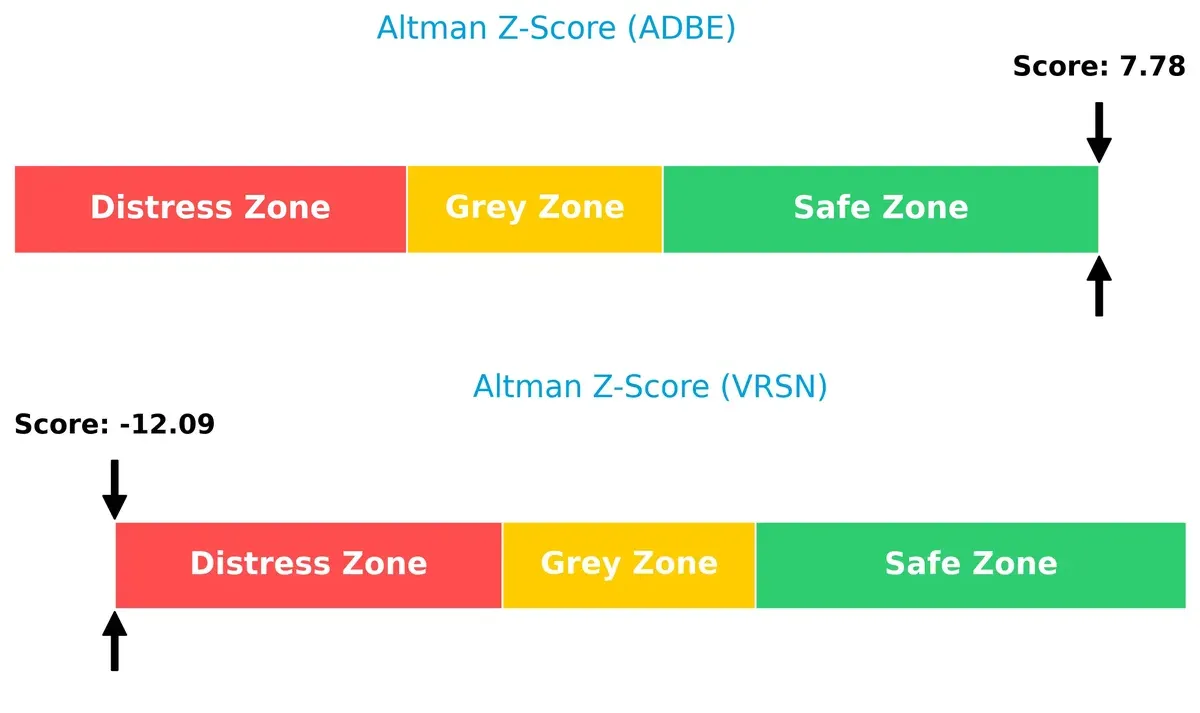
Bankruptcy Risk: Solvency Showdown
The Altman Z-Score delta shows Adobe’s score at 7.78 in the safe zone versus VeriSign’s -12.09 deep in distress, signaling a stark solvency divide for long-term survival in this cycle:
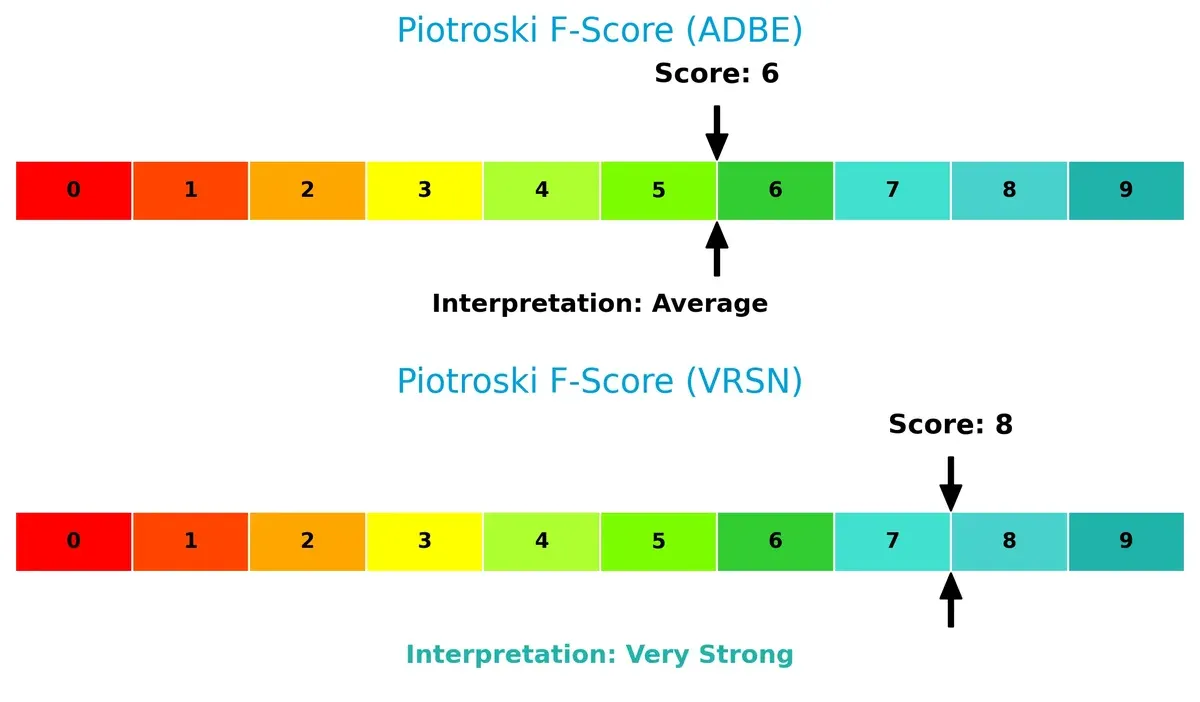
Financial Health: Quality of Operations
VeriSign’s Piotroski score of 8 signals very strong financial health, outperforming Adobe’s average score of 6, which hints at some internal operational weaknesses:
How are the two companies positioned?
This section dissects Adobe and VeriSign’s operational DNA by comparing their revenue distribution and internal dynamics, including strengths and weaknesses. The final goal is to confront their economic moats to identify which business model offers the most resilient and sustainable competitive advantage in today’s market.
Revenue Segmentation: The Strategic Mix
The following visual comparison dissects how Adobe Inc. and VeriSign, Inc. diversify their income streams and where their primary sector bets lie:
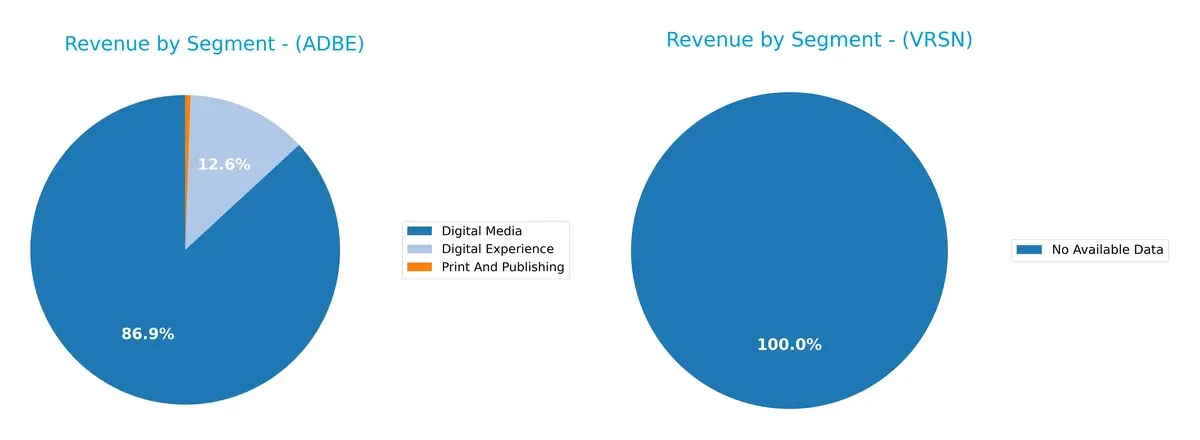
Adobe Inc. leans heavily on Digital Media, generating $40.4B in 2025, dwarfing its Digital Experience segment at $5.9B. Print and Publishing remains a minor contributor at $256M. VeriSign, Inc. presents no available data for segmentation analysis. Adobe’s concentration in Digital Media anchors its ecosystem dominance, but exposes it to concentration risk if that market faces disruption. Its growing Digital Experience segment hints at strategic diversification.
Strengths and Weaknesses Comparison
This table compares the Strengths and Weaknesses of Adobe Inc. and VeriSign, Inc.:
Adobe Inc. Strengths
- Strong profitability with 30% net margin and 61.34% ROE
- Favorable ROIC at 36.69% above WACC
- Diverse revenue streams from Digital Media and Digital Experience
- Solid global presence, especially in Americas and EMEA
- Favorable debt-to-assets ratio at 22.54%
- High fixed asset turnover at 10.88
VeriSign, Inc. Strengths
- Excellent net margin at 57.68%
- Favorable WACC at 7.02% below Adobe’s
- High asset and fixed asset turnover ratios
- Favorable debt-to-equity ratio and interest coverage
- Diversified global revenues including US, EMEA, Asia Pacific
- Positive price-to-book ratio
Adobe Inc. Weaknesses
- Unfavorable WACC at 10.49% above ROIC
- High price-to-book ratio at 11.73 suggests premium valuation
- Current ratio at 1.0 signals tight liquidity
- No dividend yield
- Moderate debt-to-equity ratio at 0.57
VeriSign, Inc. Weaknesses
- Negative ROE and ROIC indicate poor capital efficiency
- Very high debt-to-assets at 265.55%
- Low current and quick ratios at 0.49 indicate liquidity risk
- Negative debt-to-equity ratio is a red flag
- Slight dividend yield but unfavorable
Adobe’s strengths lie in robust profitability and diversified revenue with solid global reach. However, elevated valuation multiples and tight liquidity pose challenges. VeriSign excels in margin efficiency and asset utilization but suffers from poor returns on capital and high leverage. These contrasts highlight differing capital allocation and financial health profiles, crucial for strategic planning.
The Moat Duel: Analyzing Competitive Defensibility
A structural moat protects long-term profits from relentless competition erosion. Without it, sustainable growth fades quickly. Let’s examine two tech giants’ competitive moats:
Adobe Inc.: Subscription Powerhouse with Intangible Assets
Adobe’s moat stems from its Creative Cloud subscription model and brand reputation. Its high ROIC (26%) and stable margins reflect efficient capital use. Innovations in Digital Experience deepen this moat in 2026.
VeriSign, Inc.: Network Effects under Pressure
VeriSign’s moat relies on domain registry network effects and internet infrastructure dominance. However, its negative ROIC trend signals weakening profitability. Growth opportunities exist but face disruption risks in evolving internet governance.
Subscription Dominance vs. Network Effect Durability
Adobe’s growing ROIC and strong value creation give it a wider, deeper moat. VeriSign’s declining profitability warns of vulnerability. Adobe is better equipped to defend market share amid intensifying competition.
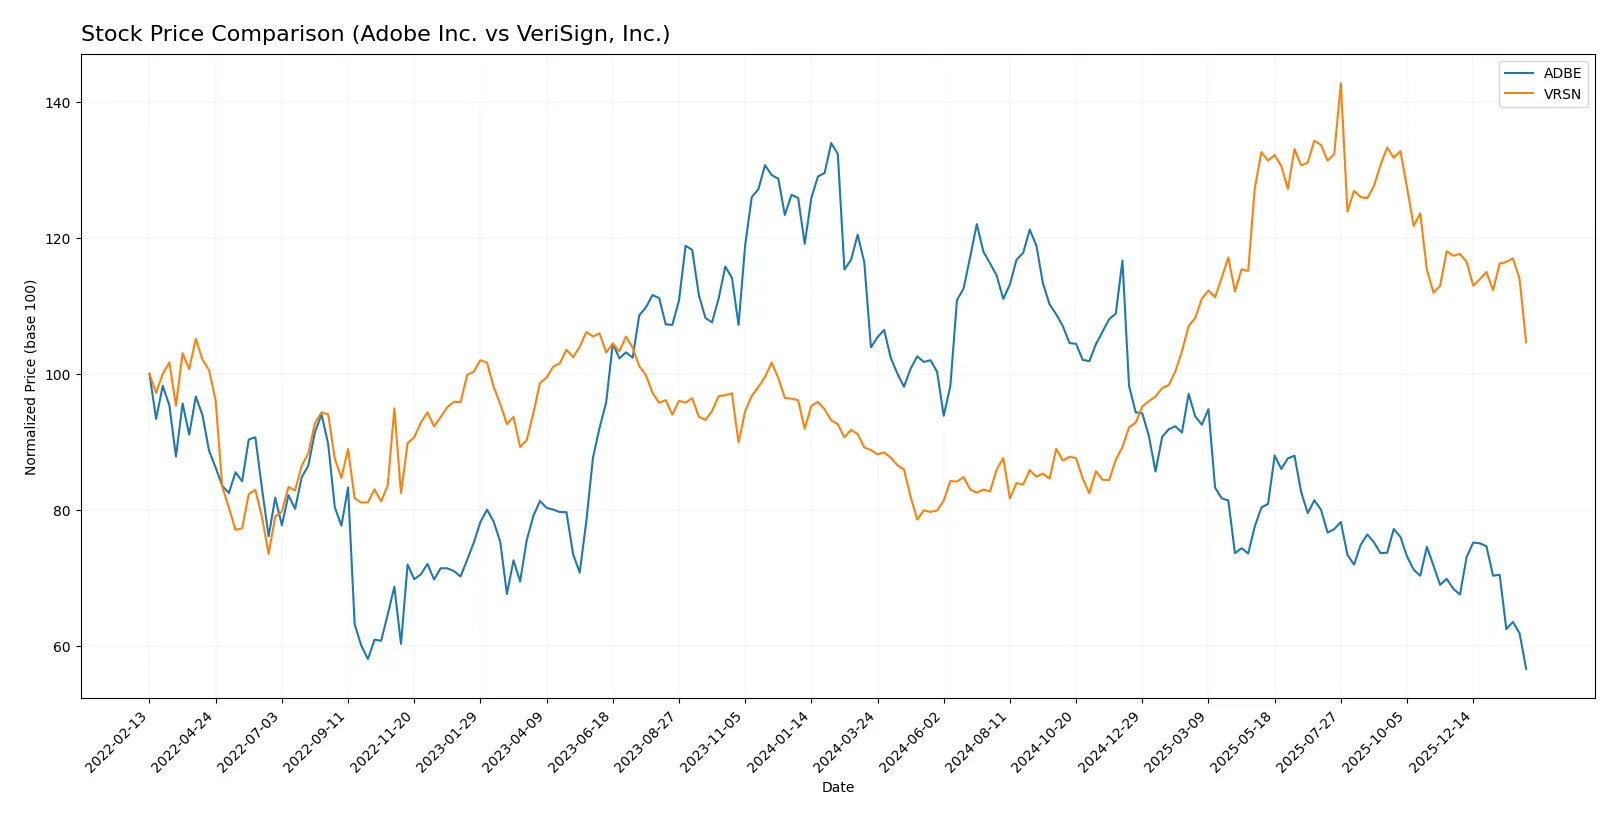
Which stock offers better returns?
Over the past year, Adobe Inc. experienced a sharp price decline, while VeriSign, Inc. showed moderate gains despite recent pullbacks, reflecting contrasting trading dynamics and investor sentiment.
Trend Comparison
Adobe Inc. shows a bearish trend over the past 12 months with a -45.5% price drop and decelerating losses. It reached a high of 578.34 and a low of 268.38, indicating high volatility.
VeriSign, Inc. exhibits a bullish trend over the same period with a 17.83% price increase but recent deceleration. Its price ranged between 168.32 and 305.79, signaling moderate volatility.
VeriSign, Inc. outperformed Adobe Inc. over the past year, delivering positive returns compared to Adobe’s substantial losses.
Target Prices
Analysts show a bullish consensus for Adobe Inc. and VeriSign, Inc., with targets well above current prices.
| Company | Target Low | Target High | Consensus |
|---|---|---|---|
| Adobe Inc. | 280 | 500 | 386.76 |
| VeriSign, Inc. | 325 | 325 | 325 |
Adobe’s target consensus of 386.76 implies a 44% upside from the current 268.38 price, signaling strong growth expectations. VeriSign’s fixed target of 325 suggests a 45% potential gain versus its 224.17 stock price.

Don’t Let Luck Decide Your Entry Point
Optimize your entry points with our advanced ProRealTime indicators. You’ll get efficient buy signals with precise price targets for maximum performance. Start outperforming now!
How do institutions grade them?
Adobe Inc. Grades
The following table summarizes recent grades for Adobe Inc. from major grading companies.
| Grading Company | Action | New Grade | Date |
|---|---|---|---|
| Piper Sandler | Downgrade | Neutral | 2026-02-03 |
| UBS | Maintain | Neutral | 2026-01-26 |
| Oppenheimer | Downgrade | Perform | 2026-01-13 |
| BMO Capital | Downgrade | Market Perform | 2026-01-09 |
| Jefferies | Downgrade | Hold | 2026-01-05 |
| Citigroup | Maintain | Neutral | 2025-12-17 |
| Keybanc | Downgrade | Underweight | 2025-12-15 |
| BMO Capital | Maintain | Outperform | 2025-12-15 |
| Wolfe Research | Maintain | Outperform | 2025-12-11 |
| Jefferies | Maintain | Buy | 2025-12-11 |
VeriSign, Inc. Grades
Below is a summary of VeriSign, Inc.’s recent grades from recognized grading firms.
| Grading Company | Action | New Grade | Date |
|---|---|---|---|
| JP Morgan | Maintain | Neutral | 2026-01-06 |
| Baird | Maintain | Outperform | 2025-07-01 |
| Baird | Maintain | Outperform | 2025-04-25 |
| Baird | Maintain | Outperform | 2025-04-01 |
| Citigroup | Maintain | Buy | 2025-02-04 |
| Citigroup | Maintain | Buy | 2025-01-03 |
| Baird | Upgrade | Outperform | 2024-12-09 |
| Baird | Maintain | Neutral | 2024-06-27 |
| Baird | Maintain | Neutral | 2024-04-26 |
| Citigroup | Maintain | Buy | 2024-04-02 |
Which company has the best grades?
VeriSign, Inc. consistently receives Outperform and Buy grades with few downgrades. Adobe Inc. shows multiple downgrades and more Neutral or Hold ratings. Investors may view VeriSign’s stronger grades as a signal of greater confidence from analysts.
Risks specific to each company
The following categories identify critical pressure points and systemic threats facing Adobe Inc. and VeriSign, Inc. in the challenging 2026 market environment:
1. Market & Competition
Adobe Inc.
- Faces intense competition in diversified software and digital media markets, requiring continuous innovation and customer retention.
VeriSign, Inc.
- Operates in a niche domain registry market with high entry barriers but faces pressure from alternative internet infrastructure solutions.
2. Capital Structure & Debt
Adobe Inc.
- Maintains moderate debt with a 0.57 debt-to-equity ratio and strong interest coverage, though current ratio of 1.0 signals tight liquidity.
VeriSign, Inc.
- Exhibits highly leveraged position with negative debt-to-equity and excessive debt-to-assets ratio (265.55%), signaling financial risk and potential distress.
3. Stock Volatility
Adobe Inc.
- Higher beta (1.515) indicates greater stock price volatility relative to the market, reflecting sensitivity to tech sector cycles.
VeriSign, Inc.
- Lower beta (0.75) suggests less volatility and defensive characteristics, partly due to monopolistic domain registry services.
4. Regulatory & Legal
Adobe Inc.
- Subject to software licensing, data privacy, and antitrust scrutiny, which could increase compliance costs and litigation risks.
VeriSign, Inc.
- Faces regulatory oversight over domain registry operations and internet infrastructure, with potential risks from evolving cybersecurity laws.
5. Supply Chain & Operations
Adobe Inc.
- Relies on cloud infrastructure and global distribution partners; operational disruptions or service outages could impact revenue.
VeriSign, Inc.
- Operates critical internet infrastructure; operational stability is paramount but risks from technological obsolescence and cyber threats persist.
6. ESG & Climate Transition
Adobe Inc.
- Faces pressure to improve environmental footprint of data centers and software lifecycle; ESG performance impacts brand and investment appeal.
VeriSign, Inc.
- ESG risks are moderate but include energy use of root servers and governance transparency in managing internet infrastructure.
7. Geopolitical Exposure
Adobe Inc.
- Exposure to global markets subjects it to geopolitical tensions, trade policies, and cross-border data regulations.
VeriSign, Inc.
- Limited direct international revenue but geopolitical risks include internet governance disputes and cyberwarfare impacting domain services.
Which company shows a better risk-adjusted profile?
Adobe’s main risk lies in liquidity and market competition, but it boasts a strong Altman Z-score (7.78) signaling financial safety. VeriSign suffers from severe capital structure weaknesses, reflected in its distress-zone Altman Z-score (-12.09), despite strong operational efficiency. Adobe presents a better risk-adjusted profile amid 2026 uncertainties.
Adobe’s tight current ratio and high beta raise caution, yet its robust profitability and financial stability mitigate these concerns. VeriSign’s excessive debt and negative equity metrics pose solvency risks that overshadow its niche market strength. The stark contrast in financial health underscores Adobe’s relative safety despite competitive pressures.
Final Verdict: Which stock to choose?
Adobe Inc. wields unmatched capital efficiency and a robust moat, generating strong returns well above its cost of capital. Its main point of vigilance lies in a tight liquidity position, which could pressure short-term flexibility. It suits portfolios seeking aggressive growth fueled by innovation and scale.
VeriSign, Inc. benefits from a strategic moat rooted in its essential internet infrastructure and recurring revenue model, offering a unique safety profile. However, it faces challenges in declining profitability and financial distress indicators. It fits investors focused on GARP strategies that value steady cash flow with measured risk.
If you prioritize sustainable value creation and strong profitability, Adobe outshines with its superior ROIC and growing competitive advantage. However, if you seek exposure to critical internet services with recurring revenue, VeriSign offers better stability despite financial headwinds. Each represents an analytical scenario tailored to distinct investor profiles.
Disclaimer: Investment carries a risk of loss of initial capital. The past performance is not a reliable indicator of future results. Be sure to understand risks before making an investment decision.
Go Further
I encourage you to read the complete analyses of Adobe Inc. and VeriSign, Inc. to enhance your investment decisions: