Home > Comparison > Technology > ADBE vs PATH
The strategic rivalry between Adobe Inc. and UiPath Inc. shapes the evolution of the technology sector’s software infrastructure landscape. Adobe operates as a diversified software titan with a broad portfolio spanning digital media and experience platforms. UiPath, in contrast, specializes in robotic process automation, delivering focused, AI-driven workflow solutions. This analysis aims to identify which company’s growth trajectory and capital efficiency offer a superior risk-adjusted return for a diversified portfolio.
Table of contents
Companies Overview
Adobe Inc. and UiPath Inc. are pivotal players in the software infrastructure space, shaping digital transformation globally.
Adobe Inc.: Creative and Digital Experience Powerhouse
Adobe dominates as a diversified software company with a market cap of 123B. Its core revenue derives from Digital Media, particularly the subscription-based Creative Cloud, serving creators and enterprises. In 2026, Adobe focuses intensely on expanding its Digital Experience segment, aiming to optimize customer journeys through integrated analytics and commerce solutions.
UiPath Inc.: Automation Innovator
UiPath leads the robotic process automation (RPA) market with a 6.7B market cap. It generates revenue through its end-to-end automation platform combining AI and low-code tools for enterprises. In 2026, UiPath prioritizes enhancing centralized governance and scalability of its automation solutions across sectors like banking and healthcare, driving efficiency at scale.
Strategic Collision: Similarities & Divergences
Both companies operate in software infrastructure but differ fundamentally. Adobe embraces a broad creative and enterprise ecosystem, while UiPath pursues a specialized automation niche. Their key battleground lies in enterprise digital transformation, with Adobe focusing on content and experience, and UiPath on operational automation. Investors face distinct risk profiles: Adobe’s scale and diversification contrast with UiPath’s growth-oriented, innovation-driven model.
Income Statement Comparison
This data dissects the core profitability and scalability of both corporate engines to reveal who dominates the bottom line:
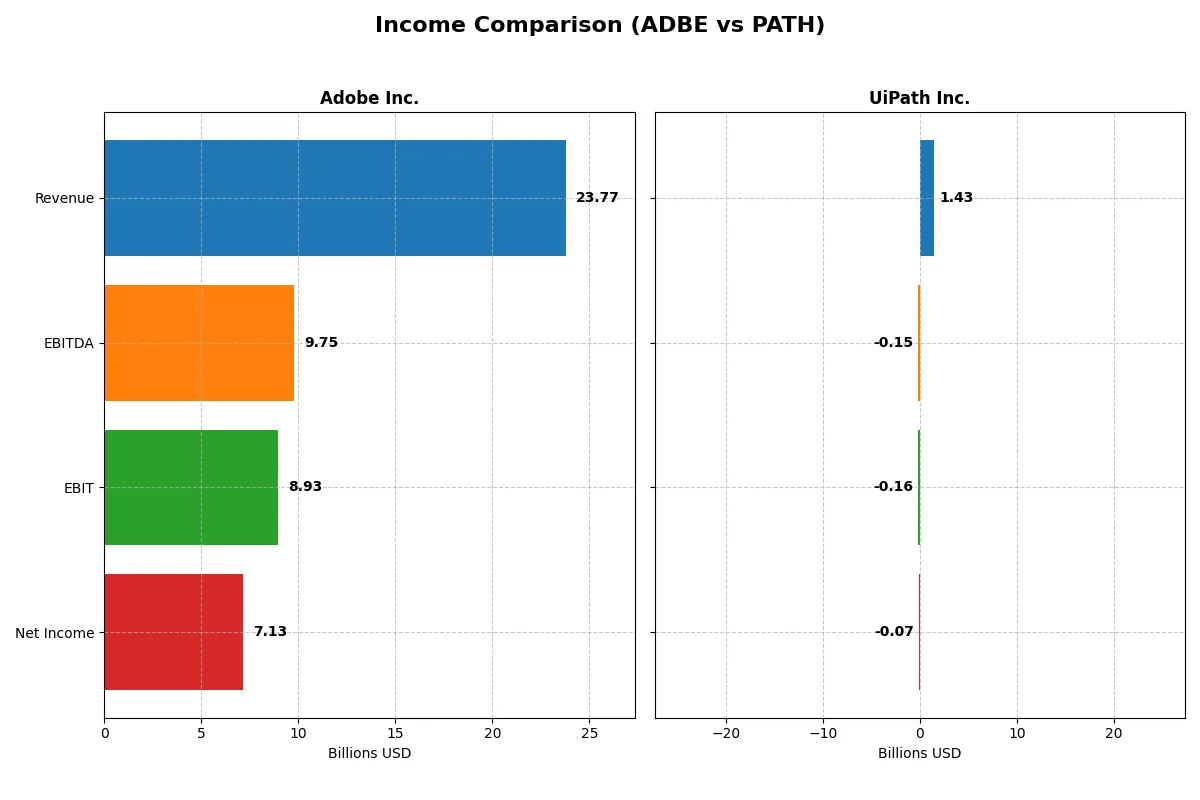
| Metric | Adobe Inc. (ADBE) | UiPath Inc. (PATH) |
|---|---|---|
| Revenue | 23.8B | 1.43B |
| Cost of Revenue | 2.71B | 247M |
| Operating Expenses | 12.4B | 1.35B |
| Gross Profit | 21.1B | 1.18B |
| EBITDA | 9.75B | -145M |
| EBIT | 8.93B | -163M |
| Interest Expense | 263M | 0 |
| Net Income | 7.13B | -74M |
| EPS | 16.73 | -0.13 |
| Fiscal Year | 2025 | 2025 |
Income Statement Analysis: The Bottom-Line Duel
This income statement comparison exposes which company drives superior profitability and operational strength through recent financial trends.
Adobe Inc. Analysis
Adobe’s revenue climbed steadily from 15.8B in 2021 to 23.8B in 2025, supporting robust net income growth from 4.8B to 7.1B. The company maintains an impressive gross margin near 89%, reflecting strong cost control. Its 30% net margin and 37.6% EBIT margin in 2025 demonstrate efficient scaling and healthy profitability momentum.
UiPath Inc. Analysis
UiPath’s revenue more than doubled from 608M in 2021 to 1.43B in 2025, showing rapid top-line expansion. Despite this, it remains unprofitable with a net loss of 74M in 2025, though net margin improved to -5.15%. Gross margin stays solid at 82.7%, but negative EBIT margin at -11.4% signals ongoing operational challenges.
Margin Mastery vs. Growth Ambition
Adobe clearly leads with consistent profits and superior margins, reflecting operational efficiency and scale. UiPath impresses with faster revenue growth but struggles to convert scale into profits. For investors prioritizing profitability and margin stability, Adobe’s profile offers clearer fundamental strength. UiPath suits those targeting high-growth potential amid continued losses.
Financial Ratios Comparison
These vital ratios act as a diagnostic tool to expose the underlying fiscal health, valuation premiums, and capital efficiency of the compared companies:
| Ratios | Adobe Inc. (ADBE) | UiPath Inc. (PATH) |
|---|---|---|
| ROE | 61.3% | -4.0% |
| ROIC | 36.7% | -7.4% |
| P/E | 19.1 | -108.0 |
| P/B | 11.7 | 4.3 |
| Current Ratio | 1.0 | 2.9 |
| Quick Ratio | 1.0 | 2.9 |
| D/E (Debt-to-Equity) | 0.57 | 0.04 |
| Debt-to-Assets | 22.5% | 2.7% |
| Interest Coverage | 33.1 | 0 |
| Asset Turnover | 0.81 | 0.50 |
| Fixed Asset Turnover | 10.9 | 14.4 |
| Payout Ratio | 0 | 0 |
| Dividend Yield | 0 | 0 |
| Fiscal Year | 2025 | 2025 |
Efficiency & Valuation Duel: The Vital Signs
Financial ratios form the company’s DNA, exposing hidden risks and revealing operational excellence beneath headline figures.
Adobe Inc.
Adobe posts a stellar 61.3% ROE and a robust 30% net margin, highlighting exceptional profitability. The P/E of 19.1 suggests a fairly valued stock, neither stretched nor deeply discounted. Adobe lacks dividends but invests heavily in R&D, fueling innovation and sustainable growth. However, a current ratio near 1.0 signals tight short-term liquidity.
UiPath Inc.
UiPath shows negative returns: a -3.99% ROE and -5.15% net margin indicate consistent losses. Its P/E ratio is negative yet flagged favorable due to accounting treatment. The firm’s strong current ratio of 2.93 reflects ample liquidity. No dividends exist; reinvestment focuses heavily on R&D to drive future growth. High debt coverage risk remains a concern.
Profitability Strength vs. Liquidity Cushion
Adobe delivers superior profitability with balanced valuation, though liquidity tightness is a mild risk. UiPath offers strong liquidity but suffers persistent unprofitability and operational inefficiencies. Investors seeking stable returns may prefer Adobe, while those prioritizing liquidity and growth potential might lean toward UiPath’s riskier profile.
Which one offers the Superior Shareholder Reward?
I observe Adobe Inc. (ADBE) opts for zero dividends but generates robust free cash flow of 23B, fueling aggressive share buybacks that enhance shareholder value. UiPath Inc. (PATH) pays no dividends either but struggles with negative net margins and modest free cash flow (~0.5B), limiting buyback capacity. Adobe’s distribution model, supported by strong margins and cash conversion, is more sustainable and superior in total return for 2026 investors.
Comparative Score Analysis: The Strategic Profile
The radar chart reveals the fundamental DNA and trade-offs of Adobe Inc. and UiPath Inc., highlighting their strategic strengths and weaknesses:
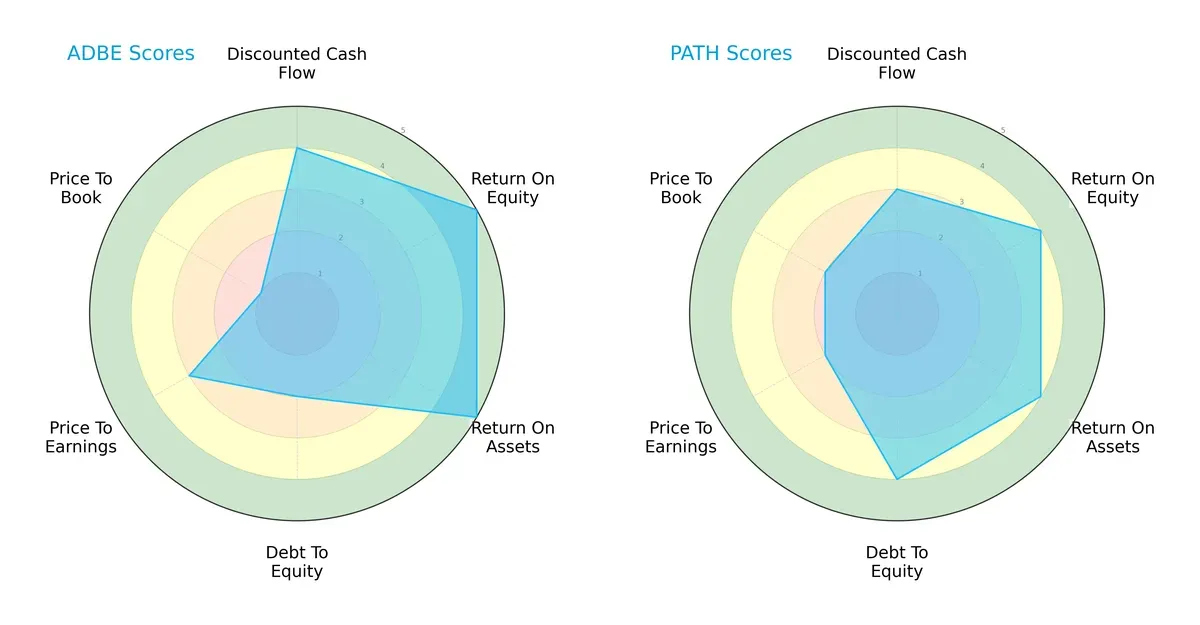
Adobe displays a stronger operational efficiency with top ROE and ROA scores of 5 each, signifying superior asset and equity utilization. However, it suffers from a weaker debt-to-equity position at 2, indicating higher financial leverage risk. UiPath balances its profile more evenly, with moderate scores across DCF, ROE, and debt-to-equity, leaning on financial stability rather than operational dominance. Adobe’s valuation metrics lag, especially its price-to-book score of 1, signaling potential overvaluation compared to UiPath.
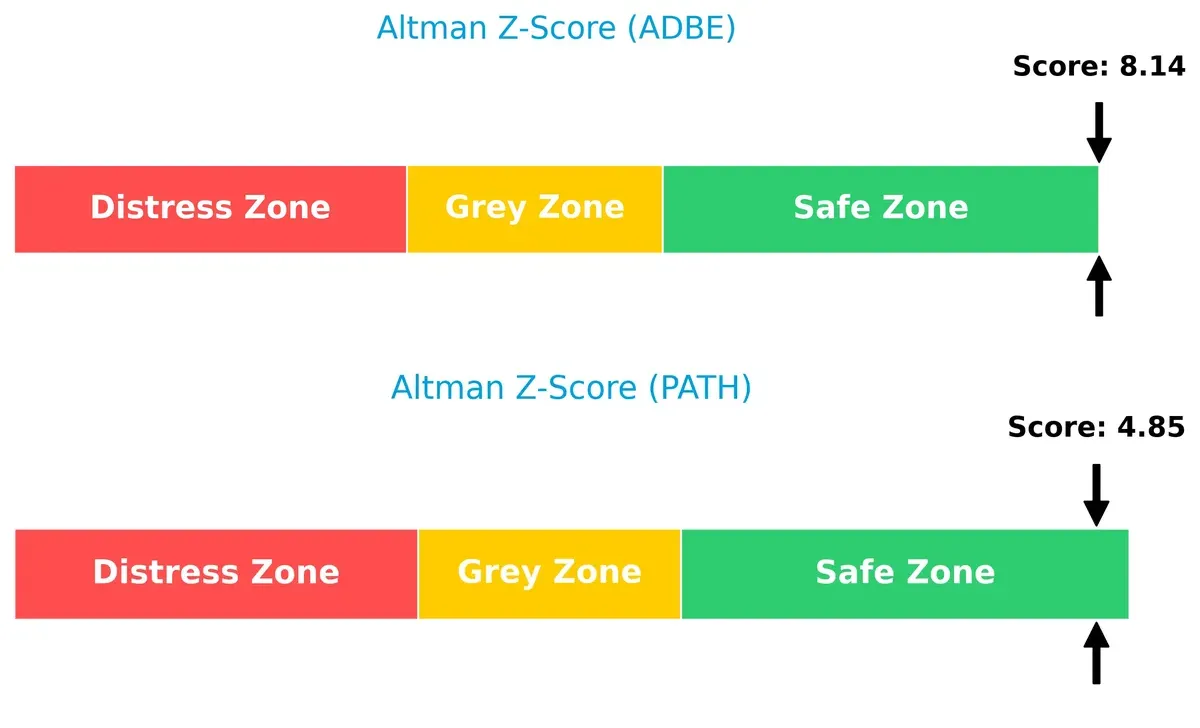
Bankruptcy Risk: Solvency Showdown
The Altman Z-Score gap reveals Adobe’s superior solvency, scoring 8.14 versus UiPath’s 4.85, both in the safe zone but with Adobe far more insulated from bankruptcy risk in this cycle:
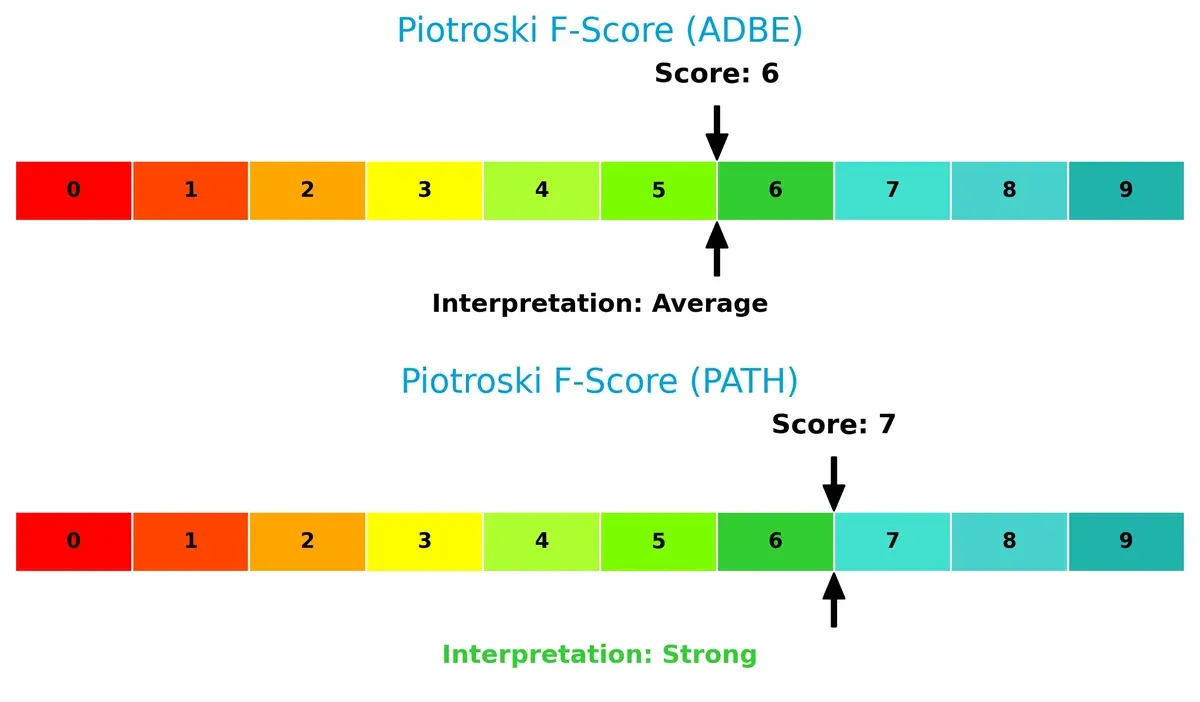
Financial Health: Quality of Operations
UiPath’s Piotroski score of 7 indicates stronger internal financial health compared to Adobe’s 6, suggesting UiPath maintains better profitability, liquidity, and efficiency metrics despite Adobe’s operational advantages:
How are the two companies positioned?
This section dissects the operational DNA of Adobe and UiPath by comparing their revenue distribution and internal dynamics. The goal is to confront their economic moats to identify which model offers the most resilient competitive advantage today.
Revenue Segmentation: The Strategic Mix
The following visual comparison dissects how Adobe Inc. and UiPath Inc. diversify their income streams and where their primary sector bets lie:
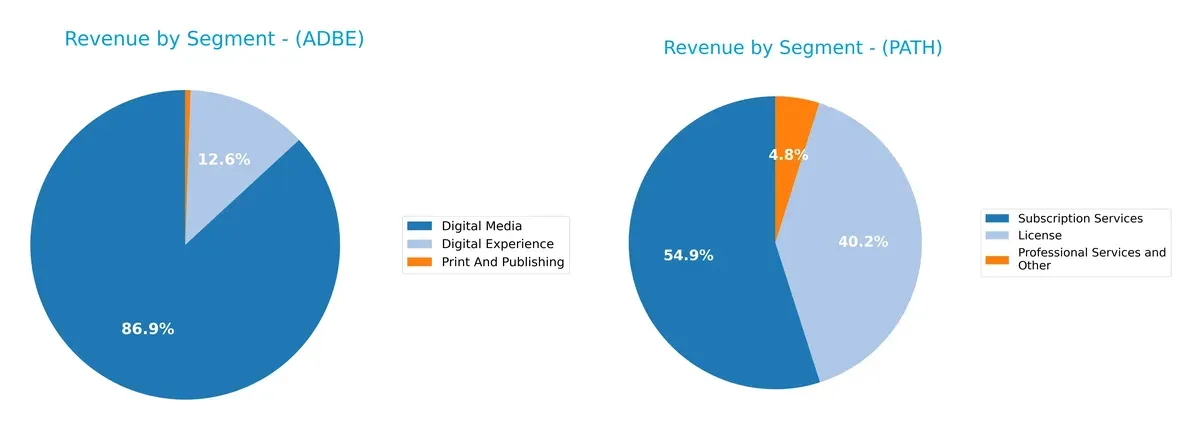
Adobe Inc. dwarfs UiPath with $40.4B in Digital Media, anchoring its revenue heavily in this segment. UiPath shows a more balanced mix, splitting $801M in Subscription and $587M in License revenues. Adobe’s reliance on Digital Media signals strong ecosystem lock-in, while UiPath’s diversified streams reduce concentration risk but highlight dependency on subscription growth for scale.
Strengths and Weaknesses Comparison
This table compares the Strengths and Weaknesses of Adobe Inc. and UiPath Inc.:
Adobe Inc. Strengths
- Strong profitability with 30% net margin and 61.3% ROE
- Favorable debt-to-assets at 22.5% supports financial stability
- Robust global presence, $14.1B Americas revenue and $6.3B EMEA in 2025
- Diverse revenue streams: $5.9B Digital Experience and $40.4B Digital Media in 2025
- High fixed asset turnover at 10.9 indicates efficient asset use
UiPath Inc. Strengths
- Strong liquidity with 2.93 current and quick ratios supports short-term stability
- Low leverage with 0.04 debt-to-equity and 2.7% debt-to-assets indicates conservative balance sheet
- Favorable fixed asset turnover at 14.4 shows asset efficiency
- Growing global footprint with $695M Americas and $458M EMEA revenues in 2025
- Balanced revenue from License $587M and Subscription $802M segments
Adobe Inc. Weaknesses
- Unfavorable WACC at 10.6%, exceeding ROIC may pressure capital returns
- Low current ratio of 1.0 flags potential liquidity constraints
- High price-to-book at 11.7 suggests premium valuation risk
- Zero dividend yield limits income appeal
- Neutral asset turnover at 0.81 signals moderate operational efficiency
UiPath Inc. Weaknesses
- Negative profitability metrics: -5.15% net margin, -3.99% ROE, -7.41% ROIC reflect losses
- Interest coverage at zero raises solvency concerns
- Unfavorable asset turnover at 0.5 indicates less efficient asset use
- Unfavorable price-to-book at 4.31 may imply valuation challenges
- Zero dividend yield offers no income return
Adobe exhibits strong profitability and global scale but faces liquidity and valuation risks. UiPath shows solid liquidity and asset efficiency yet struggles with profitability and solvency. These contrasts shape their strategic priorities going forward.
The Moat Duel: Analyzing Competitive Defensibility
A structural moat is the sole safeguard for long-term profits against relentless competition erosion. Let’s dissect the battleground:
Adobe Inc.: Subscription Powerhouse with Intangible Assets
Adobe’s moat stems from its intangible assets, primarily its Creative Cloud ecosystem. This drives high ROIC near 26%, showcasing margin stability and value creation. Expansion in digital experience deepens this moat in 2026.
UiPath Inc.: Growth-Stage Automation Innovator
UiPath relies on rapid innovation and growing automation adoption, contrasting Adobe’s entrenched ecosystem. Despite a negative ROIC vs. WACC, its rising profitability and platform expansion signal potential but an unproven moat depth.
Moat Strength Showdown: Intangible Assets vs. Innovation Momentum
Adobe holds the deeper moat, proven by robust ROIC and durable competitive advantage. UiPath’s growth is promising but currently lacks the profit efficiency to defend market share long term.
Which stock offers better returns?
Both Adobe Inc. and UiPath Inc. experienced significant price declines over the past 12 months, reflecting bearish trends with decelerating momentum and notable volatility in their trading dynamics.
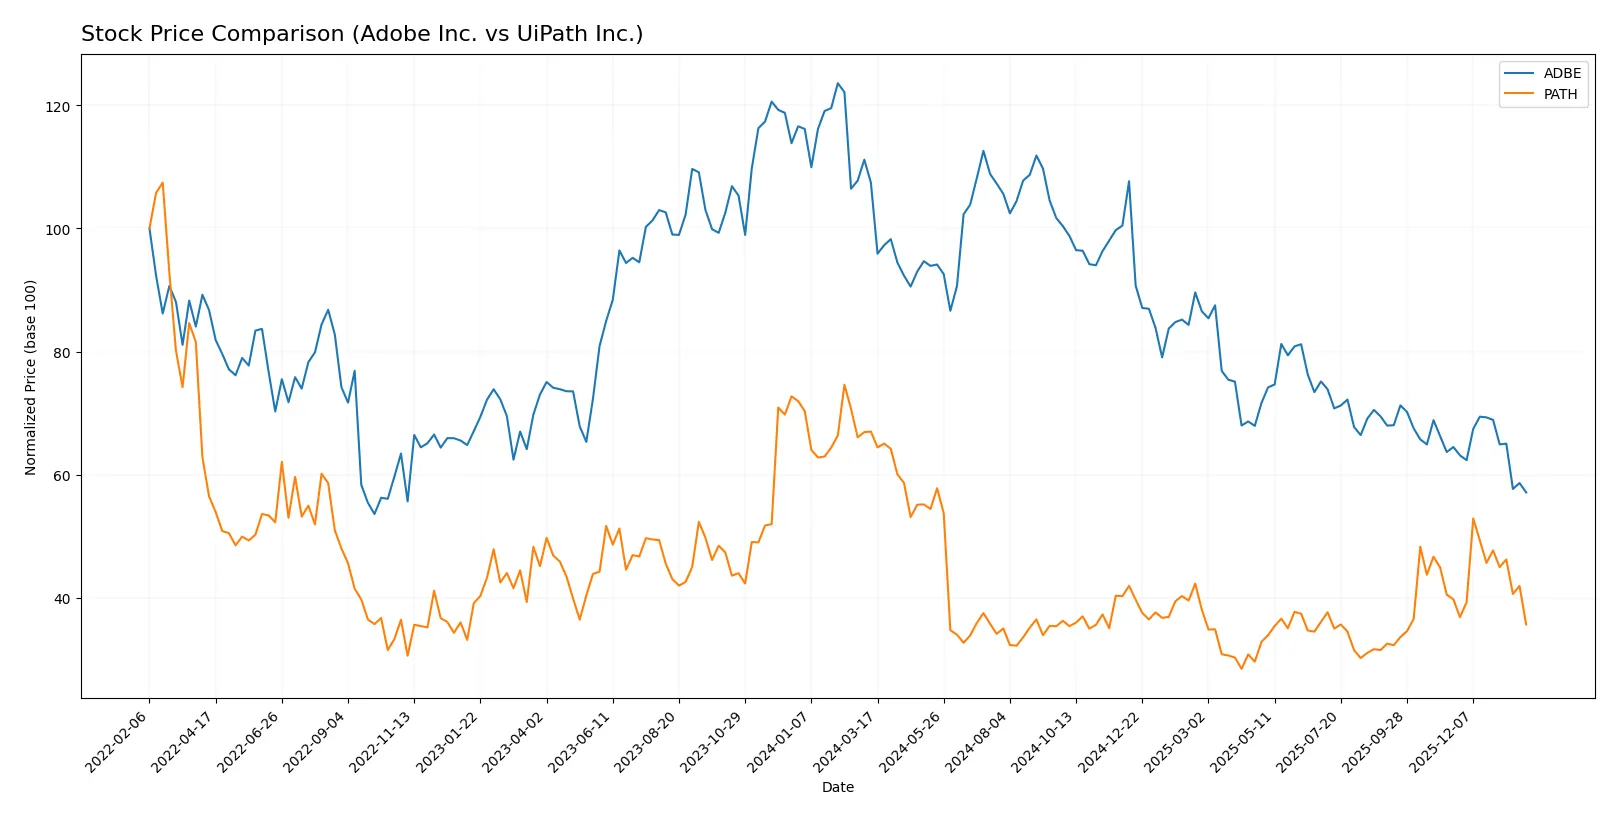
Trend Comparison
Adobe Inc. shows a 46.85% price drop over the past year, marking a bearish trend with decelerating losses. The stock ranged from a high of 578.34 to a low of 293.25, with volatility reflected in a high standard deviation of 78.57.
UiPath Inc. recorded a 46.79% decline over the same period, also bearish with deceleration. Its price fluctuated between 23.66 and 10.04, and exhibited much lower volatility with a standard deviation of 3.05.
Both stocks suffered similar steep losses, but Adobe’s higher volatility contrasts with UiPath’s steadier price movement. Adobe’s decline is marginally greater, indicating slightly weaker market performance.
Target Prices
Analysts show a bullish consensus on Adobe Inc. and UiPath Inc., indicating potential upside from current prices.
| Company | Target Low | Target High | Consensus |
|---|---|---|---|
| Adobe Inc. | 280 | 500 | 390.31 |
| UiPath Inc. | 14 | 19 | 16.6 |
Adobe’s target consensus at 390.31 suggests a significant premium to its 293.25 price, reflecting confidence in its moat. UiPath’s 16.6 target also exceeds its 12.59 price, signaling growth expectations despite recent volatility.

Don’t Let Luck Decide Your Entry Point
Optimize your entry points with our advanced ProRealTime indicators. You’ll get efficient buy signals with precise price targets for maximum performance. Start outperforming now!
How do institutions grade them?
Adobe Inc. Grades
The following table shows recent grades from major financial institutions for Adobe Inc.:
| Grading Company | Action | New Grade | Date |
|---|---|---|---|
| UBS | Maintain | Neutral | 2026-01-26 |
| Oppenheimer | Downgrade | Perform | 2026-01-13 |
| BMO Capital | Downgrade | Market Perform | 2026-01-09 |
| Jefferies | Downgrade | Hold | 2026-01-05 |
| Citigroup | Maintain | Neutral | 2025-12-17 |
| BMO Capital | Maintain | Outperform | 2025-12-15 |
| Keybanc | Downgrade | Underweight | 2025-12-15 |
| Wolfe Research | Maintain | Outperform | 2025-12-11 |
| TD Cowen | Maintain | Hold | 2025-12-11 |
| Oppenheimer | Maintain | Outperform | 2025-12-11 |
UiPath Inc. Grades
Below are recent institutional grades for UiPath Inc. from recognized analysts:
| Grading Company | Action | New Grade | Date |
|---|---|---|---|
| Barclays | Maintain | Equal Weight | 2026-01-12 |
| RBC Capital | Maintain | Sector Perform | 2026-01-05 |
| RBC Capital | Maintain | Sector Perform | 2025-12-10 |
| Morgan Stanley | Maintain | Equal Weight | 2025-12-09 |
| DA Davidson | Maintain | Neutral | 2025-12-05 |
| Evercore ISI Group | Maintain | In Line | 2025-12-04 |
| Needham | Maintain | Hold | 2025-12-04 |
| Canaccord Genuity | Maintain | Buy | 2025-12-04 |
| BMO Capital | Maintain | Market Perform | 2025-12-04 |
| RBC Capital | Maintain | Sector Perform | 2025-12-04 |
Which company has the best grades?
Adobe Inc. shows a mix of downgrades and maintained ratings, mostly clustered around Neutral to Outperform. UiPath Inc. maintains stable ratings, mostly Sector Perform and Equal Weight, with a Buy from Canaccord Genuity. Adobe’s grades reflect recent caution, while UiPath’s steady ratings suggest consistent analyst confidence. Investors could interpret Adobe’s downgrades as signals of increased risk or valuation concerns.
Risks specific to each company
The following categories identify the critical pressure points and systemic threats facing both firms in the 2026 market environment:
1. Market & Competition
Adobe Inc.
- Dominates with a 122B market cap in diversified software, benefiting from strong brand loyalty and established enterprise relations.
UiPath Inc.
- Smaller 6.7B market cap with niche RPA focus; faces intense competition and pressure to scale rapidly.
2. Capital Structure & Debt
Adobe Inc.
- Moderate leverage (D/E 0.57), manageable debt-to-assets at 22.5%, and strong interest coverage (33.96x) indicate solid financial footing.
UiPath Inc.
- Very low leverage (D/E 0.04), minimal debt-to-assets (2.7%), but interest coverage at zero signals potential earnings pressure.
3. Stock Volatility
Adobe Inc.
- Higher beta at 1.53 suggests more sensitivity to market swings, reflecting growth stock characteristics.
UiPath Inc.
- Lower beta at 1.08 indicates less volatility but recent price dropped nearly 5%, showing near-term instability.
4. Regulatory & Legal
Adobe Inc.
- Operates globally with varied data privacy and IP regulations, but scale mitigates isolated legal risks.
UiPath Inc.
- Emerging RPA sector faces evolving regulatory scrutiny, especially around AI and automation ethics.
5. Supply Chain & Operations
Adobe Inc.
- Cloud-based delivery reduces physical supply chain risk; operational scale supports resilience.
UiPath Inc.
- Heavy reliance on software platforms and integration partners; operational complexity increases execution risk.
6. ESG & Climate Transition
Adobe Inc.
- Public ESG commitments and sustainability reporting align with investor expectations; moderate risk.
UiPath Inc.
- Smaller footprint but less established ESG framework could pose challenges as investor scrutiny increases.
7. Geopolitical Exposure
Adobe Inc.
- Global presence exposes firm to US-China tensions and data sovereignty laws but diversified markets reduce concentration risk.
UiPath Inc.
- Concentrated in US, Romania, Japan; geopolitical shifts in these regions may disrupt growth plans.
Which company shows a better risk-adjusted profile?
Adobe’s dominant market position and financial strength offer resilience against market and credit risks. UiPath’s low leverage is a plus, but persistent losses and operational risks weigh heavily. Adobe’s high beta signals volatility, yet robust cash flow and interest coverage anchor stability. UiPath’s valuation and execution risks remain significant. Recent data show Adobe’s solid Altman Z-Score (8.1) and strong ROE (61%), while UiPath suffers negative profitability and zero interest coverage, raising red flags. Therefore, Adobe presents a superior risk-adjusted profile amidst 2026 market challenges.
Final Verdict: Which stock to choose?
Adobe Inc. wields a superpower in its durable competitive advantage, consistently delivering high returns on invested capital well above its cost of capital. Its efficiency in capital allocation and strong profitability set it apart. A point of vigilance remains its tight liquidity position, which could constrain short-term flexibility. Adobe suits investors targeting aggressive growth with a solid moat.
UiPath Inc. offers a strategic moat rooted in its recurring revenue model and expanding automation footprint. Its conservative balance sheet and strong liquidity provide a safety cushion relative to Adobe’s lean working capital. However, profitability challenges and value destruction signal caution. UiPath fits portfolios seeking growth at a reasonable price with a tolerance for operational risk.
If you prioritize durable competitive advantage and proven capital efficiency, Adobe outshines as the compelling choice due to its strong value creation and scalability. However, if you seek growth exposure with better liquidity and a lower leverage profile, UiPath offers better stability despite ongoing profitability headwinds. Each presents a distinct analytical scenario tailored to specific investor risk appetites.
Disclaimer: Investment carries a risk of loss of initial capital. The past performance is not a reliable indicator of future results. Be sure to understand risks before making an investment decision.
Go Further
I encourage you to read the complete analyses of Adobe Inc. and UiPath Inc. to enhance your investment decisions: