Home > Comparison > Technology > ADBE vs TDC
The strategic rivalry between Adobe Inc. and Teradata Corporation shapes the evolution of the technology sector’s software infrastructure industry. Adobe operates a diversified, high-margin platform focused on digital media and experience, while Teradata emphasizes enterprise analytics with a capital-efficient multi-cloud data platform. This head-to-head pits innovation-driven growth against data-centric operational efficiency. This analysis aims to identify which company presents the superior risk-adjusted profile for a balanced, long-term portfolio.
Table of contents
Companies Overview
Adobe Inc. and Teradata Corporation stand as influential players in the software infrastructure landscape.
Adobe Inc.: Leading Creative and Experience Software Provider
Adobe commands a dominant market position in software infrastructure. Its core revenue derives from subscription services like Creative Cloud, which empower content creation and digital experience management. In 2026, Adobe focuses strategically on expanding its Digital Media and Digital Experience segments to capture evolving enterprise and consumer demands.
Teradata Corporation: Multi-Cloud Data Analytics Specialist
Teradata operates as a key provider of connected multi-cloud data platforms. It generates revenue primarily through Teradata Vantage, enabling enterprises to unify and analyze data across clouds. The company’s 2026 strategy centers on driving cloud migration and ecosystem simplification for clients spanning several industries worldwide.
Strategic Collision: Similarities & Divergences
Both companies thrive in software infrastructure but differ sharply in philosophy. Adobe pursues a content creation and experience-driven ecosystem, while Teradata champions open multi-cloud data integration and analytics. Their competition converges on enterprise digital transformation, though Adobe targets creative workflows, and Teradata focuses on data analytics infrastructure. This divergence shapes distinct risk and growth profiles for investors.
Income Statement Comparison
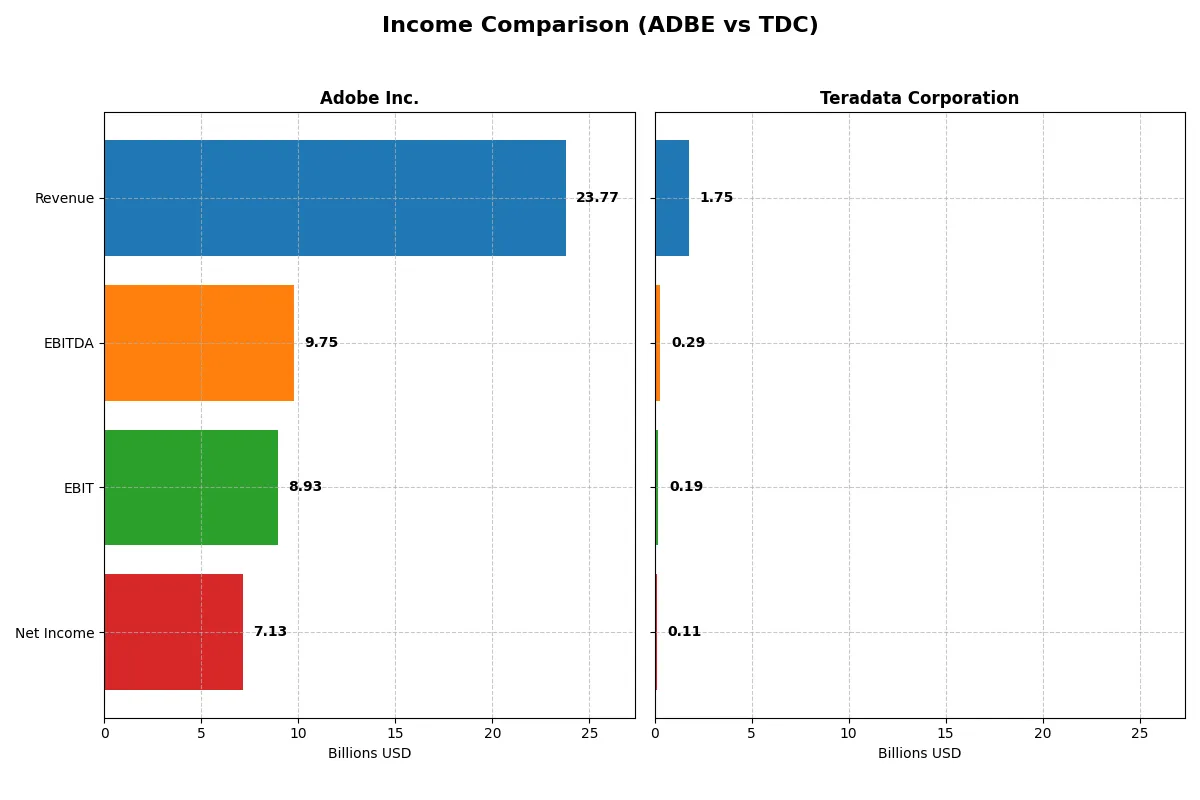
The following data dissects the core profitability and scalability of both corporate engines to reveal who dominates the bottom line:
| Metric | Adobe Inc. (ADBE) | Teradata Corporation (TDC) |
|---|---|---|
| Revenue | 23.8B | 1.75B |
| Cost of Revenue | 2.71B | 692M |
| Operating Expenses | 12.4B | 849M |
| Gross Profit | 21.1B | 1.06B |
| EBITDA | 9.75B | 293M |
| EBIT | 8.93B | 193M |
| Interest Expense | 263M | 29M |
| Net Income | 7.13B | 114M |
| EPS | 16.73 | 1.18 |
| Fiscal Year | 2025 | 2024 |
Income Statement Analysis: The Bottom-Line Duel
This income statement comparison reveals which company runs a leaner, more profitable engine driving shareholder value over recent years.
Adobe Inc. Analysis
Adobe’s revenue grew from 15.8B in 2021 to 23.8B in 2025, with net income surging from 4.8B to 7.1B. Its gross margin remains stellar at 88.6%, while net margin holds a robust 30%. The 2025 year shows strong momentum with a 10.5% revenue rise and 16% net margin expansion, reflecting exceptional operational efficiency.
Teradata Corporation Analysis
Teradata’s revenue declined from 1.9B in 2021 to 1.75B in 2024, with net income falling from 147M to 114M. Despite a lower gross margin of 60.5%, its net margin improved to 6.5%. The latest year saw a 4.5% revenue drop but a notable 92.6% net margin growth, driven by better cost control rather than top-line expansion.
Margin Leadership vs. Revenue Resilience
Adobe clearly outperforms Teradata in scale, margin strength, and growth consistency. Adobe’s 30% net margin dwarfs Teradata’s 6.5%, while Adobe’s revenue grew over 50% in five years, against Teradata’s nearly 5% decline. For investors, Adobe’s profile offers superior profitability combined with sustained growth, appealing to those prioritizing strong operational leverage.
Financial Ratios Comparison
These vital ratios act as a diagnostic tool to expose the underlying fiscal health, valuation premiums, and capital efficiency of the companies compared below:
| Ratios | Adobe Inc. (ADBE) | Teradata Corp. (TDC) |
|---|---|---|
| ROE | 61.3% | 85.7% |
| ROIC | 36.7% | 16.9% |
| P/E | 19.1 | 26.3 |
| P/B | 11.7 | 22.6 |
| Current Ratio | 1.00 | 0.81 |
| Quick Ratio | 1.00 | 0.79 |
| D/E (Debt-to-Equity) | 0.57 | 4.33 |
| Debt-to-Assets | 22.5% | 33.8% |
| Interest Coverage | 33.1 | 7.2 |
| Asset Turnover | 0.81 | 1.03 |
| Fixed Asset Turnover | 10.9 | 9.1 |
| Payout Ratio | 0% | 0% |
| Dividend Yield | 0% | 0% |
| Fiscal Year | 2025 | 2024 |
Efficiency & Valuation Duel: The Vital Signs
Financial ratios serve as a company’s DNA, exposing hidden risks and revealing its operational excellence and valuation strength.
Adobe Inc.
Adobe delivers robust profitability with a 61.34% ROE and a healthy 30% net margin, signaling excellent operational efficiency. Its P/E ratio of 19.13 appears reasonable, not stretched. However, a high price-to-book of 11.73 and a weak current ratio of 1.0 flag caution. Adobe reinvests heavily in R&D, foregoing dividends to fuel growth.
Teradata Corporation
Teradata posts an impressive 85.71% ROE but suffers a modest 6.51% net margin, reflecting lower profitability. Its P/E ratio at 26.34 and price-to-book of 22.58 suggest an expensive valuation. A weak liquidity position and high debt-to-equity ratio (4.33) increase financial risk. Like Adobe, Teradata pays no dividend, focusing on growth investments.
Premium Valuation vs. Operational Safety
Adobe offers a better balance between profitability and valuation, with more manageable debt and a solid reinvestment approach. Teradata’s high ROE contrasts with stretched multiples and weaker liquidity, raising risk. Investors favoring operational safety over speculative upside may lean toward Adobe’s profile.
Which one offers the Superior Shareholder Reward?
I see Adobe Inc. (ADBE) delivers superior shareholder reward compared to Teradata Corporation (TDC). Adobe pays no dividends but invests heavily in growth and maintains a robust free cash flow of 23.1B with near 100% FCF coverage, supporting sustainable buybacks. Teradata also pays no dividends and generates lower free cash flow of around 2.9B, with weaker cash flow coverage and higher financial leverage. Adobe’s aggressive buyback activity, superior margins (e.g., ~30% net margin vs. 6.5% for Teradata), and strong capital allocation suggest higher total return potential. I favor Adobe’s distribution model and long-term value creation in 2026.
Comparative Score Analysis: The Strategic Profile
The radar chart reveals the fundamental DNA and trade-offs of Adobe Inc. and Teradata Corporation, highlighting their core financial strengths and vulnerabilities:
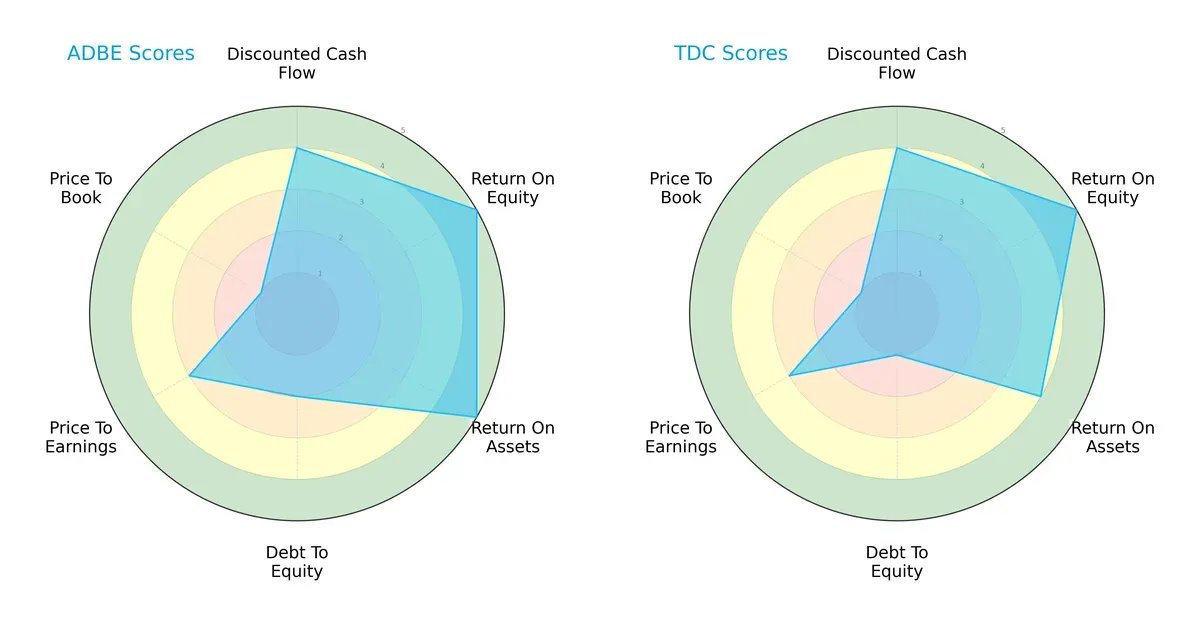
Adobe shows a more balanced profile with very favorable ROE and ROA scores, signaling efficient profit and asset use. Teradata matches Adobe’s ROE but lags slightly in ROA and overall score. Adobe’s moderate debt-to-equity contrasts with Teradata’s weaker balance sheet, indicating higher financial risk for Teradata. Both firms share moderate valuation metrics, but Adobe edges ahead with stronger operational efficiency.
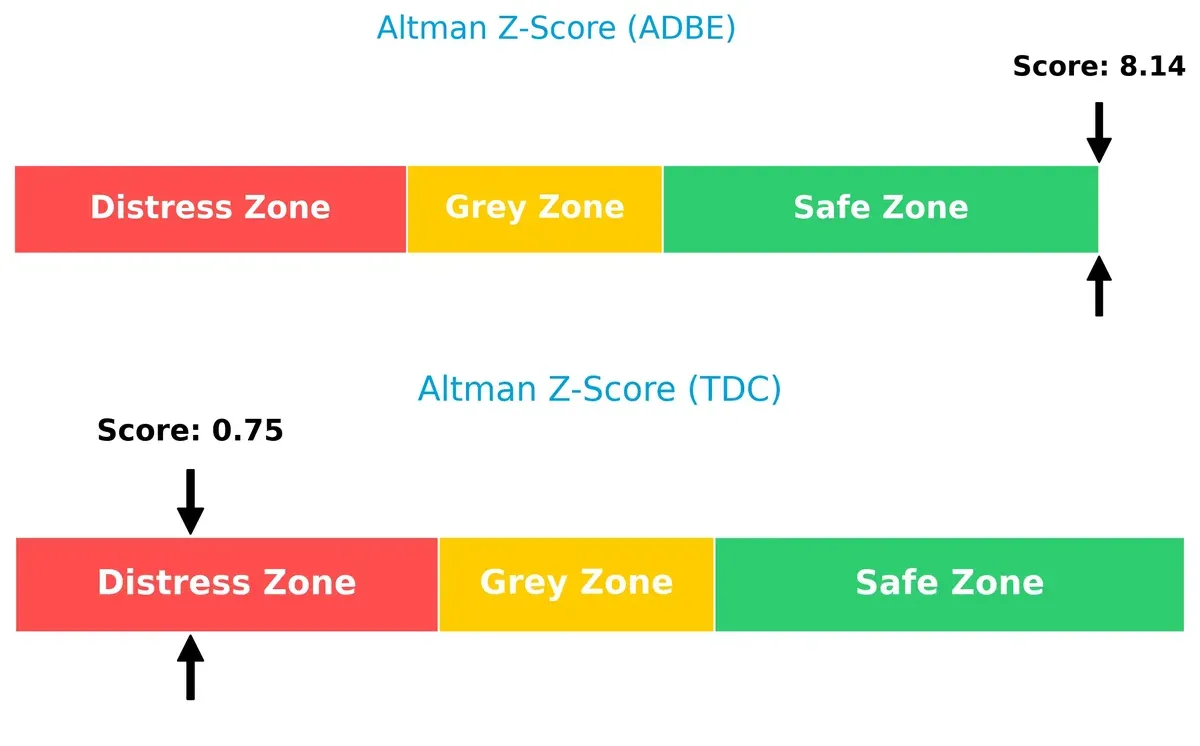
Bankruptcy Risk: Solvency Showdown
The Altman Z-Score difference signals vastly divergent bankruptcy risks: Adobe sits comfortably in the safe zone with 8.14, while Teradata’s 0.75 places it in distress, implying significant survival concerns in this cycle:
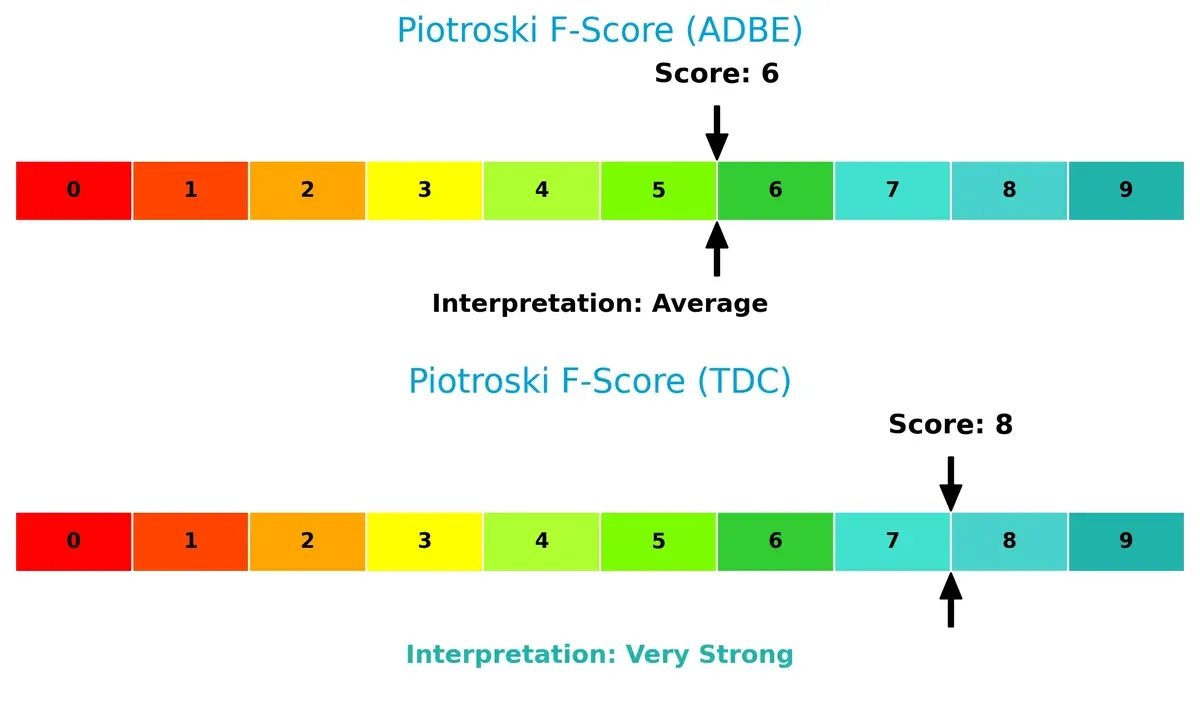
Financial Health: Quality of Operations
Teradata’s Piotroski score of 8 outperforms Adobe’s 6, indicating superior internal financial health and operational quality. Adobe’s average score suggests some caution, while Teradata demonstrates robust fundamentals:
How are the two companies positioned?
This section dissects Adobe and Teradata’s operational DNA by comparing their revenue distribution and internal dynamics. The goal is to confront their economic moats and reveal which model offers the most resilient competitive edge today.
Revenue Segmentation: The Strategic Mix
This visual comparison dissects how Adobe Inc. and Teradata Corporation diversify their income streams and reveals where their primary sector bets lie:
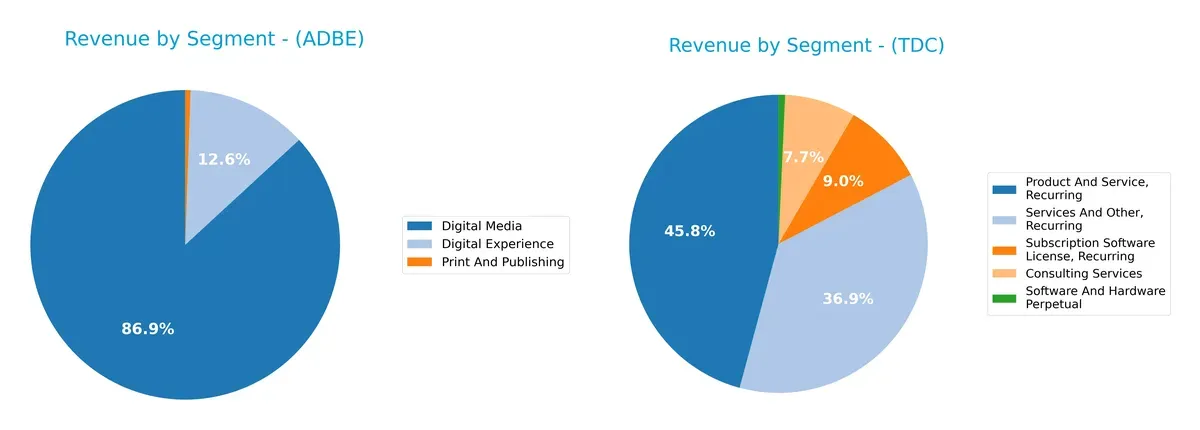
Adobe anchors revenue in Digital Media with $40.4B, while Digital Experience adds $5.9B and Print and Publishing $256M. Teradata spreads revenue more evenly, led by Product and Service Recurring at $1.48B, Services and Other Recurring at $1.19B, and Consulting Services at $248M. Adobe’s concentrated Digital Media dominance suggests ecosystem lock-in but higher segment risk. Teradata’s diversified mix lowers concentration risk but demands efficient integration across segments.
Strengths and Weaknesses Comparison
This table compares the strengths and weaknesses of Adobe Inc. and Teradata Corporation:
Adobe Inc. Strengths
- Strong profitability with 30% net margin
- High ROE of 61.34%
- Favorable ROIC at 36.69%
- Diverse revenue across Digital Media and Experience
- Significant global presence in Americas and EMEA
Teradata Corporation Strengths
- Very high ROE at 85.71%
- Favorable ROIC at 16.89%
- Low WACC of 5.8% improves capital efficiency
- Recurring revenue streams dominate product mix
- Global footprint in Americas, EMEA, Asia Pacific
Adobe Inc. Weaknesses
- Unfavorable current ratio at 1.0 signals liquidity risk
- High WACC at 10.6% raises capital costs
- Unfavorable PB ratio at 11.73 suggests overvaluation
- No dividend yield
- Moderate debt-to-equity ratio at 0.57
Teradata Corporation Weaknesses
- Unfavorable current and quick ratios below 1
- High debt-to-equity ratio at 4.33 indicates leverage risk
- Unfavorable PE at 26.34 may signal expensive valuation
- No dividend yield
- Higher unfavorable ratio percentage than Adobe
Both companies show robust profitability but face liquidity and valuation challenges. Adobe’s diversified revenue and global scale contrast with Teradata’s higher leverage and weaker liquidity, impacting their financial flexibility and risk profiles.
The Moat Duel: Analyzing Competitive Defensibility
A structural moat is the only reliable shield protecting long-term profits from relentless competitive pressure:
Adobe Inc.: Intangible Assets and Ecosystem Scale
Adobe’s moat stems from its dominant Creative Cloud subscription ecosystem, driving high ROIC above 26% and margin stability near 30%. Expansion into AI-powered digital experiences in 2026 should deepen this advantage.
Teradata Corporation: Data Platform and Network Effects
Teradata relies on its multi-cloud data platform, creating switching costs and network effects. Its ROIC above 11% and recent margin improvements signal resilience, but revenue declines highlight risks to moat durability.
Verdict: Subscription Ecosystem vs. Data Platform Network
Adobe’s wider moat benefits from entrenched customer lock-in and scale, while Teradata’s narrower moat grows but faces revenue headwinds. Adobe is better positioned to defend market share in 2026.
Which stock offers better returns?
The past year shows sharply divergent price moves and trading dynamics between Adobe Inc. and Teradata Corporation, highlighting distinct investor sentiment and market reactions.
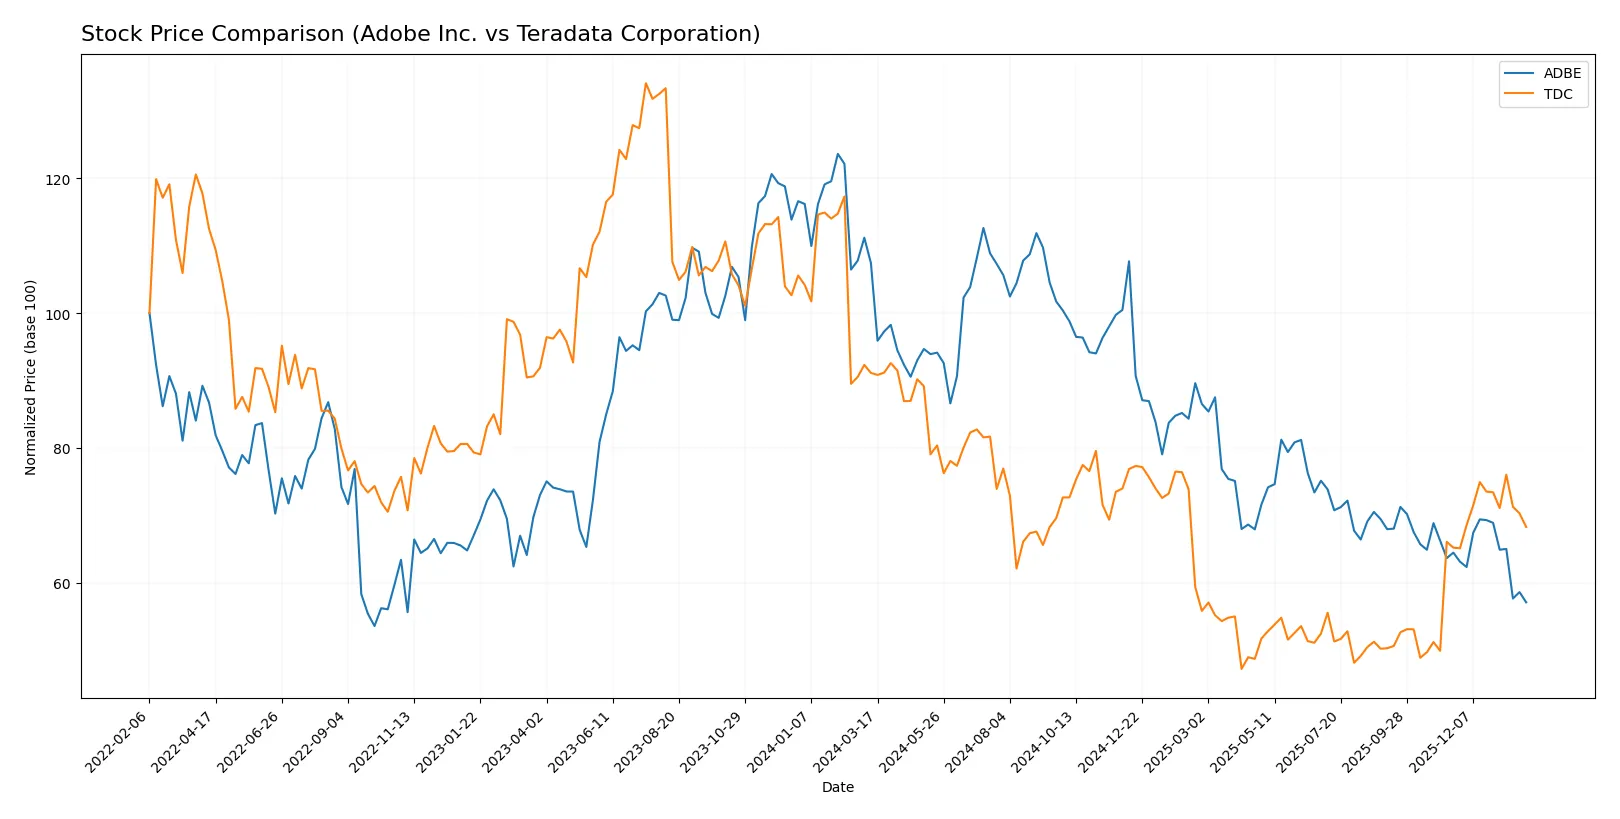
Trend Comparison
Adobe Inc. stock fell 46.85% over the past 12 months, marking a bearish trend with deceleration. The price ranged from 578.34 at its peak to 293.25, showing high volatility (std dev 78.57).
Teradata Corporation declined 25.07% overall, also bearish but with accelerating losses. The price fluctuated between 38.67 and 19.73, showing much lower volatility (std dev 5.45).
Adobe’s larger negative return contrasts with Teradata’s milder decline. Teradata showed recent slight recovery, whereas Adobe’s downtrend persisted, making Teradata the higher performer over the period.
Target Prices
Analysts present a constructive target consensus for both Adobe Inc. and Teradata Corporation.
| Company | Target Low | Target High | Consensus |
|---|---|---|---|
| Adobe Inc. | 280 | 500 | 390.31 |
| Teradata Corporation | 27 | 35 | 31 |
The target consensus for Adobe at 390.31 suggests upside potential from the current 293.25 price, reflecting confidence in its software infrastructure moat. Teradata’s consensus of 31 is modestly above its 28.52 price, indicating steady, if cautious, growth expectations.

Don’t Let Luck Decide Your Entry Point
Optimize your entry points with our advanced ProRealTime indicators. You’ll get efficient buy signals with precise price targets for maximum performance. Start outperforming now!
How do institutions grade them?
Adobe Inc. Grades
The following table summarizes recent grades from reputable institutions for Adobe Inc.:
| Grading Company | Action | New Grade | Date |
|---|---|---|---|
| UBS | maintain | Neutral | 2026-01-26 |
| Oppenheimer | downgrade | Perform | 2026-01-13 |
| BMO Capital | downgrade | Market Perform | 2026-01-09 |
| Jefferies | downgrade | Hold | 2026-01-05 |
| Citigroup | maintain | Neutral | 2025-12-17 |
| BMO Capital | maintain | Outperform | 2025-12-15 |
| Keybanc | downgrade | Underweight | 2025-12-15 |
| Wolfe Research | maintain | Outperform | 2025-12-11 |
| TD Cowen | maintain | Hold | 2025-12-11 |
| Oppenheimer | maintain | Outperform | 2025-12-11 |
Teradata Corporation Grades
The following table summarizes recent grades from reputable institutions for Teradata Corporation:
| Grading Company | Action | New Grade | Date |
|---|---|---|---|
| Barclays | maintain | Underweight | 2026-01-12 |
| RBC Capital | maintain | Sector Perform | 2026-01-05 |
| Morgan Stanley | maintain | Overweight | 2025-12-17 |
| Citizens | upgrade | Market Outperform | 2025-11-10 |
| Barclays | maintain | Underweight | 2025-11-05 |
| Evercore ISI Group | maintain | Outperform | 2025-11-05 |
| TD Cowen | maintain | Hold | 2025-11-05 |
| UBS | maintain | Neutral | 2025-08-06 |
| Guggenheim | maintain | Buy | 2025-05-07 |
| Barclays | maintain | Underweight | 2025-04-21 |
Which company has the best grades?
Adobe Inc. holds a mix of Neutral, Hold, and Outperform grades, with recent downgrades to Market Perform and Perform. Teradata Corporation’s grades range from Underweight to Market Outperform, with fewer downgrades and some upgrades. This suggests a more stable and occasionally bullish outlook from institutions on Teradata, potentially signaling differing risk perceptions for investors.
Risks specific to each company
The following categories identify the critical pressure points and systemic threats facing both firms in the 2026 market environment:
1. Market & Competition
Adobe Inc.
- Dominates with a large market cap (123B) and strong brand in digital media and experience software.
Teradata Corporation
- Smaller market cap (2.7B) limits competitive influence; niche focus on multi-cloud data platforms.
2. Capital Structure & Debt
Adobe Inc.
- Moderate debt-to-equity (0.57) with favorable interest coverage (33.96); balance sheet stable but current ratio (1.0) is borderline.
Teradata Corporation
- High debt-to-equity (4.33) with weaker liquidity ratios (current 0.81, quick 0.79); interest coverage decent (6.66) but elevated leverage is a concern.
3. Stock Volatility
Adobe Inc.
- Beta 1.53 indicates higher market sensitivity and volatility relative to S&P 500.
Teradata Corporation
- Beta 0.57 suggests lower volatility and defensive characteristics in turbulent markets.
4. Regulatory & Legal
Adobe Inc.
- Faces regulatory scrutiny typical of large tech firms, including data privacy and antitrust risks.
Teradata Corporation
- Exposure to regulatory risks in cloud and data sectors, but less public visibility reduces risk magnitude.
5. Supply Chain & Operations
Adobe Inc.
- Cloud-based service model reduces traditional supply chain risks; operational scale supports resilience.
Teradata Corporation
- Relies on multi-cloud ecosystems; integration complexity and vendor dependency present operational risks.
6. ESG & Climate Transition
Adobe Inc.
- Increasing focus on sustainability in cloud operations and digital content delivery.
Teradata Corporation
- ESG efforts less visible; risk of lagging peers in climate transition initiatives.
7. Geopolitical Exposure
Adobe Inc.
- Global operations expose it to trade tensions and data sovereignty laws.
Teradata Corporation
- Also global but smaller footprint mitigates some geopolitical risks, though cloud regulations remain critical.
Which company shows a better risk-adjusted profile?
Adobe faces its largest risk in market volatility and regulatory scrutiny due to its scale and beta above 1.5. Teradata’s critical risk lies in its leveraged capital structure with high debt and suboptimal liquidity, elevating financial distress risk. Despite Adobe’s higher volatility, its excellent Altman Z-score (8.14, safe zone) contrasts sharply with Teradata’s distress-zone Z-score (0.75). Adobe’s balanced profitability and moderate leverage yield a better risk-adjusted profile, supported by a very favorable credit rating and strong interest coverage. Teradata’s financial leverage and liquidity weaknesses pose a significant red flag despite solid operational metrics.
Final Verdict: Which stock to choose?
Adobe Inc. wields unmatched efficiency as its superpower, showcasing strong returns on invested capital well above its cost of capital. Its durable competitive advantage fuels consistent growth. However, a current ratio around 1 signals a point of vigilance on liquidity. It fits aggressive growth portfolios willing to navigate short-term risks for long-term value creation.
Teradata Corporation offers a strategic moat through improving ROIC and solid operational cash flow, combined with a lower cost of capital. Its financial safety profile is less robust than Adobe’s, with concerning leverage and liquidity ratios. Teradata suits GARP investors seeking growth with a margin of safety amid moderate volatility.
If you prioritize durable competitive advantage and capital efficiency, Adobe outshines due to its proven value creation and robust income growth. However, if stability and improving operational metrics matter more, Teradata offers better stability and a compelling turnaround story for cautious growth investors. Both present distinct analytical scenarios depending on risk tolerance and portfolio strategy.
Disclaimer: Investment carries a risk of loss of initial capital. The past performance is not a reliable indicator of future results. Be sure to understand risks before making an investment decision.
Go Further
I encourage you to read the complete analyses of Adobe Inc. and Teradata Corporation to enhance your investment decisions: