Home > Comparison > Technology > ADBE vs SNPS
The strategic rivalry between Adobe Inc. and Synopsys, Inc. shapes the evolution of the technology sector’s software infrastructure landscape. Adobe operates as a diversified software powerhouse focused on creative and digital experience platforms. In contrast, Synopsys specializes in electronic design automation and intellectual property solutions for integrated circuits. This analysis will evaluate which company’s operational model and growth trajectory offer the superior risk-adjusted return potential for a diversified portfolio in 2026.
Table of contents
Companies Overview
Adobe and Synopsys stand as critical players in the software infrastructure space, shaping digital creativity and chip design.
Adobe Inc.: Creative Software Powerhouse
Adobe dominates digital content creation and marketing software. Its core revenue derives from Creative Cloud subscriptions and Document Cloud services. In 2026, it emphasizes expanding integrated digital media and experience platforms to capture evolving customer demands. Adobe’s diversified software portfolio drives strong engagement across creative professionals and enterprises.
Synopsys, Inc.: Chip Design Innovator
Synopsys leads in electronic design automation software critical for semiconductor development. It generates revenue through its Fusion Design Platform and IP solutions for integrated circuits. Its 2026 strategy focuses on enhancing virtual prototyping and security testing to support next-gen chip complexity. Synopsys’ specialized semiconductor design tools place it at the forefront of technology innovation.
Strategic Collision: Similarities & Divergences
Both operate in the software infrastructure sector but target distinct customer bases—Adobe serves creators and marketers, Synopsys targets semiconductor engineers. Adobe pursues a content-driven ecosystem, while Synopsys builds an open, modular design platform. Their battleground lies in technology innovation and platform scalability. Each offers a unique investment profile reflecting different growth vectors and industry cycles.
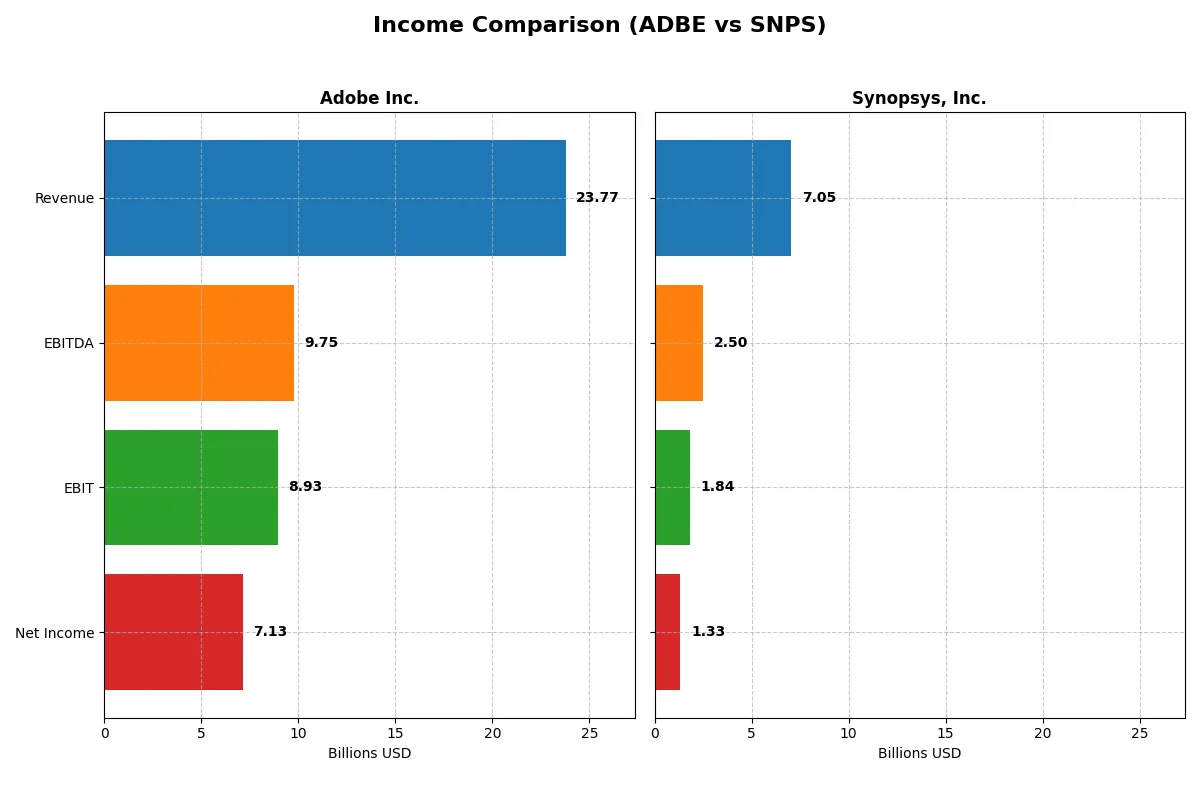
Income Statement Comparison
This data dissects the core profitability and scalability of both corporate engines, revealing who dominates the bottom line:
| Metric | Adobe Inc. (ADBE) | Synopsys, Inc. (SNPS) |
|---|---|---|
| Revenue | 23.8B | 7.1B |
| Cost of Revenue | 2.7B | 1.6B |
| Operating Expenses | 12.4B | 4.5B |
| Gross Profit | 21.1B | 5.4B |
| EBITDA | 9.7B | 2.5B |
| EBIT | 8.9B | 1.8B |
| Interest Expense | 263M | 447M |
| Net Income | 7.1B | 1.3B |
| EPS | 16.73 | 8.13 |
| Fiscal Year | 2025 | 2025 |
Income Statement Analysis: The Bottom-Line Duel
The following income statement comparison reveals the true efficiency and momentum behind each company’s corporate engine over recent years.
Adobe Inc. Analysis
Adobe’s revenue climbed steadily from 15.8B in 2021 to 23.8B in 2025, reflecting robust growth. Net income surged from 4.8B to 7.1B, showcasing strong profitability. Adobe sustains an impressive gross margin above 88% and a net margin near 30%, revealing excellent cost control and operational efficiency, especially in 2025 with a 35% EPS growth.
Synopsys, Inc. Analysis
Synopsys grew revenue from 4.2B in 2021 to 7.1B in 2025, a faster pace than Adobe. Net income rose from 758M to 1.33B but fell from 2.26B in 2024 due to a sizable discontinued operations impact. Gross margin remains solid near 77%, but net margin at 19% lags Adobe’s. Operating expenses increased faster than revenue, squeezing margin growth in 2025.
Margin Leadership vs. Revenue Momentum
Adobe leads in profitability with superior gross and net margins, translating to higher operating leverage and consistent bottom-line expansion. Synopsys excels in revenue growth but faces margin pressure and net income volatility. For investors prioritizing sustained margin strength and earnings quality, Adobe presents a more attractive profile; Synopsys suits those focused on top-line acceleration with some margin risk.
Financial Ratios Comparison
These vital ratios act as a diagnostic tool to expose the underlying fiscal health, valuation premiums, and capital efficiency of the companies compared below:
| Ratios | Adobe Inc. (ADBE) | Synopsys, Inc. (SNPS) |
|---|---|---|
| ROE | 61.3% | 4.7% |
| ROIC | 36.7% | 2.0% |
| P/E | 19.1 | 54.6 |
| P/B | 11.7 | 2.6 |
| Current Ratio | 1.0 | 1.6 |
| Quick Ratio | 1.0 | 1.5 |
| D/E | 0.57 | 0.50 |
| Debt-to-Assets | 22.5% | 29.6% |
| Interest Coverage | 33.1x | 2.0x |
| Asset Turnover | 0.81 | 0.15 |
| Fixed Asset Turnover | 10.9 | 5.0 |
| Payout Ratio | 0% | 0% |
| Dividend Yield | 0% | 0% |
| Fiscal Year | 2025 | 2025 |
Efficiency & Valuation Duel: The Vital Signs
Ratios act as a company’s DNA, revealing hidden risks and operational excellence that raw numbers alone cannot expose.
Adobe Inc.
Adobe delivers robust profitability with a 61.3% ROE and a 30% net margin, demonstrating operational excellence. Its P/E of 19.1 signals a fairly valued stock, not stretched by the market. Despite no dividends, Adobe reinvests heavily in R&D, fueling sustainable growth and shareholder value over time.
Synopsys, Inc.
Synopsys shows weaker profitability, with a 4.7% ROE and an 18.9% net margin, signaling efficiency challenges. Its P/E of 54.6 marks the stock as expensive relative to earnings. The company pays no dividend, investing aggressively in R&D to drive future growth, but current returns remain modest.
Balanced Profitability vs. Growth Premium
Adobe offers a superior balance of strong returns and reasonable valuation, reducing investment risk. Synopsys appears riskier with stretched valuation and lower profitability. Investors prioritizing stable operational efficiency may prefer Adobe, while those seeking growth potential might consider Synopsys’s aggressive reinvestment profile.
Which one offers the Superior Shareholder Reward?
I observe that both Adobe Inc. (ADBE) and Synopsys, Inc. (SNPS) pay no dividends, focusing their shareholder returns on share buybacks and reinvestment. Adobe’s free cash flow per share reached $23.1B in 2025, nearly triple Synopsys’s $8.4B, supporting a more aggressive buyback capacity. Adobe’s payout ratio is zero, preserving cash for growth and buybacks, while Synopsys also retains earnings but with a weaker operating cash flow ratio (0.41 vs. Adobe’s 0.98), limiting buyback sustainability. Adobe’s higher operating margins (37.5% vs. 26%) and robust free cash flow coverage underpin a stronger capital allocation model. I conclude Adobe offers a superior total return profile in 2026 due to its healthier cash flow and sustainable buyback intensity.
Comparative Score Analysis: The Strategic Profile
The radar chart reveals the fundamental DNA and trade-offs of Adobe Inc. and Synopsys, Inc., highlighting their strategic financial strengths and vulnerabilities:
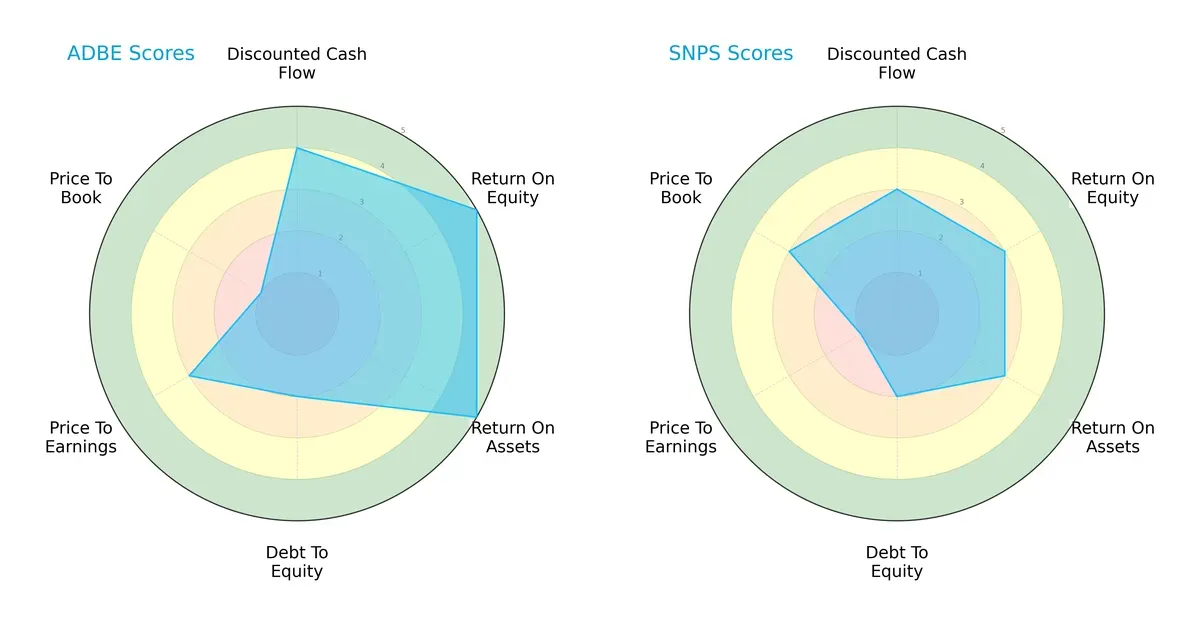
Adobe shows a more balanced profile, excelling in ROE and ROA with very favorable scores of 5 each, reflecting superior profitability and asset efficiency. Synopsys lags with moderate scores of 3 in these areas, indicating weaker operational performance. Both firms share moderate debt-to-equity scores of 2, signaling comparable financial risk. Adobe’s valuation metrics show mixed signals: a moderate P/E score of 3 but a very unfavorable P/B score of 1, suggesting market skepticism on book value. Synopsys suffers from a very unfavorable P/E score of 1 but a better P/B of 3, pointing to valuation challenges but relative book value strength.
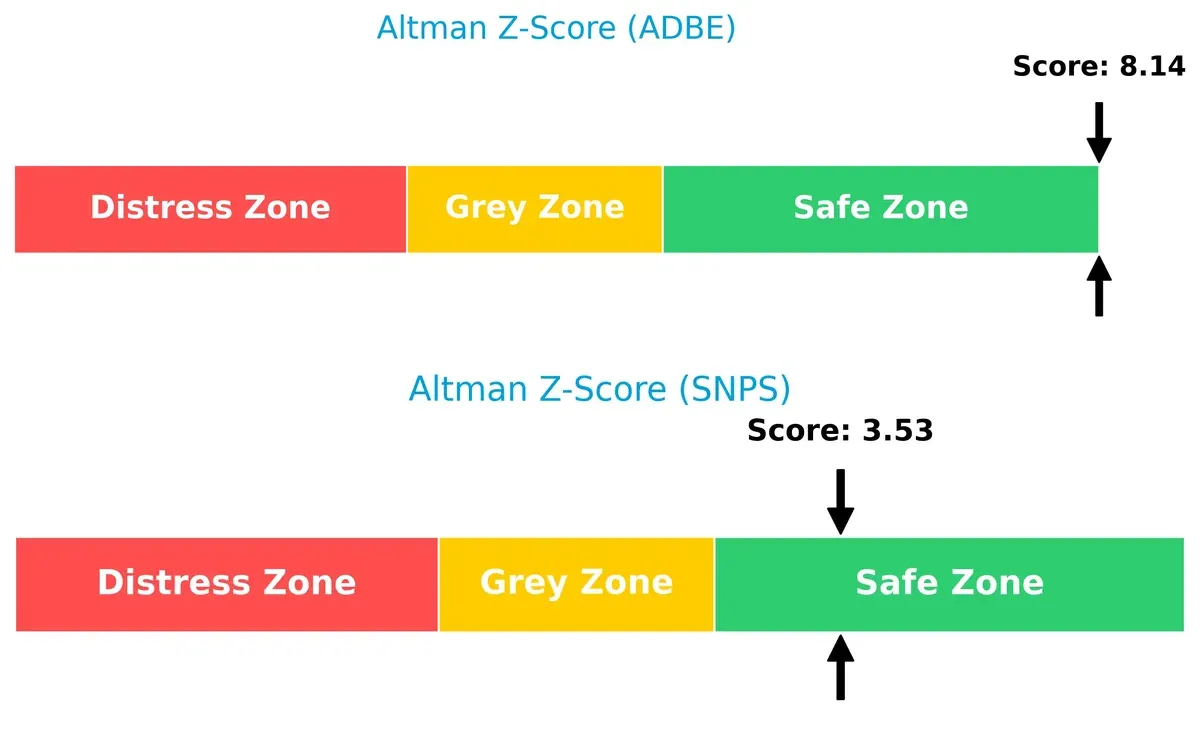
Bankruptcy Risk: Solvency Showdown
Adobe’s Altman Z-Score of 8.14 vastly exceeds Synopsys’ 3.53, both in the safe zone, but Adobe’s score signals a much stronger buffer against bankruptcy risk in this cycle:
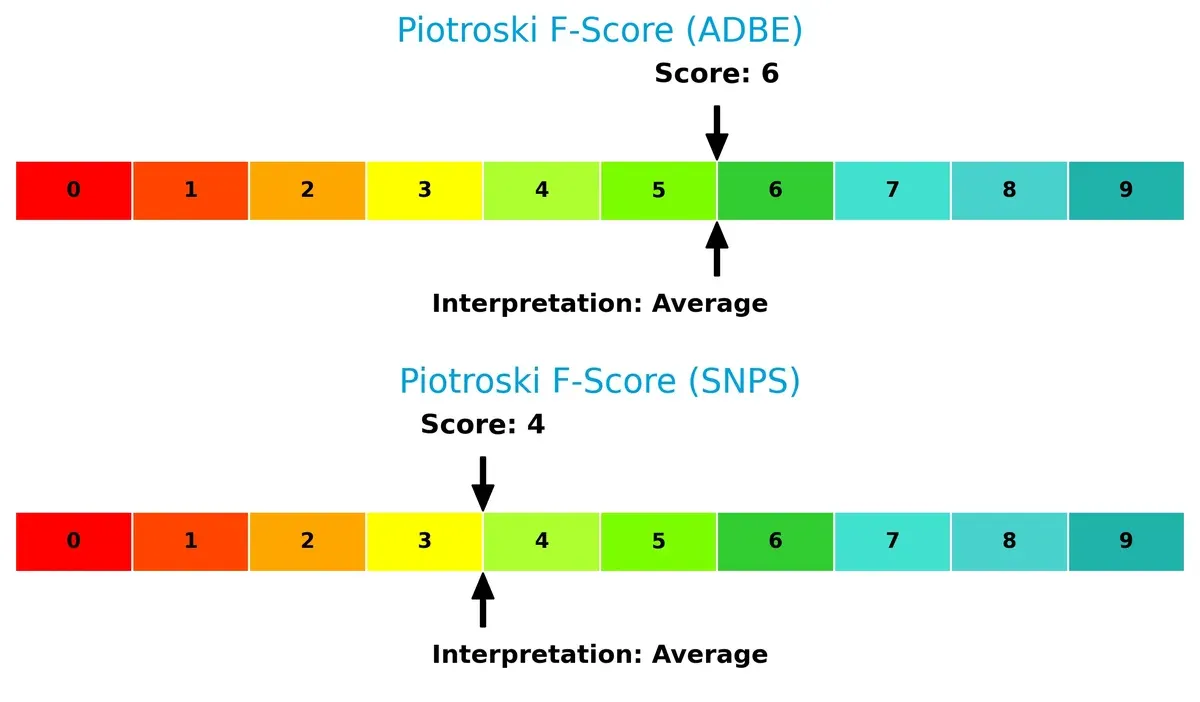
Financial Health: Quality of Operations
Adobe’s Piotroski F-Score of 6 surpasses Synopsys’ score of 4, indicating Adobe’s healthier internal financial metrics and operational quality. Synopsys’ lower score raises caution about potential red flags in profitability or efficiency:
How are the two companies positioned?
This section dissects Adobe and Synopsys’s operational DNA by comparing revenue distribution and internal dynamics. The goal is to confront their moats to identify the most resilient competitive advantage today.
Revenue Segmentation: The Strategic Mix
This visual comparison dissects how Adobe Inc. and Synopsys, Inc. diversify their income streams and reveals their primary sector bets:
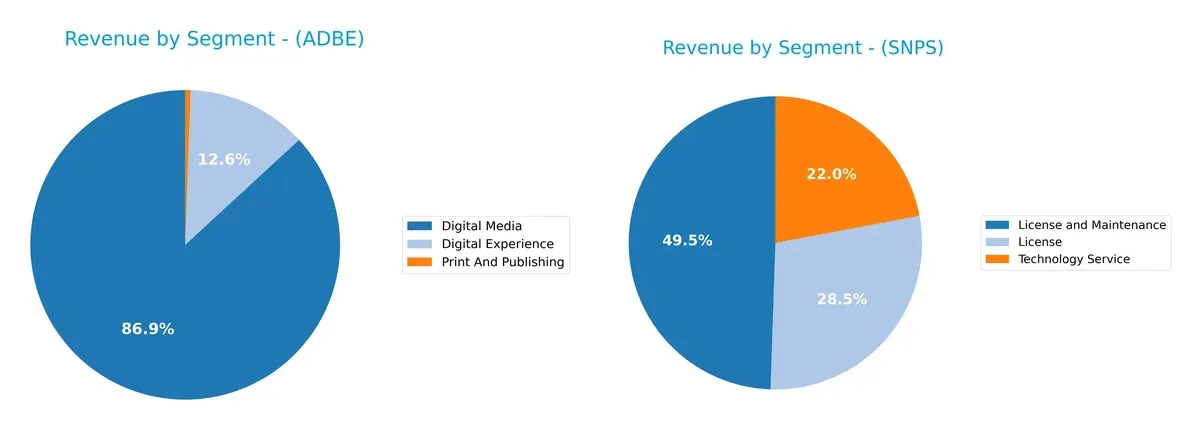
Adobe leans heavily on its Digital Media segment, which dwarfs its $5.9B Digital Experience and $256M Print revenues, anchoring its ecosystem lock-in. Synopsys shows a more balanced mix, with License and Maintenance at $3.5B, License at $2.0B, and Technology Service at $1.6B, pivoting on diversified software offerings. Adobe’s concentration risks contrast with Synopsys’ broader revenue base, enhancing resilience amid market shifts.
Strengths and Weaknesses Comparison
This table compares the Strengths and Weaknesses of Adobe Inc. and Synopsys, Inc.:
Adobe Inc. Strengths
- High net margin at 30%
- Very strong ROE of 61.34%
- ROIC well above WACC at 36.69%
- Favorable debt to assets at 22.54%
- Large Digital Media segment generating $40.4B
- Strong Americas revenue of $14.1B
Synopsys, Inc. Strengths
- Favorable net margin at 18.89%
- Strong current and quick ratios above 1.5
- Favorable debt to assets at 29.64%
- Significant License and Maintenance revenue of $3.5B
- Diversified global presence with $3.1B US revenue and notable Asia segments
Adobe Inc. Weaknesses
- High WACC at 10.6% erodes capital efficiency
- Unfavorable PB ratio at 11.73 suggests overvaluation
- Weak current ratio at 1.0 indicates liquidity risk
- Zero dividend yield limits income appeal
- Moderate asset turnover at 0.81 despite size
Synopsys, Inc. Weaknesses
- Low ROE at 4.7% signals weak profitability on equity
- ROIC barely exceeds 2%, close to WACC of 8.2%
- Unfavorable high P/E at 54.56 indicates expensive valuation
- Low asset turnover at 0.15 hinders revenue generation efficiency
- Zero dividend yield reduces shareholder income
Both companies show strengths in profitability and leverage management but face valuation and liquidity challenges. Adobe excels with superior returns and scale, while Synopsys benefits from stronger liquidity yet struggles with profitability metrics, influencing their strategic focus on capital efficiency and market positioning.
The Moat Duel: Analyzing Competitive Defensibility
A structural moat is the only reliable shield protecting long-term profits from relentless competitive erosion. Let’s dissect how Adobe and Synopsys defend their turf:
Adobe Inc.: Subscription Ecosystem Lock-in
Adobe’s primary moat is its subscription-based Creative Cloud, creating high switching costs. This manifests in a robust 26.1% ROIC above WACC and stable 30% net margins. In 2026, Adobe’s expansion into integrated digital experience platforms should deepen this durable advantage.
Synopsys, Inc.: Innovation-Dependent IP Portfolio
Synopsys relies on proprietary electronic design automation IP, a cost advantage contrasting Adobe’s ecosystem. However, its negative ROIC trend and shrinking profitability signal a weakening moat. Future growth hinges on breakthroughs in AI-driven design tools amid intensifying competition.
Moat Strength Showdown: Ecosystem Lock-in vs. Innovation Vulnerability
Adobe possesses a wider and deeper moat, evidenced by its strong value creation and margin resilience. Synopsys’s declining ROIC warns of an eroding competitive edge. Adobe stands better poised to defend market share in 2026 and beyond.
Which stock offers better returns?
The past year shows a pronounced decline for Adobe Inc., while Synopsys, Inc. experienced a less severe drop with a recent rebound in price and trading activity.
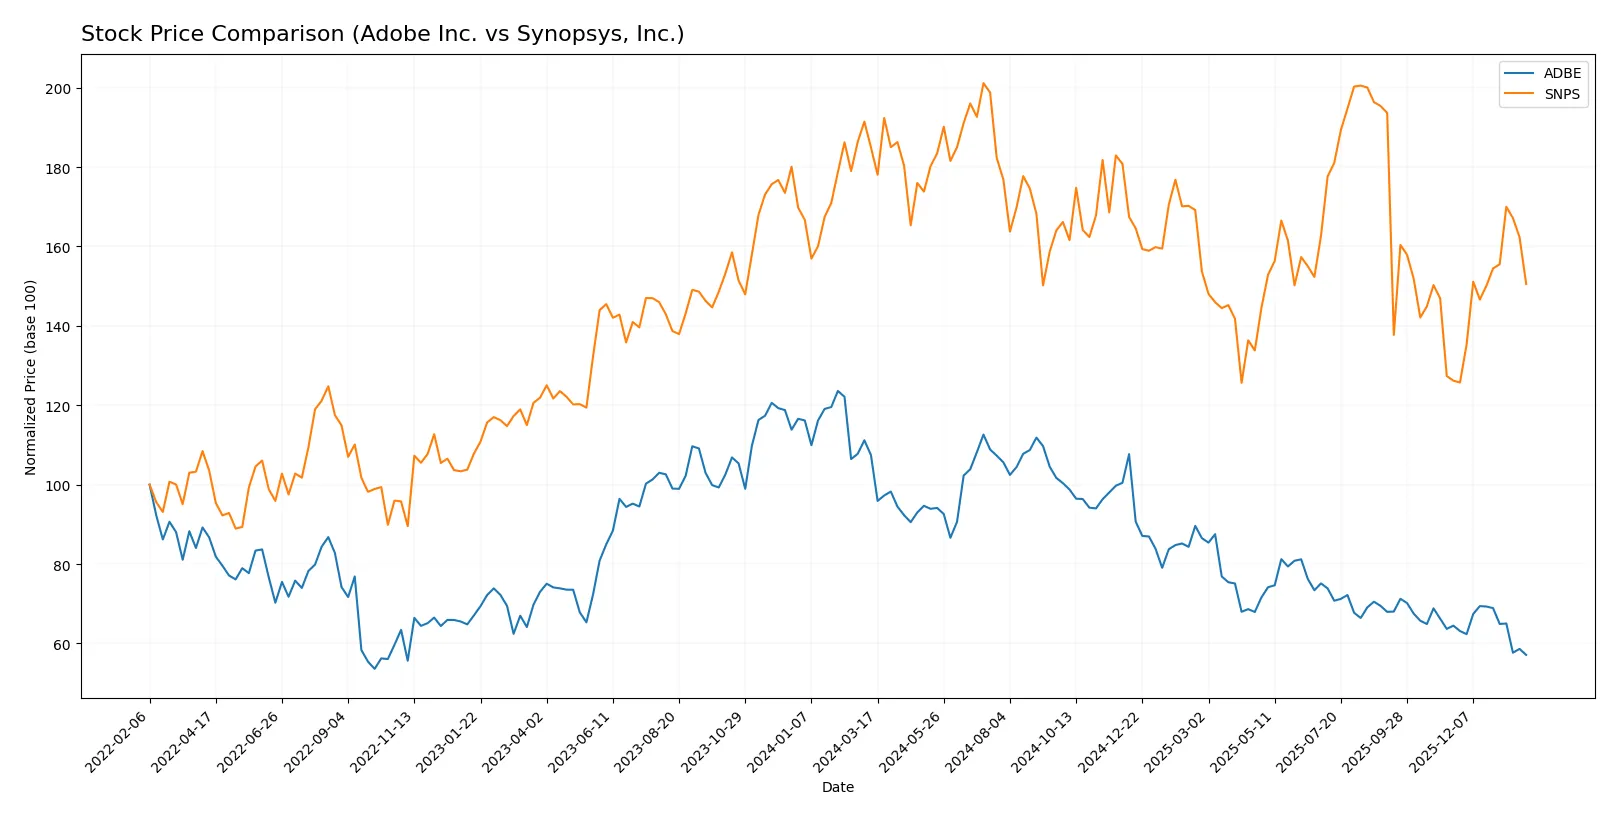
Trend Comparison
Adobe Inc.’s stock decreased 46.85% over the last 12 months, marking a bearish trend with decelerating losses and a high volatility of 78.57. The price peaked at 578.34 and bottomed at 293.25.
Synopsys, Inc. dropped 18.58% over the same period, also bearish but with accelerating losses. Recently, it reversed course with a 19.31% gain and a positive slope, reflecting increased momentum.
Synopsys outperformed Adobe in market performance, showing a smaller overall decline and a recent bullish recovery, while Adobe’s losses intensified and volatility remained elevated.
Target Prices
Analysts present a bullish consensus for Adobe Inc. and Synopsys, Inc., indicating significant upside potential from current prices.
| Company | Target Low | Target High | Consensus |
|---|---|---|---|
| Adobe Inc. | 280 | 500 | 390.31 |
| Synopsys, Inc. | 425 | 600 | 530 |
Adobe’s consensus target at 390.31 suggests a 33% upside from its 293.25 price. Synopsys shows even stronger potential, with a 14% gain from 465.12.

Don’t Let Luck Decide Your Entry Point
Optimize your entry points with our advanced ProRealTime indicators. You’ll get efficient buy signals with precise price targets for maximum performance. Start outperforming now!
How do institutions grade them?
Adobe Inc. Grades
The following table summarizes recent institutional grades for Adobe Inc.:
| Grading Company | Action | New Grade | Date |
|---|---|---|---|
| UBS | Maintain | Neutral | 2026-01-26 |
| Oppenheimer | Downgrade | Perform | 2026-01-13 |
| BMO Capital | Downgrade | Market Perform | 2026-01-09 |
| Jefferies | Downgrade | Hold | 2026-01-05 |
| Citigroup | Maintain | Neutral | 2025-12-17 |
| BMO Capital | Maintain | Outperform | 2025-12-15 |
| Keybanc | Downgrade | Underweight | 2025-12-15 |
| Wolfe Research | Maintain | Outperform | 2025-12-11 |
| TD Cowen | Maintain | Hold | 2025-12-11 |
| Oppenheimer | Maintain | Outperform | 2025-12-11 |
Synopsys, Inc. Grades
Below are recent institutional grades assigned to Synopsys, Inc.:
| Grading Company | Action | New Grade | Date |
|---|---|---|---|
| Piper Sandler | Downgrade | Neutral | 2026-01-13 |
| Morgan Stanley | Maintain | Overweight | 2025-12-12 |
| B of A Securities | Upgrade | Buy | 2025-12-11 |
| Rosenblatt | Maintain | Buy | 2025-12-11 |
| Piper Sandler | Maintain | Overweight | 2025-12-11 |
| Keybanc | Maintain | Overweight | 2025-12-11 |
| JP Morgan | Maintain | Overweight | 2025-12-11 |
| Wells Fargo | Maintain | Equal Weight | 2025-12-11 |
| Needham | Maintain | Buy | 2025-12-11 |
| Rosenblatt | Upgrade | Buy | 2025-12-09 |
Which company has the best grades?
Synopsys holds stronger grades overall, with multiple “Buy” and “Overweight” ratings from major firms. Adobe faces downgrades and more “Neutral” or “Hold” grades. This divergence may influence investor sentiment differently for each stock.
Risks specific to each company
The following categories identify the critical pressure points and systemic threats facing both Adobe Inc. and Synopsys, Inc. in the 2026 market environment:
1. Market & Competition
Adobe Inc.
- Dominates creative and digital marketing software with strong brand moat but faces intense competition in SaaS infrastructure.
Synopsys, Inc.
- Leads in electronic design automation but contends with consolidation and innovation pressure in semiconductor tools.
2. Capital Structure & Debt
Adobe Inc.
- Maintains moderate leverage (D/E 0.57) with strong interest coverage (34x), signaling solid debt management.
Synopsys, Inc.
- Similar leverage (D/E 0.5) but lower interest coverage (4.1x), indicating higher risk in servicing debt under stress.
3. Stock Volatility
Adobe Inc.
- Beta of 1.53 implies above-market volatility; stock price range is wide but stable trading volume.
Synopsys, Inc.
- Lower beta at 1.12 reflects less volatility; recent price decline (-3.1%) suggests market uncertainty.
4. Regulatory & Legal
Adobe Inc.
- Faces scrutiny on data privacy and cloud services compliance globally; large enterprise scale adds complexity.
Synopsys, Inc.
- Exposed to export controls and IP regulations impacting semiconductor software and security offerings.
5. Supply Chain & Operations
Adobe Inc.
- Cloud-based delivery reduces physical supply chain risks but depends on global data centers and network stability.
Synopsys, Inc.
- Relies on semiconductor industry cycles and hardware prototyping; supply chain disruptions can delay product rollouts.
6. ESG & Climate Transition
Adobe Inc.
- Increasing pressure to reduce data center emissions and improve software sustainability metrics.
Synopsys, Inc.
- Faces challenges integrating ESG in hardware-dependent business, with rising demand for energy-efficient chip design tools.
7. Geopolitical Exposure
Adobe Inc.
- Significant US and global presence, vulnerable to regulatory shifts in tech export and privacy laws.
Synopsys, Inc.
- High exposure to US-China trade tensions affecting semiconductor design software exports.
Which company shows a better risk-adjusted profile?
Adobe’s strongest risk is its high stock volatility and regulatory complexity, while Synopsys struggles most with weaker profitability and debt servicing capacity. Adobe’s superior profitability, stronger Altman Z-score (8.14 vs. 3.53), and better interest coverage reveal a more resilient financial footing. Synopsys’s recent 3.1% stock drop amid high P/E (54.6) flags valuation risk. Overall, Adobe offers a better risk-adjusted profile given its robust cash flows and manageable leverage.
Final Verdict: Which stock to choose?
Adobe Inc. excels as a cash-generating powerhouse with a durable competitive moat, delivering consistently high returns on invested capital. Its main point of vigilance is a tight current ratio, which could pressure short-term liquidity. Adobe fits well in an aggressive growth portfolio seeking strong profitability and innovation leadership.
Synopsys, Inc. boasts a strategic moat through its specialized R&D and recurring revenue, offering a safer balance sheet with a healthier liquidity profile than Adobe. However, its declining ROIC and value destruction signal caution. Synopsys suits a GARP (Growth at a Reasonable Price) portfolio focused on stability with measured upside.
If you prioritize robust value creation and operational efficiency, Adobe outshines due to its growing profitability and strong economic moat. However, if you seek better short-term financial safety and steady revenue streams, Synopsys offers superior stability despite its profitability challenges. Both require close monitoring of their respective risks.
Disclaimer: Investment carries a risk of loss of initial capital. The past performance is not a reliable indicator of future results. Be sure to understand risks before making an investment decision.
Go Further
I encourage you to read the complete analyses of Adobe Inc. and Synopsys, Inc. to enhance your investment decisions: