Home > Comparison > Technology > ADBE vs STNE
The strategic rivalry between Adobe Inc. and StoneCo Ltd. shapes the evolving landscape of technology infrastructure. Adobe, a diversified software powerhouse, excels in digital media and enterprise solutions. StoneCo, a fintech innovator, focuses on electronic commerce services for Brazil’s SMEs. This analysis pits Adobe’s broad platform scale against StoneCo’s niche growth. I will determine which trajectory offers superior risk-adjusted returns for a diversified portfolio in this dynamic sector.
Table of contents
Companies Overview
Adobe Inc. and StoneCo Ltd. stand as pivotal players in software infrastructure with distinct market footprints and growth drivers.
Adobe Inc.: Creative and Experience Software Leader
Adobe dominates the software infrastructure sector with a stronghold in digital media and experience platforms. It earns revenue mainly through subscription services like Creative Cloud and Document Cloud, catering to creators and enterprises worldwide. In 2026, Adobe sharpens its focus on integrating customer experience analytics with commerce solutions, reinforcing its competitive advantage in digital marketing ecosystems.
StoneCo Ltd.: Brazil’s Fintech Powerhouse
StoneCo serves the Brazilian market by providing financial technology solutions to merchants across physical and digital channels. Its core revenue comes from its proprietary Stone Hubs and integrated payment services for small and medium businesses. In 2026, StoneCo emphasizes expanding its hyper-local sales network and deepening partnerships with e-commerce platforms to boost merchant adoption and transaction volumes.
Strategic Collision: Similarities & Divergences
Adobe and StoneCo share a foundation in software infrastructure but diverge sharply in their business models—Adobe champions an integrated digital content ecosystem, while StoneCo builds localized fintech solutions. Their primary battleground lies in serving digital commerce, with Adobe targeting enterprise marketers and StoneCo focusing on SMB merchants in Brazil. This contrast shapes distinct investment profiles: Adobe as a global software innovator and StoneCo as a regional fintech disruptor.
Income Statement Comparison
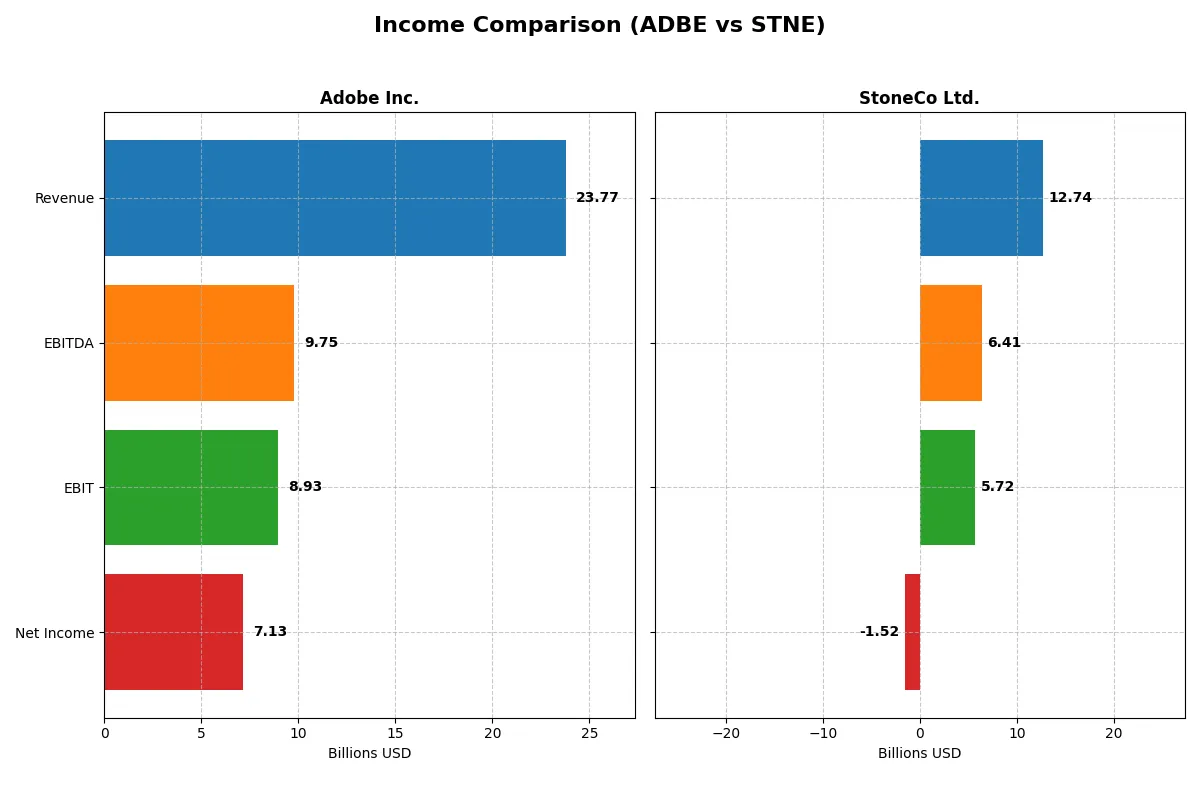
The table below dissects the core profitability and scalability of both corporate engines to reveal who dominates the bottom line:
| Metric | Adobe Inc. (ADBE) | StoneCo Ltd. (STNE) |
|---|---|---|
| Revenue | 23.77B | 12.74B |
| Cost of Revenue | 2.71B | 3.39B |
| Operating Expenses | 12.36B | 3.47B |
| Gross Profit | 21.06B | 9.35B |
| EBITDA | 9.75B | 6.41B |
| EBIT | 8.93B | 5.72B |
| Interest Expense | 263M | 1.06B |
| Net Income | 7.13B | -1.52B |
| EPS | 16.73 | -5.02 |
| Fiscal Year | 2025 | 2024 |
Income Statement Analysis: The Bottom-Line Duel
This income statement comparison reveals which company manages its revenue and expenses most efficiently to generate sustainable profits.
Adobe Inc. Analysis
Adobe’s revenue climbs steadily from $15.8B in 2021 to $23.8B in 2025, with net income rising from $4.8B to $7.1B. The company maintains robust margins, boasting an 88.6% gross margin and a solid 30% net margin in 2025. Adobe’s growing EBIT margin at 37.6% highlights operational efficiency and momentum.
StoneCo Ltd. Analysis
StoneCo’s revenue expands impressively from BRL 3.2B in 2020 to BRL 12.7B in 2024, yet net income remains negative at -BRL 1.5B in 2024. The firm shows a favorable 73.4% gross margin and an even higher EBIT margin of 44.9%, but its -11.9% net margin signals challenges in translating revenue growth into profitability.
Margin Strength vs. Profitability Consistency
Adobe leads with consistent profit growth and high net margins, reflecting superior cost control and capital allocation. StoneCo shows remarkable top-line growth and strong EBIT margins but struggles with bottom-line losses, indicating riskier fundamentals. For investors prioritizing steady profitability, Adobe’s profile proves more attractive.
Financial Ratios Comparison
These vital ratios act as a diagnostic tool to expose the underlying fiscal health, valuation premiums, and capital efficiency of the companies compared below:
| Ratios | Adobe Inc. (ADBE) | StoneCo Ltd. (STNE) |
|---|---|---|
| ROE | 61.3% | -12.9% |
| ROIC | 36.7% | 22.4% |
| P/E | 19.1 | -9.8 |
| P/B | 11.7 | 1.27 |
| Current Ratio | 1.00 | 1.37 |
| Quick Ratio | 1.00 | 1.37 |
| D/E | 0.57 | 1.10 |
| Debt-to-Assets | 22.5% | 23.5% |
| Interest Coverage | 33.1 | 5.57 |
| Asset Turnover | 0.81 | 0.23 |
| Fixed Asset Turnover | 10.9 | 6.95 |
| Payout Ratio | 0% | 0% |
| Dividend Yield | 0% | 0% |
| Fiscal Year | 2025 | 2024 |
Efficiency & Valuation Duel: The Vital Signs
Financial ratios serve as a company’s DNA, unveiling hidden risks and operational strengths essential for informed investment decisions.
Adobe Inc.
Adobe demonstrates exceptional profitability with a 61.3% ROE and a robust 30% net margin. Its valuation appears reasonable, trading at a neutral 19.1 P/E and a stretched 11.7 P/B. Adobe reinvests heavily in R&D, sacrificing dividends to fuel long-term growth, which reflects a strong capital allocation strategy.
StoneCo Ltd.
StoneCo shows a challenging profitability profile with negative ROE (-12.9%) and net margin (-11.9%), signaling operational stress. However, its valuation metrics are attractive, featuring a favorable P/E of -9.8 and a low 1.3 P/B. StoneCo does not pay dividends, focusing instead on stabilizing operations and improving its free cash flow.
Premium Profitability vs. Value Recovery
Adobe offers superior profitability and operational efficiency but at a higher valuation risk. StoneCo presents a value opportunity with a cheaper valuation but struggles with negative returns. Growth-oriented investors may prefer Adobe’s reinvestment profile, while value seekers might consider StoneCo’s recovery potential.
Which one offers the Superior Shareholder Reward?
Adobe Inc. (ADBE) and StoneCo Ltd. (STNE) both skip dividends, focusing on reinvestment and buybacks. Adobe’s dividend yield is zero, but it generates robust free cash flow (23.1B in 2025) and aggressively repurchases shares, fueling shareholder returns. StoneCo, however, suffers negative net margins and free cash flow (-16.2B BRL), limiting buyback capacity despite a modest payout ratio. Adobe’s strong cash generation and consistent buybacks make its capital allocation more sustainable. I conclude Adobe offers a superior total return profile in 2026.
Comparative Score Analysis: The Strategic Profile
The radar chart reveals the fundamental DNA and trade-offs of Adobe Inc. and StoneCo Ltd., highlighting their financial strengths and vulnerabilities across key metrics:
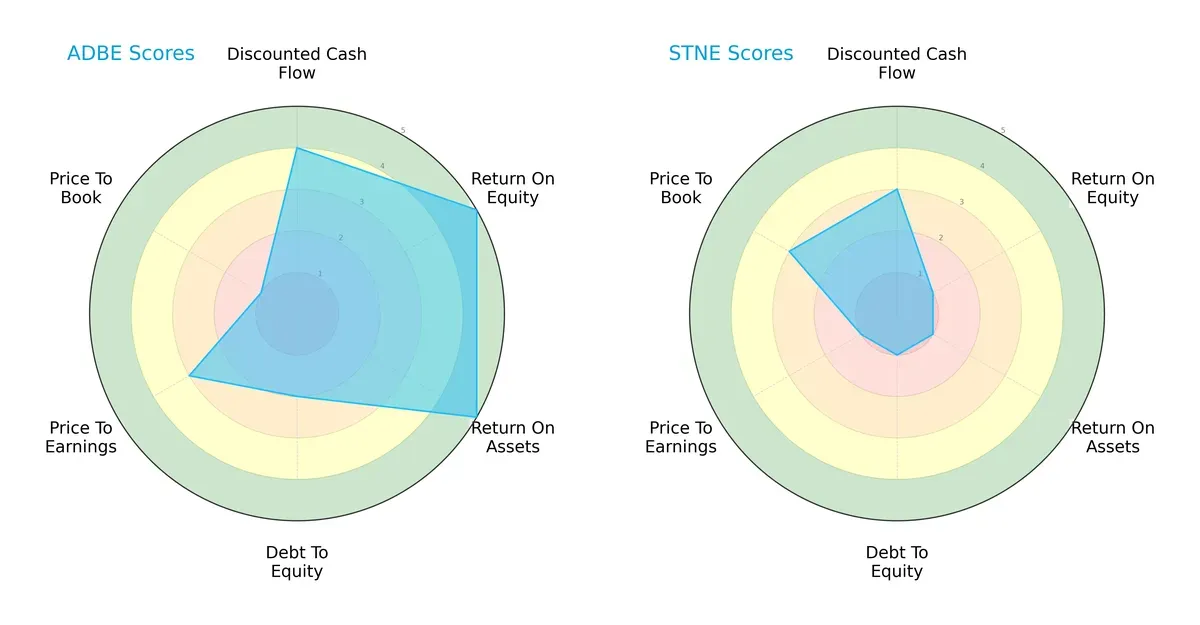
Adobe Inc. exhibits a balanced and robust profile with strong ROE and ROA scores (5 each), reflecting efficient asset and equity utilization. StoneCo, by contrast, relies heavily on a modest discounted cash flow score (3) but struggles with weak profitability and leverage metrics, scoring 1 on ROE, ROA, and debt-to-equity. Adobe’s moderate debt score (2) and valuation scores suggest some financial risk and premium pricing. StoneCo’s profile is unbalanced and riskier, primarily constrained by low profitability and high leverage.
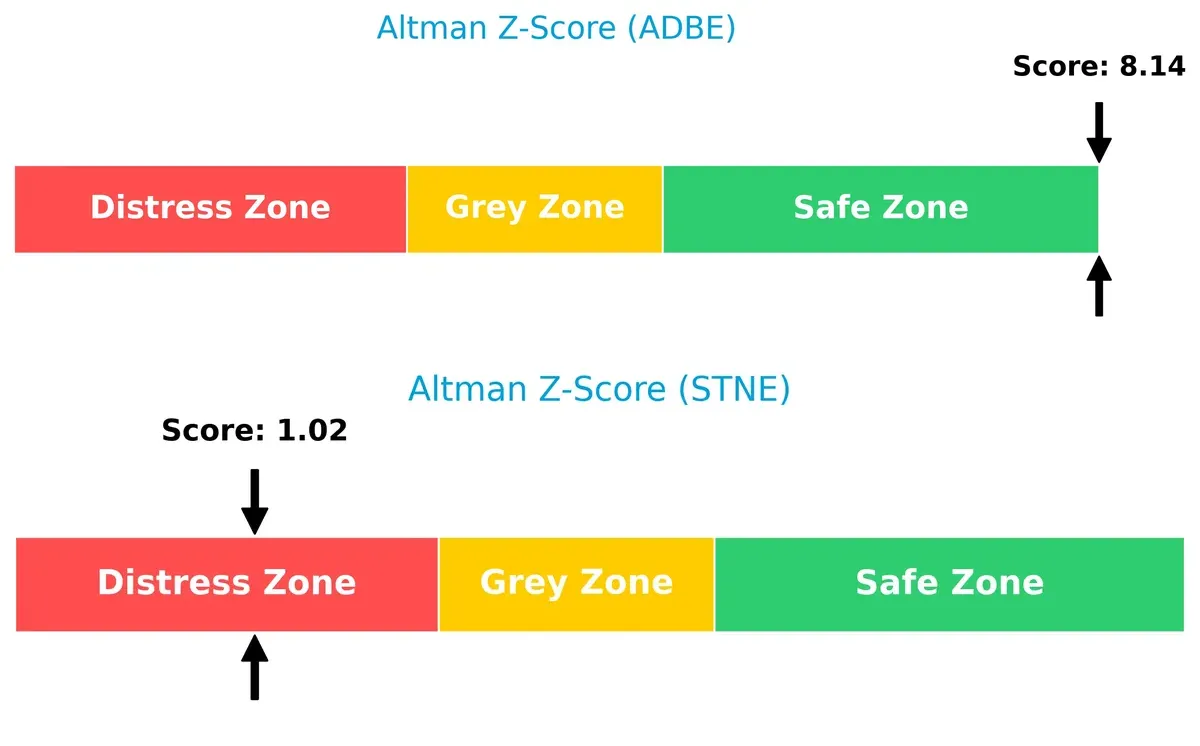
Bankruptcy Risk: Solvency Showdown
Adobe’s Altman Z-Score of 8.14 places it well within the safe zone, signaling strong solvency and low bankruptcy risk. StoneCo’s score of 1.02 warns of distress, implying significant challenges to long-term survival in this cycle:
Financial Health: Quality of Operations
Adobe scores a 6 on the Piotroski F-Score, indicating average but solid financial health with no glaring red flags. StoneCo’s score of 5 also suggests average health but slightly weaker operational quality and potential internal weaknesses:

How are the two companies positioned?
This section dissects the operational DNA of Adobe and StoneCo by comparing their revenue distribution by segment and internal dynamics. The goal is to confront their economic moats to identify which model offers a more resilient, sustainable competitive advantage today.
Revenue Segmentation: The Strategic Mix
The following visual comparison dissects how both firms diversify their income streams and where their primary sector bets lie:
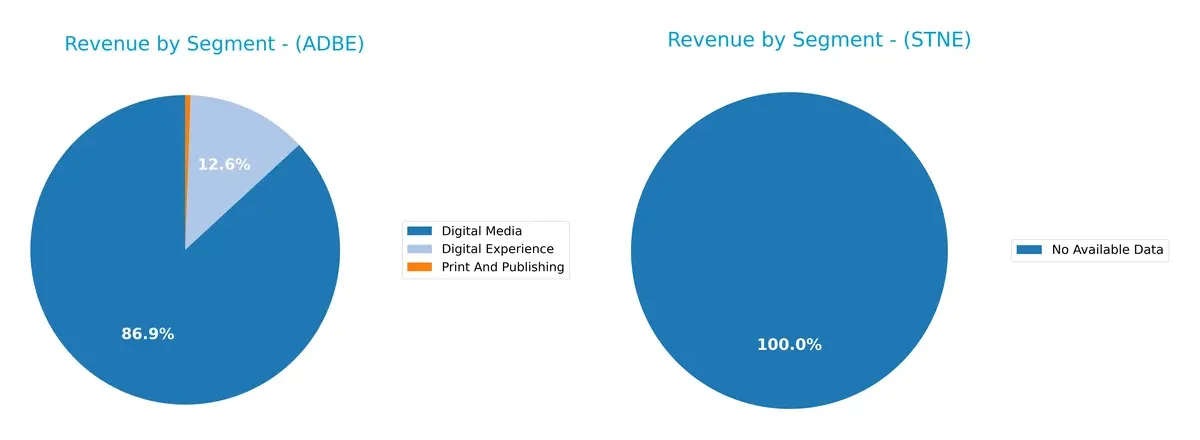
Adobe Inc. anchors its revenue in Digital Media with $40.4B in 2025, overshadowing Digital Experience at $5.9B and a minor Print and Publishing segment at $256M. StoneCo Ltd. lacks available data for segmentation, preventing direct comparison. Adobe’s heavy reliance on Digital Media highlights ecosystem lock-in but raises concentration risk. Its Digital Experience segment provides some diversification, supporting resilience in a fast-evolving digital landscape.
Strengths and Weaknesses Comparison
This table compares the Strengths and Weaknesses of Adobe Inc. and StoneCo Ltd.:
Adobe Inc. Strengths
- Strong profitability with 30% net margin
- High ROE at 61.34% indicates efficient equity use
- Robust ROIC of 36.69% exceeds cost of capital
- Favorable debt-to-assets ratio at 22.54%
- Excellent interest coverage ratio at 33.96
- Diversified revenue from Digital Media and Digital Experience
StoneCo Ltd. Strengths
- Positive ROIC at 22.41% shows good capital returns
- Favorable price-to-book ratio at 1.27 suggests reasonable valuation
- Quick ratio at 1.37 indicates solid short-term liquidity
- Favorable debt-to-assets at 23.53%
- Interest coverage ratio of 5.41 supports debt servicing
- Favorable fixed asset turnover at 6.95
Adobe Inc. Weaknesses
- Current ratio at 1.0 signals tight liquidity buffer
- Unfavorable WACC at 10.6%, higher capital costs
- High price-to-book ratio at 11.73 may indicate overvaluation
- No dividend yield limits income for investors
- Asset turnover of 0.81 is neutral but not strong
StoneCo Ltd. Weaknesses
- Negative net margin at -11.89% indicates losses
- Negative ROE at -12.87% reflects shareholder value erosion
- High debt-to-equity ratio of 1.1 raises leverage concerns
- Unfavorable asset turnover at 0.23 suggests inefficient asset use
- No dividend yield reduces shareholder returns
Adobe benefits from strong profitability and capital efficiency but faces liquidity and valuation challenges. StoneCo shows promising capital returns and liquidity but struggles with profitability and leverage, highlighting differing strategic priorities.
The Moat Duel: Analyzing Competitive Defensibility
A structural moat is the only true shield protecting long-term profits from relentless competition erosion. Let’s dissect the moats of two tech firms:
Adobe Inc.: Intangible Assets and Subscription Lock-in
Adobe’s moat stems from powerful intangible assets and high switching costs embedded in its Creative Cloud ecosystem. This drives strong margin stability and a 26% ROIC premium to WACC. In 2026, expanding digital experience platforms could deepen its durable advantage.
StoneCo Ltd.: Network Effects in Fintech Payments
StoneCo’s competitive edge arises from network effects within Brazil’s digital payments ecosystem, contrasting Adobe’s global SaaS dominance. It delivers a robust 12% ROIC premium with accelerating returns. Growth in e-commerce and financial services offers expansion upside but regulatory risks loom.
Ecosystem Lock-in vs. Network Effects: Which Moat Runs Deeper?
Both firms create value with growing ROICs, but Adobe’s intangible assets deliver wider global penetration and margin durability. StoneCo has a strong local network effect but faces higher volatility and margin pressures. Adobe is better positioned to defend and expand its market share long term.
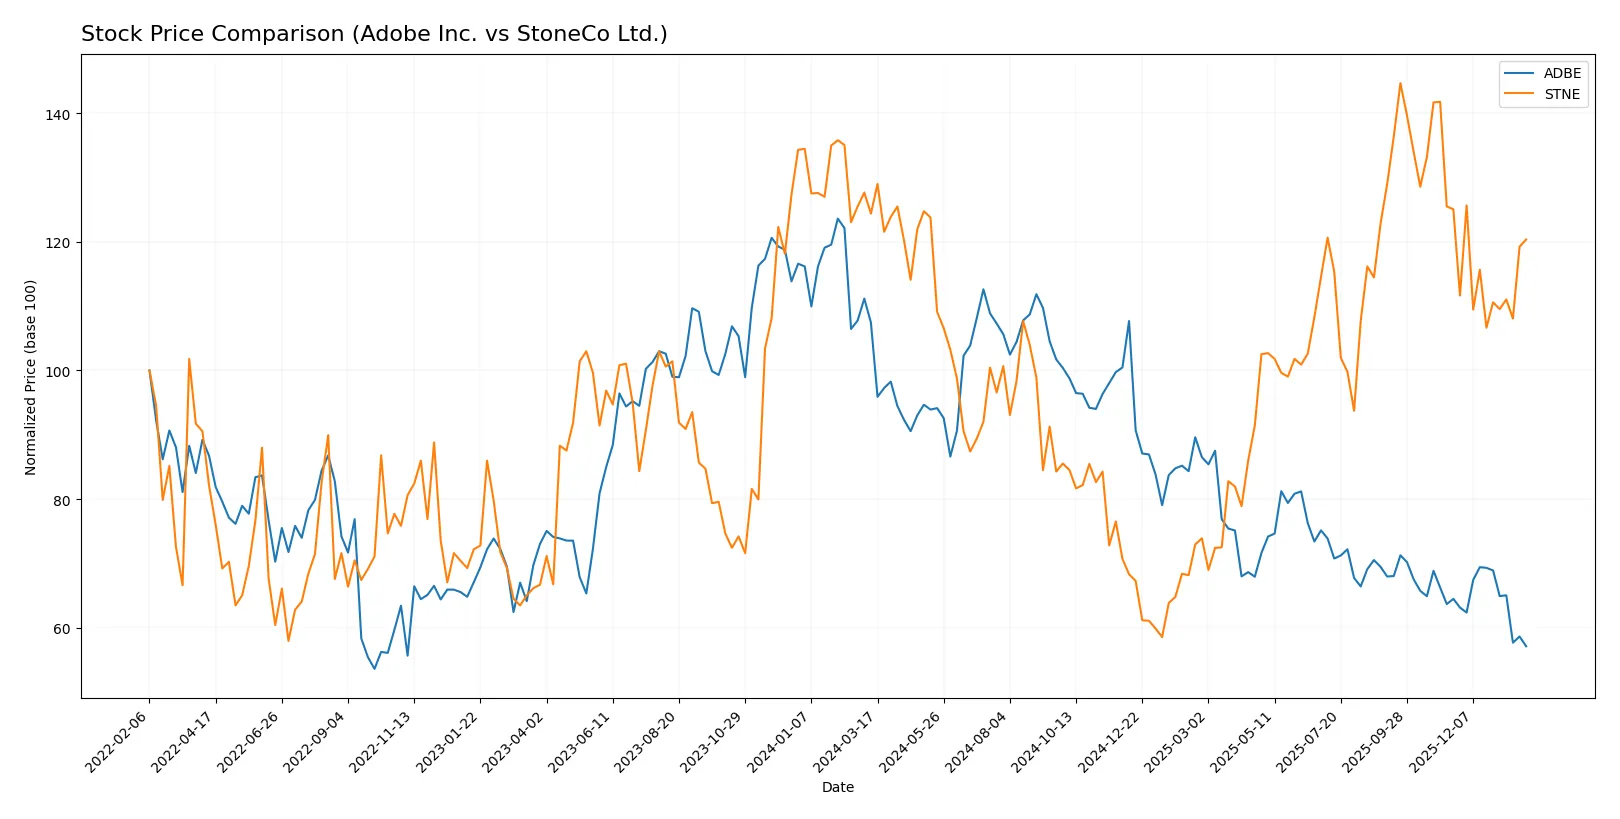
Which stock offers better returns?
Over the past 12 months, both Adobe Inc. and StoneCo Ltd. experienced declining stock prices, with Adobe showing a sharper fall and higher volatility, while StoneCo’s decline was milder and steadier.
Trend Comparison
Adobe Inc.’s stock fell 46.85% over the past year, marking a bearish trend with deceleration. It ranged between $578.34 high and $293.25 low, showing significant volatility (std dev 78.57).
StoneCo Ltd. dropped 3.24% over the same period, also bearish with deceleration. Its price fluctuated between $19.40 and $7.85, with much lower volatility (std dev 2.9).
Adobe’s decline is substantially larger and more volatile than StoneCo’s, which delivered the highest relative market performance despite a mild bearish trend.
Target Prices
Analysts present a moderate upside for Adobe Inc. and limited upside for StoneCo Ltd. based on current target consensus.
| Company | Target Low | Target High | Consensus |
|---|---|---|---|
| Adobe Inc. | 280 | 500 | 390.31 |
| StoneCo Ltd. | 19 | 21 | 19.83 |
Adobe’s consensus target at 390.31 implies a 33% premium to the 293.25 stock price, signaling strong growth expectations. StoneCo’s consensus target near 19.83 remains close to the current 16.14 price, reflecting cautious optimism.

Don’t Let Luck Decide Your Entry Point
Optimize your entry points with our advanced ProRealTime indicators. You’ll get efficient buy signals with precise price targets for maximum performance. Start outperforming now!
How do institutions grade them?
Adobe Inc. Grades
Here are the recent institutional grades for Adobe Inc. from well-known firms:
| Grading Company | Action | New Grade | Date |
|---|---|---|---|
| UBS | Maintain | Neutral | 2026-01-26 |
| Oppenheimer | Downgrade | Perform | 2026-01-13 |
| BMO Capital | Downgrade | Market Perform | 2026-01-09 |
| Jefferies | Downgrade | Hold | 2026-01-05 |
| Citigroup | Maintain | Neutral | 2025-12-17 |
| BMO Capital | Maintain | Outperform | 2025-12-15 |
| Keybanc | Downgrade | Underweight | 2025-12-15 |
| Wolfe Research | Maintain | Outperform | 2025-12-11 |
| TD Cowen | Maintain | Hold | 2025-12-11 |
| Oppenheimer | Maintain | Outperform | 2025-12-11 |
StoneCo Ltd. Grades
Here are the latest institutional grades for StoneCo Ltd. from reputable financial institutions:
| Grading Company | Action | New Grade | Date |
|---|---|---|---|
| UBS | Maintain | Buy | 2026-01-28 |
| Goldman Sachs | Maintain | Buy | 2026-01-28 |
| Goldman Sachs | Maintain | Buy | 2025-10-14 |
| B of A Securities | Maintain | Buy | 2025-09-09 |
| UBS | Maintain | Buy | 2025-08-29 |
| JP Morgan | Maintain | Overweight | 2025-07-16 |
| Barclays | Maintain | Equal Weight | 2025-05-12 |
| Barclays | Maintain | Equal Weight | 2025-04-23 |
| Citigroup | Upgrade | Buy | 2025-04-22 |
| Morgan Stanley | Maintain | Underweight | 2025-03-21 |
Which company has the best grades?
StoneCo Ltd. consistently receives Buy ratings from major banks, signaling stronger institutional confidence. Adobe Inc. shows multiple downgrades and neutral stances, reflecting more cautious sentiment. Investors may perceive StoneCo as having better momentum based on these grades.
Risks specific to each company
The following categories identify the critical pressure points and systemic threats facing both firms in the 2026 market environment:
1. Market & Competition
Adobe Inc.
- Dominates digital media and experience markets with strong brand loyalty and high ROIC of 36.7%.
StoneCo Ltd.
- Faces intense competition in Brazil’s fintech space, with negative net margin and ROE signaling operational struggles.
2. Capital Structure & Debt
Adobe Inc.
- Maintains moderate debt-to-equity ratio at 0.57 with strong interest coverage of 33.96, indicating low financial risk.
StoneCo Ltd.
- Higher leverage with debt-to-equity at 1.1 and weaker interest coverage of 5.41 increases financial vulnerability.
3. Stock Volatility
Adobe Inc.
- Beta at 1.53 suggests moderate volatility but consistent market confidence given stable trading volumes.
StoneCo Ltd.
- Beta of 1.84 indicates higher volatility, reflecting market uncertainty amid operational and geopolitical risks.
4. Regulatory & Legal
Adobe Inc.
- Operates mainly in mature US technology markets with manageable regulatory risk.
StoneCo Ltd.
- Exposed to evolving Brazilian financial regulations and legal frameworks that could impact fintech operations.
5. Supply Chain & Operations
Adobe Inc.
- Benefits from cloud-based distribution reducing physical supply chain risks.
StoneCo Ltd.
- Dependent on local infrastructure and partner networks, making it vulnerable to operational disruptions in Brazil.
6. ESG & Climate Transition
Adobe Inc.
- Strong ESG initiatives aligned with global tech standards, enhancing brand reputation and investor appeal.
StoneCo Ltd.
- ESG efforts less mature; faces pressure from Brazil’s environmental and social regulatory landscape.
7. Geopolitical Exposure
Adobe Inc.
- Primarily US-focused with stable geopolitical environment.
StoneCo Ltd.
- High exposure to Brazil’s political volatility and currency risks affecting financial performance.
Which company shows a better risk-adjusted profile?
Adobe’s dominant market position, superior capital structure, and robust Altman Z-score of 8.14 place it in a safe financial zone. StoneCo’s distress-level Z-score of 1.02 and weak profitability heighten risk, despite favorable asset turnover and valuation metrics. Adobe clearly shows a stronger risk-adjusted profile, reflecting resilience amid market and geopolitical headwinds. StoneCo’s key concern is its negative profitability amid Brazil’s regulatory and political uncertainties, underscored by its recent stock price decline and elevated beta.
Final Verdict: Which stock to choose?
Adobe Inc. wields unmatched efficiency as its superpower, delivering strong and growing returns on invested capital. Its key point of vigilance lies in a tight liquidity position, signaling the need for careful cash flow management. Adobe suits portfolios aiming for Aggressive Growth with a durable moat.
StoneCo Ltd. leverages a strategic moat in its recurring revenue streams within the fintech space, offering resilience. Compared to Adobe, StoneCo presents a more cautious safety profile, though profitability challenges remain. It fits investors seeking GARP—Growth at a Reasonable Price—with a tilt toward emerging market exposure.
If you prioritize sustainable profitability and a proven value creator, Adobe outshines with superior capital efficiency and growth durability. However, if you seek exposure to fintech innovation with potentially higher volatility but reasonable valuation, StoneCo offers better stability in a fast-evolving sector. Both demand vigilance; your choice depends on risk tolerance and portfolio strategy.
Disclaimer: Investment carries a risk of loss of initial capital. The past performance is not a reliable indicator of future results. Be sure to understand risks before making an investment decision.
Go Further
I encourage you to read the complete analyses of Adobe Inc. and StoneCo Ltd. to enhance your investment decisions: