Home > Comparison > Technology > ADBE vs PANW
The strategic rivalry between Adobe Inc. and Palo Alto Networks defines the current trajectory of the technology sector’s software infrastructure industry. Adobe operates as a diversified software titan focusing on digital media and customer experience platforms. In contrast, Palo Alto Networks specializes in cybersecurity solutions with a sharp focus on threat prevention and cloud security. This analysis evaluates which company’s strategic model offers the superior risk-adjusted return for a diversified portfolio in 2026.

Table of contents
Companies Overview
Adobe Inc. and Palo Alto Networks, Inc. stand as pivotal players in the evolving software infrastructure market.
Adobe Inc.: The Creative Cloud Pioneer
Adobe dominates as a diversified software leader, primarily generating revenue from its Creative Cloud subscription. It serves a broad user base including content creators and marketers. In 2026, Adobe’s strategic focus sharpens on expanding its Digital Experience segment, enhancing customer analytics and commerce capabilities to deepen brand engagement.
Palo Alto Networks, Inc.: Cybersecurity Innovator
Palo Alto Networks leads the cybersecurity front by providing advanced firewall appliances and subscription services that protect enterprises and governments. Its 2026 strategy emphasizes cloud security and automation, aiming to secure hybrid environments through integrated threat intelligence and professional services.
Strategic Collision: Similarities & Divergences
Both companies operate in software infrastructure but diverge fundamentally: Adobe builds a creative and marketing ecosystem, while Palo Alto Networks crafts a security-first platform. Their primary battleground lies in digital enterprise transformation—content creation versus cyber defense. Investors face distinct profiles: Adobe’s growth rides on creative tools, whereas Palo Alto’s strength is rooted in the escalating demand for cybersecurity solutions.
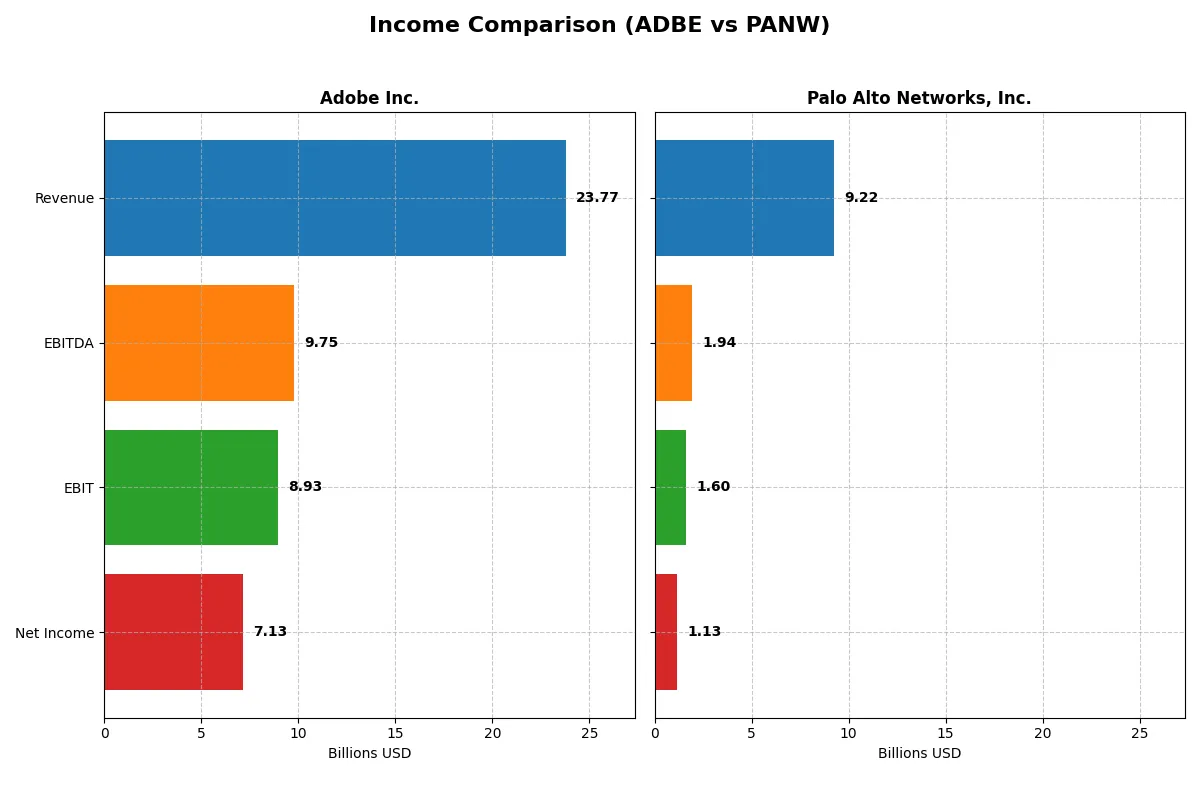
Income Statement Comparison
This table dissects the core profitability and scalability of both corporate engines to reveal who dominates the bottom line:
| Metric | Adobe Inc. (ADBE) | Palo Alto Networks, Inc. (PANW) |
|---|---|---|
| Revenue | 23.8B | 9.2B |
| Cost of Revenue | 2.7B | 2.5B |
| Operating Expenses | 12.4B | 5.5B |
| Gross Profit | 21.1B | 6.8B |
| EBITDA | 9.7B | 1.9B |
| EBIT | 8.9B | 1.6B |
| Interest Expense | 263M | 3M |
| Net Income | 7.1B | 1.1B |
| EPS | 16.73 | 1.71 |
| Fiscal Year | 2025 | 2025 |
Income Statement Analysis: The Bottom-Line Duel
This income statement comparison reveals which company runs the more efficient and profitable corporate engine through recent years’ financials.
Adobe Inc. Analysis
Adobe’s revenue rose steadily from 15.8B in 2021 to 23.8B in 2025, with net income climbing from 4.8B to 7.1B. Gross margins remain robust near 89%, while net margins hold strong at 30%. The 2025 results highlight excellent margin expansion and operating leverage, driving 25.8% EBIT growth and solid EPS gains.
Palo Alto Networks, Inc. Analysis
Palo Alto’s revenue doubled from 4.3B in 2021 to 9.2B in 2025, with net income surging over 300% to 1.1B. Gross margin stays healthy at 73%, but net margin lags at 12.3%. Despite impressive top-line growth and a 60.9% jump in EBIT last year, net margin and EPS dipped recently, indicating margin pressure amid expansion.
Margin Strength vs. Growth Surge
Adobe delivers superior profitability and consistent margin expansion with a 30% net margin, outpacing Palo Alto’s 12.3%. Palo Alto boasts faster revenue and income growth but struggles with recent margin compression. For investors prioritizing stable earnings quality and margin power, Adobe’s profile appears more attractive than Palo Alto’s rapid but less efficient growth.
Financial Ratios Comparison
These vital ratios act as a diagnostic tool to expose the underlying fiscal health, valuation premiums, and capital efficiency of these companies:
| Ratios | Adobe Inc. (ADBE) | Palo Alto Networks, Inc. (PANW) |
|---|---|---|
| ROE | 61.3% | 14.5% |
| ROIC | 36.7% | 5.7% |
| P/E | 19.1 | 101.4 |
| P/B | 11.7 | 14.7 |
| Current Ratio | 1.00 | 0.89 |
| Quick Ratio | 1.00 | 0.89 |
| D/E | 0.57 | 0.04 |
| Debt-to-Assets | 22.5% | 1.4% |
| Interest Coverage | 33.1 | 414.3 |
| Asset Turnover | 0.81 | 0.39 |
| Fixed Asset Turnover | 10.9 | 12.6 |
| Payout ratio | 0 | 0 |
| Dividend yield | 0 | 0 |
| Fiscal Year | 2025 | 2025 |
Efficiency & Valuation Duel: The Vital Signs
Ratios act as a company’s DNA, revealing hidden risks and operational excellence critical for investment decisions.
Adobe Inc.
Adobe demonstrates robust profitability with a 61.34% ROE and a strong 30% net margin, signaling operational efficiency. Its P/E of 19.13 suggests a fairly valued stock, neither cheap nor stretched. Adobe does not pay dividends but reinvests heavily in R&D, fueling sustained growth and shareholder value over time.
Palo Alto Networks, Inc.
Palo Alto shows moderate profitability with a 14.49% ROE and a 12.3% net margin, reflecting solid but less efficient operations. The stock trades at a high P/E of 101.43, indicating an expensive valuation. It also offers no dividends, focusing capital on R&D to support future innovation and expansion.
Valuation Discipline vs. Growth Premium
Adobe balances strong returns with reasonable valuation, offering more operational safety. Palo Alto carries premium growth expectations but risks overvaluation. Investors seeking steadier fundamentals may prefer Adobe, while those chasing high growth might consider Palo Alto’s profile.
Which one offers the Superior Shareholder Reward?
Adobe Inc. (ADBE) and Palo Alto Networks, Inc. (PANW) both forego dividends, focusing on growth reinvestment. Adobe’s free cash flow per share stands at $23.1B with zero dividend payout, signaling robust reinvestment capacity. Palo Alto’s free cash flow per share is $5.2B, also with no dividends, but it shows a more modest margin profile. Adobe’s aggressive buyback program, reflected in its strong cash flow coverage ratios, contrasts with Palo Alto’s lower operating cash flow ratio at 0.47 and weaker solvency. Adobe’s sustainable capital allocation, high gross margin of 88.6%, and consistent free cash flow generation offer a superior total return profile in 2026 compared to Palo Alto’s riskier leverage and lower profitability. I conclude Adobe provides the more attractive and sustainable shareholder reward.
Comparative Score Analysis: The Strategic Profile
The radar chart reveals the fundamental DNA and trade-offs of Adobe Inc. and Palo Alto Networks, highlighting their financial strengths and risk exposures:
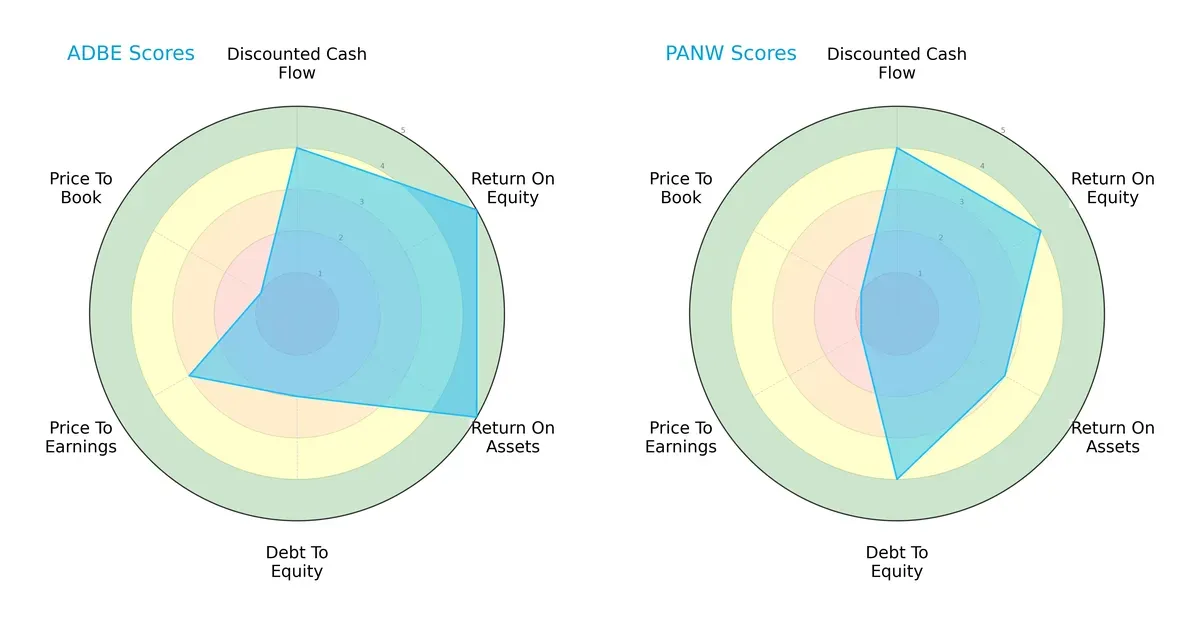
Adobe shows a more balanced profile with top scores in ROE (5) and ROA (5), reflecting efficient capital and asset use. Palo Alto Networks leans on a stronger debt-to-equity score (4), indicating better leverage management but falls behind in ROA (3) and valuation metrics (P/E and P/B scores at 1). Adobe’s moderate debt score (2) and valuation scores suggest some risk in financial structure and market pricing. Overall, Adobe dominates on profitability and asset efficiency, while Palo Alto Networks relies on conservative leverage as its main edge.
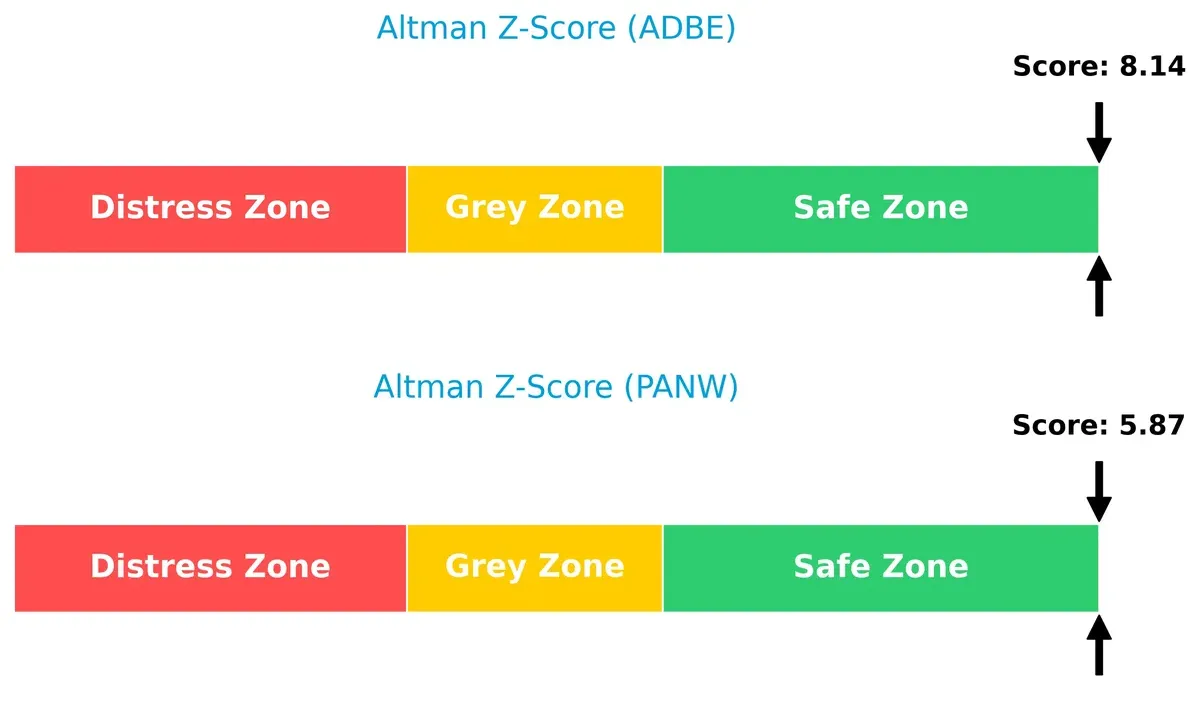
Bankruptcy Risk: Solvency Showdown
Adobe’s Altman Z-Score at 8.14 vastly outperforms Palo Alto Networks’ 5.87, placing both firmly in the safe zone but showing Adobe’s superior buffer against financial distress in this cycle:
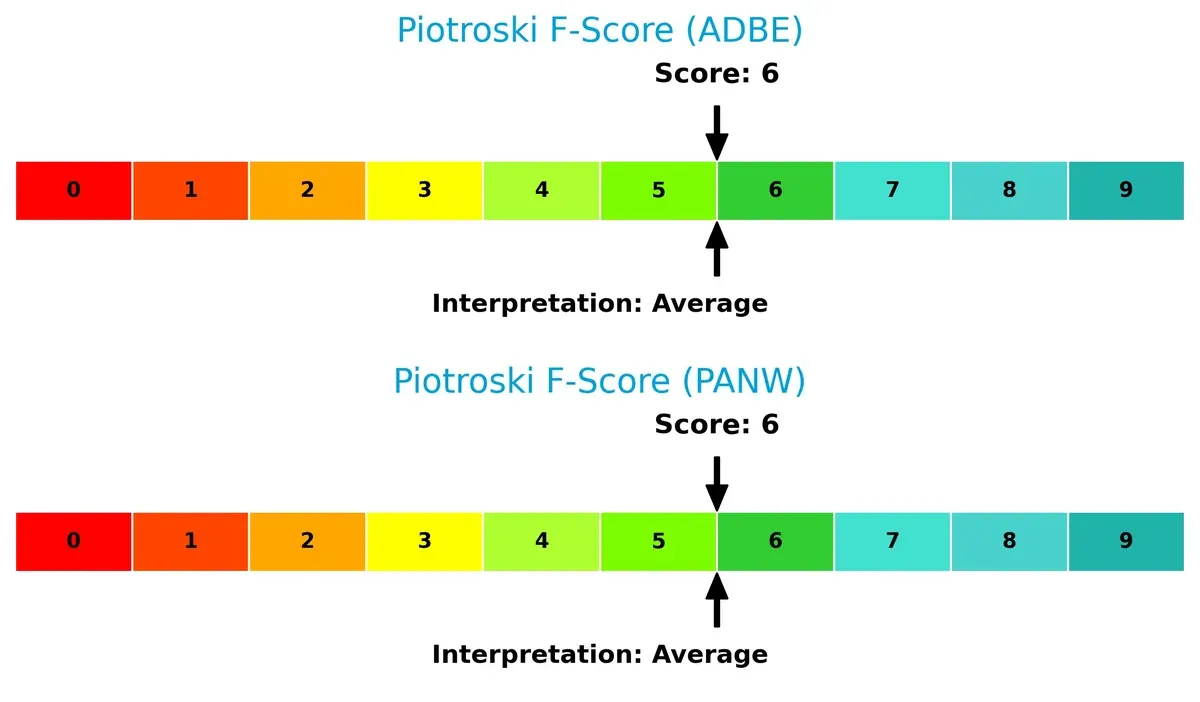
Financial Health: Quality of Operations
Both companies score an average 6 on the Piotroski F-Score, indicating stable but not peak financial health. Neither shows immediate red flags, but there’s room for improvement in operational efficiency and financial robustness:
How are the two companies positioned?
This section dissects Adobe and Palo Alto Networks’ operational DNA by comparing their revenue distribution and internal dynamics. The goal is to confront their economic moats to reveal which model delivers the most resilient competitive advantage today.
Revenue Segmentation: The Strategic Mix
This visual comparison dissects how Adobe Inc. and Palo Alto Networks diversify income streams and reveals their primary sector bets:
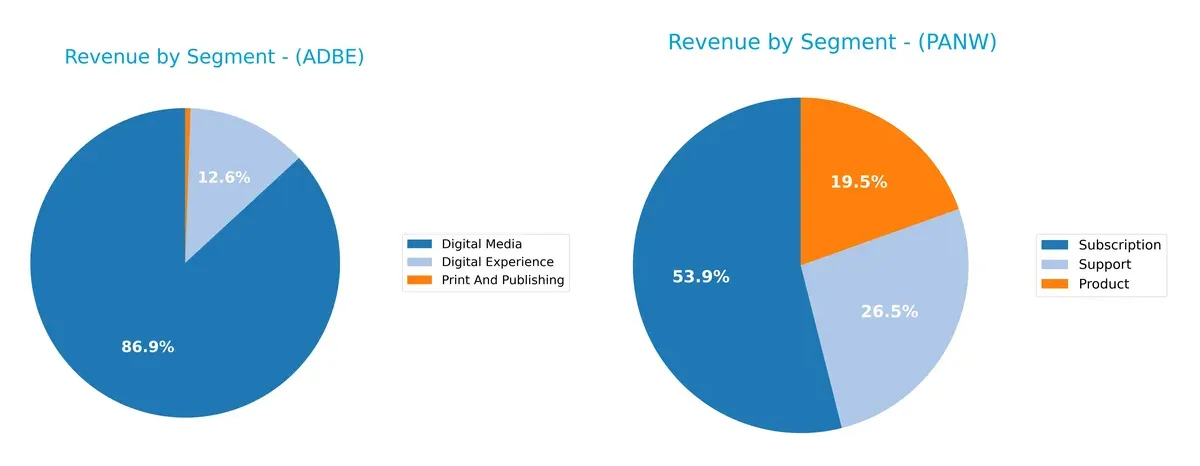
Adobe’s revenue pivots heavily on Digital Media at $40.4B, dwarfing its Digital Experience segment at $5.9B. Palo Alto Networks shows a more balanced mix with $5B from Subscription, $2.4B from Support, and $1.8B Product sales. Adobe’s concentration signals dominance in creative software but exposes concentration risk. PANW’s diverse streams reflect ecosystem lock-in in cybersecurity, reducing vulnerability to single-segment downturns.
Strengths and Weaknesses Comparison
This table compares the strengths and weaknesses of Adobe Inc. and Palo Alto Networks, Inc.:
Adobe Inc. Strengths
- Diverse revenue streams across Digital Media, Digital Experience, and Print segments
- Strong profitability with 30% net margin and 61.34% ROE
- Favorable debt-to-assets at 22.54% supports financial stability
- High interest coverage ratio of 33.96 indicates solid ability to service debt
- Robust global presence with significant Americas and EMEA revenue
Palo Alto Networks Strengths
- Subscription-based business model ensures recurring revenue
- Favorable WACC at 7.34% supports efficient capital use
- Very low debt-to-assets ratio at 1.43% reduces financial risk
- Exceptional interest coverage ratio at 532.53 reflects strong earnings vs. interest expense
- Expanding global footprint across Americas, Asia Pacific, and EMEA
Adobe Inc. Weaknesses
- Current ratio at 1.0 signals tight short-term liquidity
- Unfavorable WACC of 10.6% increases capital costs
- High PB ratio at 11.73 suggests premium valuation
- No dividend yield limits income for shareholders
- Moderate asset turnover of 0.81 may indicate less efficient asset use
Palo Alto Networks Weaknesses
- Low current ratio at 0.89 flags liquidity concerns
- High PE ratio of 101.43 implies expensive valuation
- Asset turnover at 0.39 is weak, reflecting lower efficiency
- No dividend yield reduces direct shareholder returns
The comparison reveals both companies share slightly favorable overall financial profiles but face liquidity and valuation challenges. Adobe’s diversified revenue and strong profitability contrast with Palo Alto’s lean balance sheet and recurring revenue model. Each company must address weaknesses to sustain competitive positioning.
The Moat Duel: Analyzing Competitive Defensibility
A structural moat is the only reliable shield protecting long-term profits from relentless competition erosion. Let’s dissect where Adobe and Palo Alto Networks stand:
Adobe Inc.: Subscription Powerhouse with Intangible Assets
Adobe’s moat stems from its dominant subscription model and strong intangible assets like Creative Cloud. Its high ROIC of 26% far exceeds WACC, showing durable value creation. Expansion into AI-driven creative tools in 2026 could deepen this moat further.
Palo Alto Networks, Inc.: Rapidly Scaling Security Innovator
Palo Alto’s moat is fueled by network effects and integration in cybersecurity platforms. Despite a negative ROIC vs WACC, its soaring ROIC trend signals improving capital efficiency. Growth in cloud security and zero-trust solutions could disrupt markets and strengthen its position.
Moat Strength Showdown: Intangible Assets vs. Network Effects
Adobe holds the deeper moat with clear value creation and margin stability, while Palo Alto’s improving profitability suggests a developing moat. Adobe is better equipped today to defend its market share against competitive threats.
Which stock offers better returns?
Over the past 12 months, Adobe Inc. experienced a significant price decline, while Palo Alto Networks, Inc. showed notable gains before recent downward pressure.
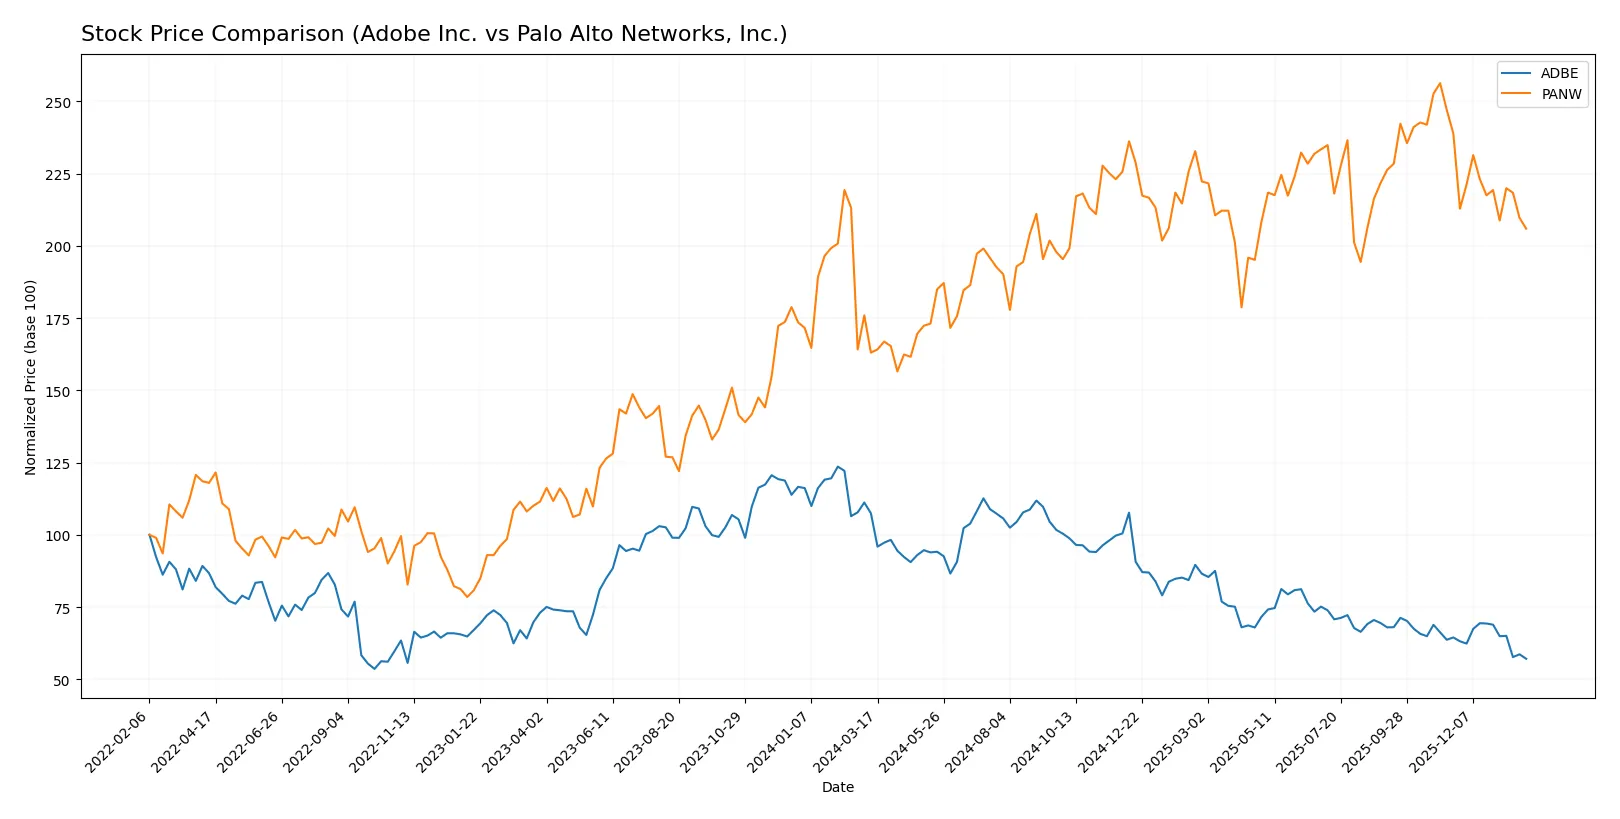
Trend Comparison
Adobe Inc.’s stock fell 46.85% over the last year, marking a bearish trend with decelerating losses. The price ranged from 578.34 to 293.25, reflecting high volatility (std dev 78.57).
Palo Alto Networks, Inc. gained 26.32% over the same period, a bullish but decelerating trend. Its price fluctuated between 134.51 and 220.24, with moderate volatility (std dev 19.37).
Comparing trends, Palo Alto Networks delivered higher market returns than Adobe by a wide margin over the past year.
Target Prices
Analysts show a bullish consensus for both Adobe Inc. and Palo Alto Networks, reflecting strong growth expectations.
| Company | Target Low | Target High | Consensus |
|---|---|---|---|
| Adobe Inc. | 280 | 500 | 390.31 |
| Palo Alto Networks | 157 | 265 | 231.07 |
The target consensus for Adobe at 390.31 implies a 33% upside from its current 293.25 price. Palo Alto Networks’ 231.07 consensus suggests a 31% potential gain from 176.97, indicating solid investor confidence.

Don’t Let Luck Decide Your Entry Point
Optimize your entry points with our advanced ProRealTime indicators. You’ll get efficient buy signals with precise price targets for maximum performance. Start outperforming now!
How do institutions grade them?
Here is a summary of recent institutional grades for Adobe Inc. and Palo Alto Networks, Inc.:
Adobe Inc. Grades
This table presents recent grades and rating actions for Adobe Inc. from major firms.
| Grading Company | Action | New Grade | Date |
|---|---|---|---|
| UBS | Maintain | Neutral | 2026-01-26 |
| Oppenheimer | Downgrade | Perform | 2026-01-13 |
| BMO Capital | Downgrade | Market Perform | 2026-01-09 |
| Jefferies | Downgrade | Hold | 2026-01-05 |
| Citigroup | Maintain | Neutral | 2025-12-17 |
| BMO Capital | Maintain | Outperform | 2025-12-15 |
| Keybanc | Downgrade | Underweight | 2025-12-15 |
| Wolfe Research | Maintain | Outperform | 2025-12-11 |
| TD Cowen | Maintain | Hold | 2025-12-11 |
| Oppenheimer | Maintain | Outperform | 2025-12-11 |
Palo Alto Networks, Inc. Grades
Below are recent grades and rating actions for Palo Alto Networks, Inc. by leading analysts.
| Grading Company | Action | New Grade | Date |
|---|---|---|---|
| Needham | Maintain | Buy | 2026-01-28 |
| UBS | Maintain | Neutral | 2026-01-13 |
| Piper Sandler | Maintain | Overweight | 2026-01-05 |
| Guggenheim | Upgrade | Neutral | 2026-01-05 |
| Morgan Stanley | Maintain | Overweight | 2025-12-18 |
| HSBC | Downgrade | Reduce | 2025-11-21 |
| Goldman Sachs | Maintain | Buy | 2025-11-21 |
| Rosenblatt | Maintain | Buy | 2025-11-20 |
| Oppenheimer | Maintain | Outperform | 2025-11-20 |
| Wedbush | Maintain | Outperform | 2025-11-20 |
Which company has the best grades?
Palo Alto Networks maintains stronger ratings overall, with multiple Buy and Overweight grades. Adobe shows a trend of recent downgrades to Neutral and Hold, signaling more cautious sentiment. Investors may interpret this as Palo Alto Networks enjoying more analyst confidence currently.
Risks specific to each company
The following categories identify critical pressure points and systemic threats facing Adobe Inc. and Palo Alto Networks, Inc. in the 2026 market environment:
1. Market & Competition
Adobe Inc.
- Faces intense competition in digital media and cloud software sectors, with pressure from emerging SaaS startups and tech giants.
Palo Alto Networks, Inc.
- Operates in a highly competitive cybersecurity market, challenged by rapid innovation and evolving threat landscapes.
2. Capital Structure & Debt
Adobe Inc.
- Moderate debt-to-equity ratio (0.57) with strong interest coverage (33.96), signaling manageable leverage but a relatively high WACC (10.6%).
Palo Alto Networks, Inc.
- Very low debt (D/E 0.04), excellent interest coverage (532.53), and favorable WACC (7.34%) reflect a conservative and stable capital structure.
3. Stock Volatility
Adobe Inc.
- Higher beta (1.526) indicates greater sensitivity to market swings, increasing volatility risk.
Palo Alto Networks, Inc.
- Lower beta (0.754) suggests relative stability compared to market fluctuations, reducing volatility risk.
4. Regulatory & Legal
Adobe Inc.
- Subject to global data privacy laws and software licensing regulations, with potential litigation risks in intellectual property.
Palo Alto Networks, Inc.
- Faces complex cybersecurity compliance requirements and potential liability from breach incidents or regulatory enforcement.
5. Supply Chain & Operations
Adobe Inc.
- Relies heavily on cloud infrastructure providers and global digital distribution, vulnerable to service outages and cyber risks.
Palo Alto Networks, Inc.
- Depends on hardware supply chains for firewall appliances, exposed to component shortages and geopolitical supply disruptions.
6. ESG & Climate Transition
Adobe Inc.
- Increasing pressure to demonstrate sustainable cloud operations and responsible data management policies.
Palo Alto Networks, Inc.
- Must address environmental impacts of device manufacturing and energy consumption in data centers, alongside social governance scrutiny.
7. Geopolitical Exposure
Adobe Inc.
- Global footprint exposes it to trade tensions, export controls, and localization laws affecting software distribution.
Palo Alto Networks, Inc.
- Cybersecurity solutions are critical in government sectors, increasing exposure to geopolitical conflicts and regulatory uncertainty.
Which company shows a better risk-adjusted profile?
Adobe’s most impactful risk is its high market volatility and capital costs amid fierce competition. Palo Alto Networks faces significant risks from elevated valuation multiples and supply chain vulnerabilities. I see Palo Alto Networks as having a slightly better risk-adjusted profile due to its stronger balance sheet and lower beta. However, its sky-high P/E ratio signals overvaluation risk, warranting caution.
Final Verdict: Which stock to choose?
Adobe Inc. excels as a cash-generating powerhouse with a durable competitive advantage, demonstrated by its high ROIC well above WACC. Its point of vigilance lies in a tight liquidity position, which may pressure short-term flexibility. Adobe suits investors seeking aggressive growth with a focus on long-term value creation.
Palo Alto Networks commands a strategic moat through cloud security dominance and a resilient recurring revenue model. Compared to Adobe, it offers a safer balance sheet with minimal debt and robust interest coverage, though at a premium valuation. It fits well in GARP portfolios that balance growth potential and risk management.
If you prioritize proven capital efficiency and value creation, Adobe outshines due to its strong moat and consistent profitability. However, if you seek growth with better balance sheet safety and a subscription-driven model, Palo Alto Networks offers superior stability and recurring revenue visibility. Both present analytical scenarios worth considering, depending on your risk tolerance and investment horizon.
Disclaimer: Investment carries a risk of loss of initial capital. The past performance is not a reliable indicator of future results. Be sure to understand risks before making an investment decision.
Go Further
I encourage you to read the complete analyses of Adobe Inc. and Palo Alto Networks, Inc. to enhance your investment decisions: