Home > Comparison > Technology > PLTR vs ADBE
The strategic rivalry between Palantir Technologies Inc. and Adobe Inc. shapes the evolving landscape of software infrastructure. Palantir operates as a data-centric, mission-critical platform provider for intelligence and enterprise users. Adobe excels as a diversified software powerhouse, specializing in creative and digital experience solutions. This analysis explores their contrasting growth models and sector leadership ambitions to identify which offers superior risk-adjusted returns for a diversified portfolio.
Table of contents
Companies Overview
Palantir Technologies Inc. and Adobe Inc. stand as pivotal innovators in the software infrastructure market.
Palantir Technologies Inc.: Data-Driven Intelligence Pioneer
Palantir dominates software platforms for intelligence and operational data analysis. Its core revenue driver is selling sophisticated platforms like Gotham and Foundry that enable government and commercial clients to uncover actionable insights from complex datasets. In 2026, Palantir focuses heavily on expanding AI integration and enhancing deployment flexibility across varied environments.
Adobe Inc.: Creative and Experience Software Leader
Adobe excels as a diversified software provider for creative professionals and enterprises. It generates revenue primarily through subscription-based services like Creative Cloud and Digital Experience platforms, empowering users to produce and manage digital content. Adobe’s 2026 strategy targets growth in customer experience management and cloud-based document solutions.
Strategic Collision: Similarities & Divergences
Both firms operate in software infrastructure but diverge sharply in approach: Palantir pursues a closed ecosystem geared to intelligence and operational data, while Adobe thrives on an open, subscription-driven creative suite and experience platform. Their primary competition centers on enterprise data utilization, with Palantir focusing on analytics and Adobe on content creation and customer experience. These distinct models appeal differently to investors seeking innovation in data intelligence versus digital creativity.
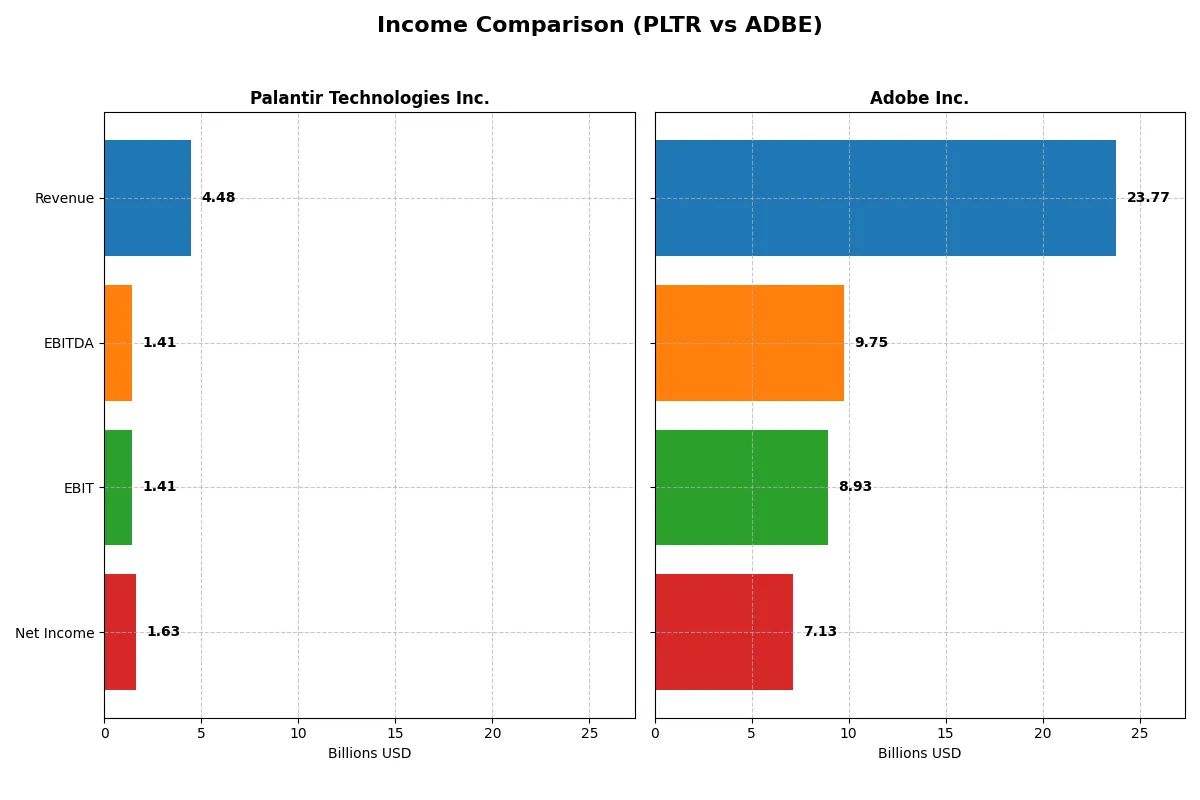
Income Statement Comparison
This data dissects the core profitability and scalability of both corporate engines to reveal who dominates the bottom line:
| Metric | Palantir Technologies Inc. (PLTR) | Adobe Inc. (ADBE) |
|---|---|---|
| Revenue | 4.48B | 23.77B |
| Cost of Revenue | 789M | 2.71B |
| Operating Expenses | 2.27B | 12.36B |
| Gross Profit | 3.69B | 21.06B |
| EBITDA | 1.41B | 9.75B |
| EBIT | 1.41B | 8.93B |
| Interest Expense | 0 | 263M |
| Net Income | 1.63B | 7.13B |
| EPS | 0.69 | 16.73 |
| Fiscal Year | 2025 | 2025 |
Income Statement Analysis: The Bottom-Line Duel
The following income statement comparison reveals which company runs a more efficient and profitable corporate engine through recent financial performance.
Palantir Technologies Inc. Analysis
Palantir’s revenue surged from $1.54B in 2021 to $4.48B in 2025, reflecting robust growth. Net income turned sharply positive, reaching $1.63B in 2025, with net margins expanding to 36%. Gross margins consistently hover above 80%, signaling strong cost control and scalable operations. The latest year shows impressive momentum in profitability and expanding operating leverage.
Adobe Inc. Analysis
Adobe’s revenue increased steadily, hitting $23.77B in 2025 from $15.79B in 2021. Net income rose to $7.13B in 2025, sustaining a solid 30% net margin. Adobe maintains superior gross margins above 88%, with efficient cost management reflected in an EBIT margin nearing 38%. Growth is steady but less explosive than Palantir, emphasizing stable, high-margin profitability.
Growth Surge vs. Established Profitability
Palantir dominates in revenue and net income growth rates, achieving a remarkable 190% revenue increase over five years and a 412% net income jump. Adobe delivers consistent, high-margin returns and scale, but with slower growth of 50% revenue and 48% net income over the same period. For investors, Palantir’s rapid expansion appeals to growth seekers, while Adobe’s proven profitability suits those favoring steady, mature cash flows.
Financial Ratios Comparison
These vital ratios act as a diagnostic tool to expose the underlying fiscal health, valuation premiums, and capital efficiency of the companies compared:
| Ratios | Palantir Technologies Inc. (PLTR) | Adobe Inc. (ADBE) |
|---|---|---|
| ROE | 9.2% | 61.3% |
| ROIC | 5.5% | 36.7% |
| P/E | 368.2 | 19.1 |
| P/B | 34.0 | 11.7 |
| Current Ratio | 6.0 | 1.0 |
| Quick Ratio | 6.0 | 1.0 |
| D/E | 0.05 | 0.57 |
| Debt-to-Assets | 3.8% | 22.5% |
| Interest Coverage | 0 (not meaningful) | 33.1 |
| Asset Turnover | 0.45 | 0.81 |
| Fixed Asset Turnover | 11.9 | 10.9 |
| Payout ratio | 0% | 0% |
| Dividend yield | 0% | 0% |
| Fiscal Year | 2024 | 2025 |
Efficiency & Valuation Duel: The Vital Signs
Financial ratios act as a company’s DNA, revealing hidden risks and operational excellence critical to investment decisions.
Palantir Technologies Inc.
Palantir’s ROE at 9.24% and net margin of 16.13% indicate moderate profitability but lag behind industry leaders. Its P/E ratio of 368.2 signals an expensive, stretched valuation. The company does not pay dividends, favoring reinvestment heavily into R&D, which supports long-term growth but raises near-term risk.
Adobe Inc.
Adobe exhibits robust profitability with a 61.34% ROE and 30% net margin, reflecting strong operational efficiency. Its P/E ratio of 19.13 suggests a fairly valued stock relative to growth prospects. Adobe returns capital through no dividends, focusing on disciplined capital allocation and steady free cash flow generation for growth initiatives.
Premium Valuation vs. Operational Safety
Adobe offers a superior balance of profitability and valuation, trading at reasonable multiples with strong returns. Palantir’s valuation appears stretched despite solid margins, reflecting higher growth uncertainty. Investors seeking operational safety may favor Adobe, while those tolerating high valuation risk might consider Palantir’s growth profile.
Which one offers the Superior Shareholder Reward?
Palantir Technologies (PLTR) pays no dividends and reinvests heavily in R&D and growth, with no buybacks reported. Adobe (ADBE) also pays no dividends but delivers strong free cash flow with moderate buybacks supporting shareholder returns. Adobe’s distribution strategy is more sustainable, backed by superior margins and higher FCF per share. I find Adobe offers a more attractive total return profile in 2026.
Comparative Score Analysis: The Strategic Profile
The radar chart reveals the fundamental DNA and trade-offs of Palantir Technologies Inc. and Adobe Inc., highlighting their financial strengths and valuation challenges:
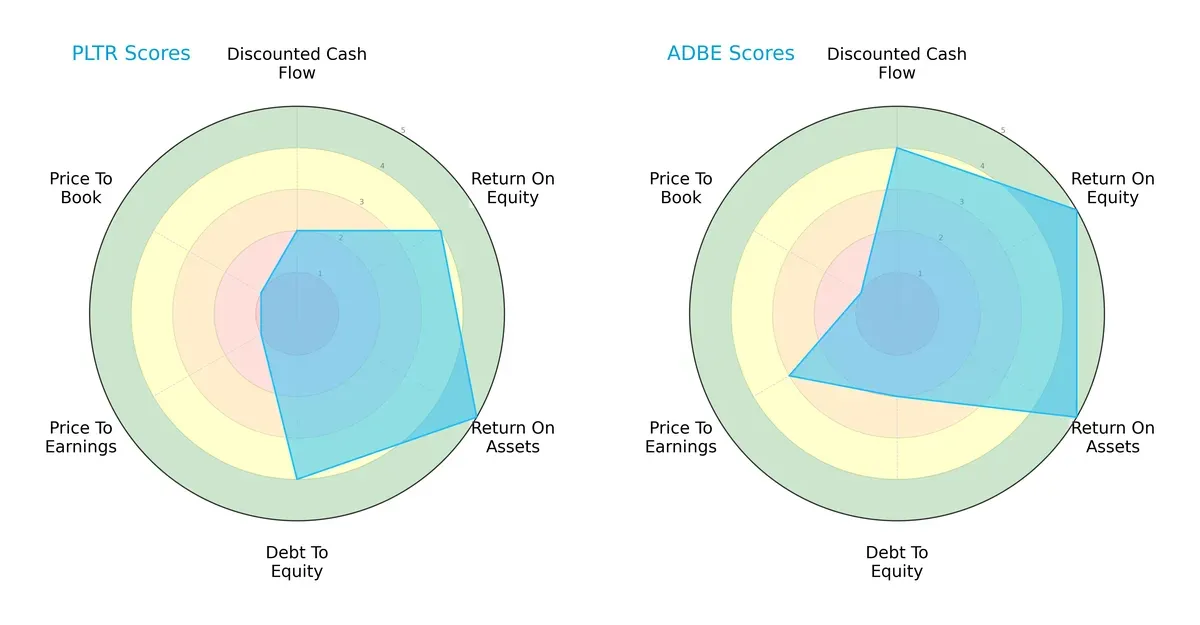
Adobe dominates in overall financial strength with a 4 versus Palantir’s 3. Adobe’s DCF score (4) and ROE (5) edge Palantir’s weaker DCF (2) but comparable ROE (4). Palantir shows superior debt management (4) compared to Adobe’s moderate score (2). Palantir’s valuation scores suffer (P/E and P/B at 1), indicating overvaluation risk, while Adobe holds moderate P/E (3) but shares a weak P/B score (1). Adobe delivers a more balanced profile; Palantir relies heavily on asset efficiency and conservative leverage.
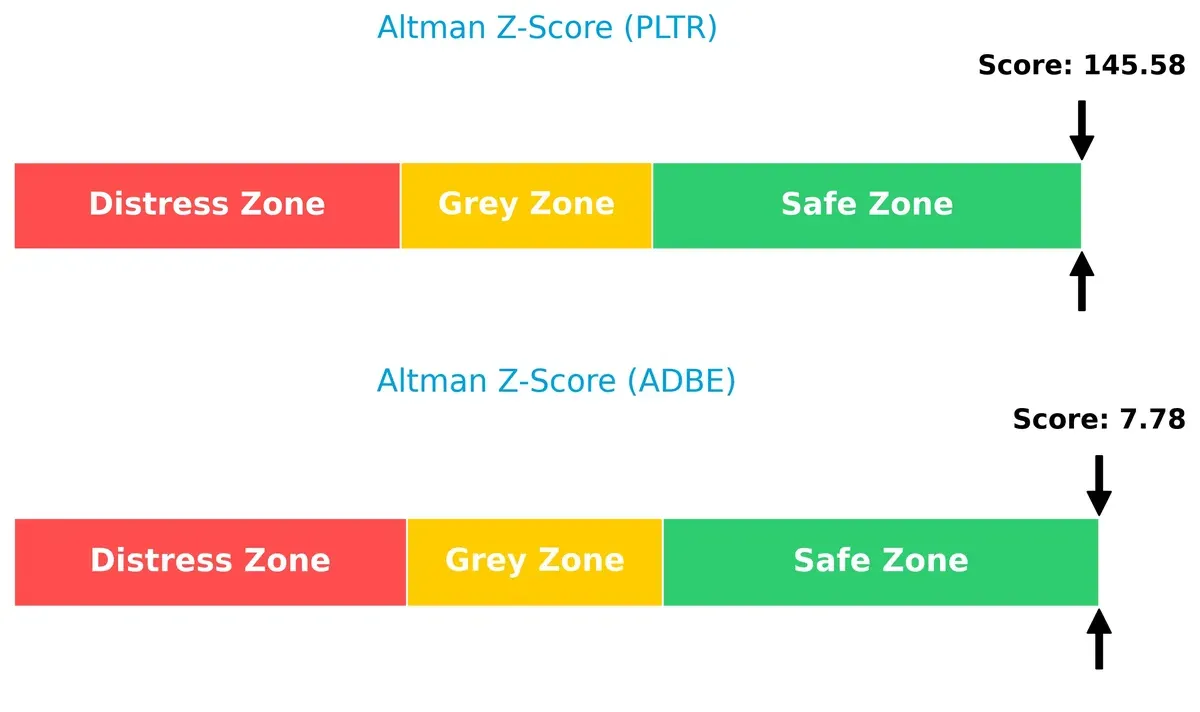
Bankruptcy Risk: Solvency Showdown
Palantir’s Altman Z-Score of 145.6 vastly outpaces Adobe’s 7.8, signaling robust solvency and negligible bankruptcy risk in this cycle:
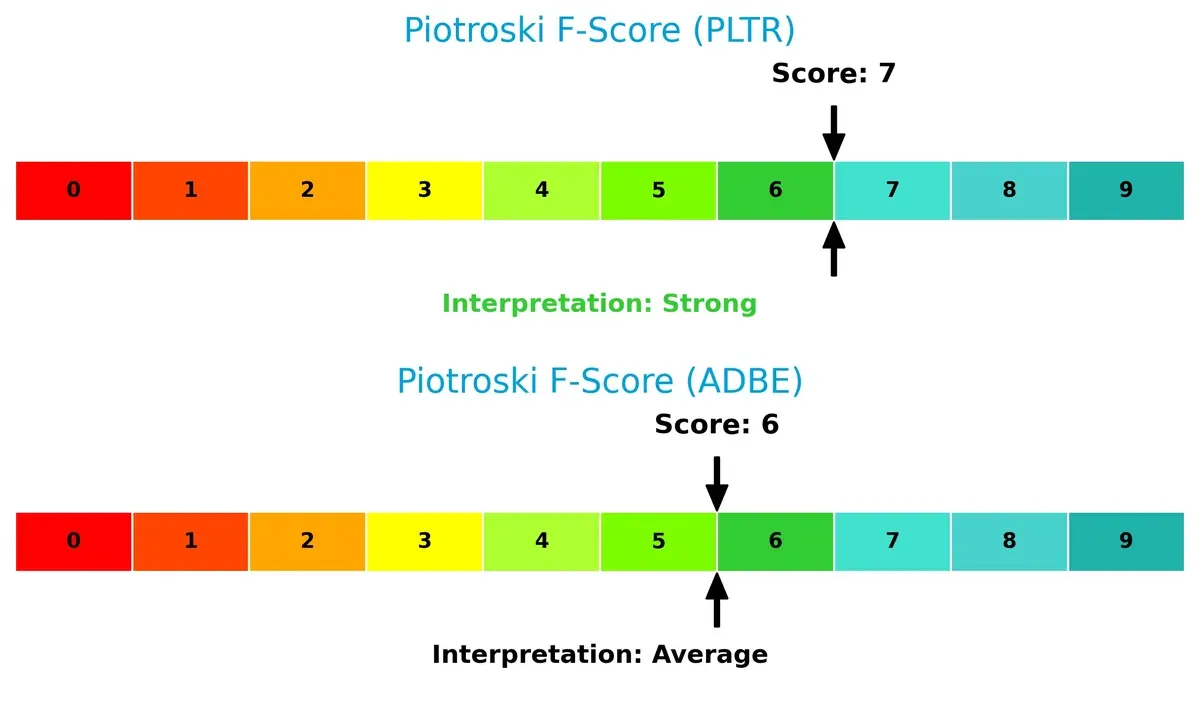
Financial Health: Quality of Operations
Palantir’s Piotroski F-Score of 7 suggests strong financial health, outperforming Adobe’s average score of 6, indicating marginally better internal operational metrics:
How are the two companies positioned?
This section dissects the operational DNA of Palantir Technologies and Adobe by comparing their revenue distribution and internal strengths and weaknesses. The goal is to confront their economic moats to identify which business model offers the most resilient competitive advantage today.
Revenue Segmentation: The Strategic Mix
This visual comparison dissects how Palantir Technologies Inc. and Adobe Inc. diversify their income streams and where their primary sector bets lie:
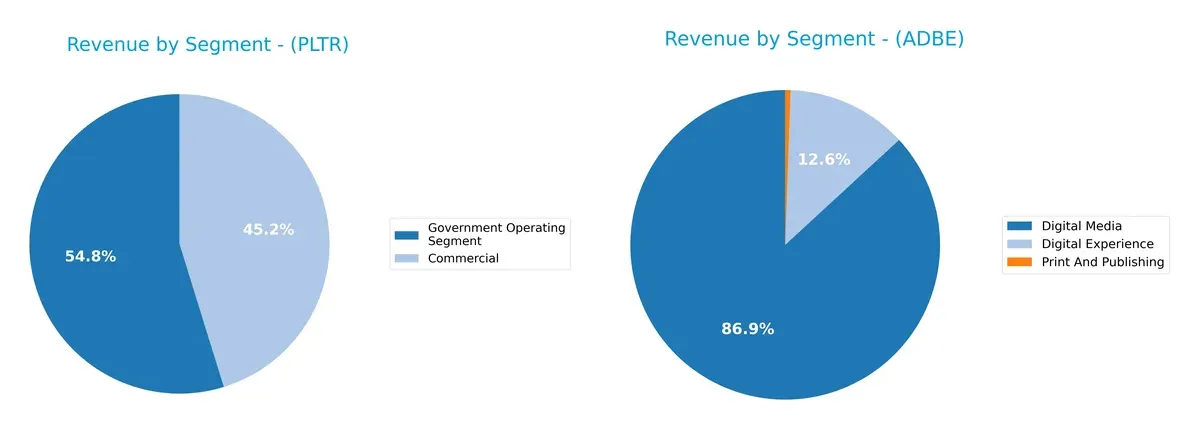
Palantir anchors its revenue in two segments: Government at $1.57B and Commercial at $1.30B in 2024, showing moderate diversification but a clear government dependency. Adobe dwarfs Palantir in scale and diversity, with Digital Media at $40.4B dominating, followed by Digital Experience at $5.9B and a smaller Print and Publishing segment at $256M. Adobe’s broad mix reduces concentration risk, leveraging an ecosystem lock-in, unlike Palantir’s infrastructure-heavy government reliance.
Strengths and Weaknesses Comparison
This table compares the Strengths and Weaknesses of Palantir Technologies Inc. and Adobe Inc.:
Palantir Strengths
- Strong growth in government and commercial revenue segments
- Very low debt-to-assets ratio at 3.77%
- High current and quick ratios indicating liquidity
- Favorable net margin at 16.13%
- Superior fixed asset turnover at 11.92
Adobe Strengths
- High profitability with net margin 30% and ROIC 36.69%
- Strong global presence across Americas, EMEA, and Asia
- Diverse product segments including Digital Media and Experience
- Robust interest coverage ratio at 33.96
- Solid asset and fixed asset turnover
Palantir Weaknesses
- Unfavorable high P/E at 368.2 and P/B at 34.01
- Low ROE at 9.24%
- Unfavorable asset turnover at 0.45
- No dividend yield
- Government segment dominates revenue, limiting diversification
- Current ratio unusually high at 5.96 may indicate inefficient asset use
Adobe Weaknesses
- Current ratio and quick ratio at 1.0 suggest limited short-term liquidity
- Debt-to-equity ratio moderate at 0.57
- Unfavorable P/B ratio at 11.73
- WACC higher than ROIC could pressure returns
- No dividend yield
Palantir excels in liquidity, low leverage, and focused government contracts but faces valuation and efficiency challenges. Adobe benefits from strong profitability, diversified global revenue streams, and product innovation, though it must manage liquidity and capital costs prudently. Both companies show distinct strategic profiles shaping their financial strengths and weaknesses.
The Moat Duel: Analyzing Competitive Defensibility
A structural moat is the only shield protecting long-term profits from relentless competition erosion. Let’s dissect how Palantir and Adobe defend their turf:
Palantir Technologies Inc.: Data Integration & Intelligence Moat
Palantir’s moat stems from its unique data integration platforms creating high switching costs for clients. Strong revenue growth and margin expansion confirm robust financial defensibility. Expansion into AI-driven analytics in 2026 could deepen this moat, though reliance on government contracts remains a risk.
Adobe Inc.: Subscription Ecosystem & Brand Moat
Adobe leverages an entrenched subscription model and brand loyalty, contrasting Palantir’s data focus. It sustains superior margins and consistent ROIC above WACC, proving solid value creation. Adobe’s push into digital experience platforms signals growth opportunities but faces market saturation challenges.
Moat Showdown: Data-Driven Intelligence vs. Subscription Dominance
Adobe’s wider moat combines brand loyalty with a subscription ecosystem yielding durable profitability. Palantir’s moat is rapidly strengthening but less proven over time. Adobe remains better equipped to defend market share amid evolving software demands.
Which stock offers better returns?
The past year reveals stark contrasts: Palantir surges with strong gains but slowing momentum. Adobe faces a steep decline, losing nearly half its value amid decelerating bearish pressure.
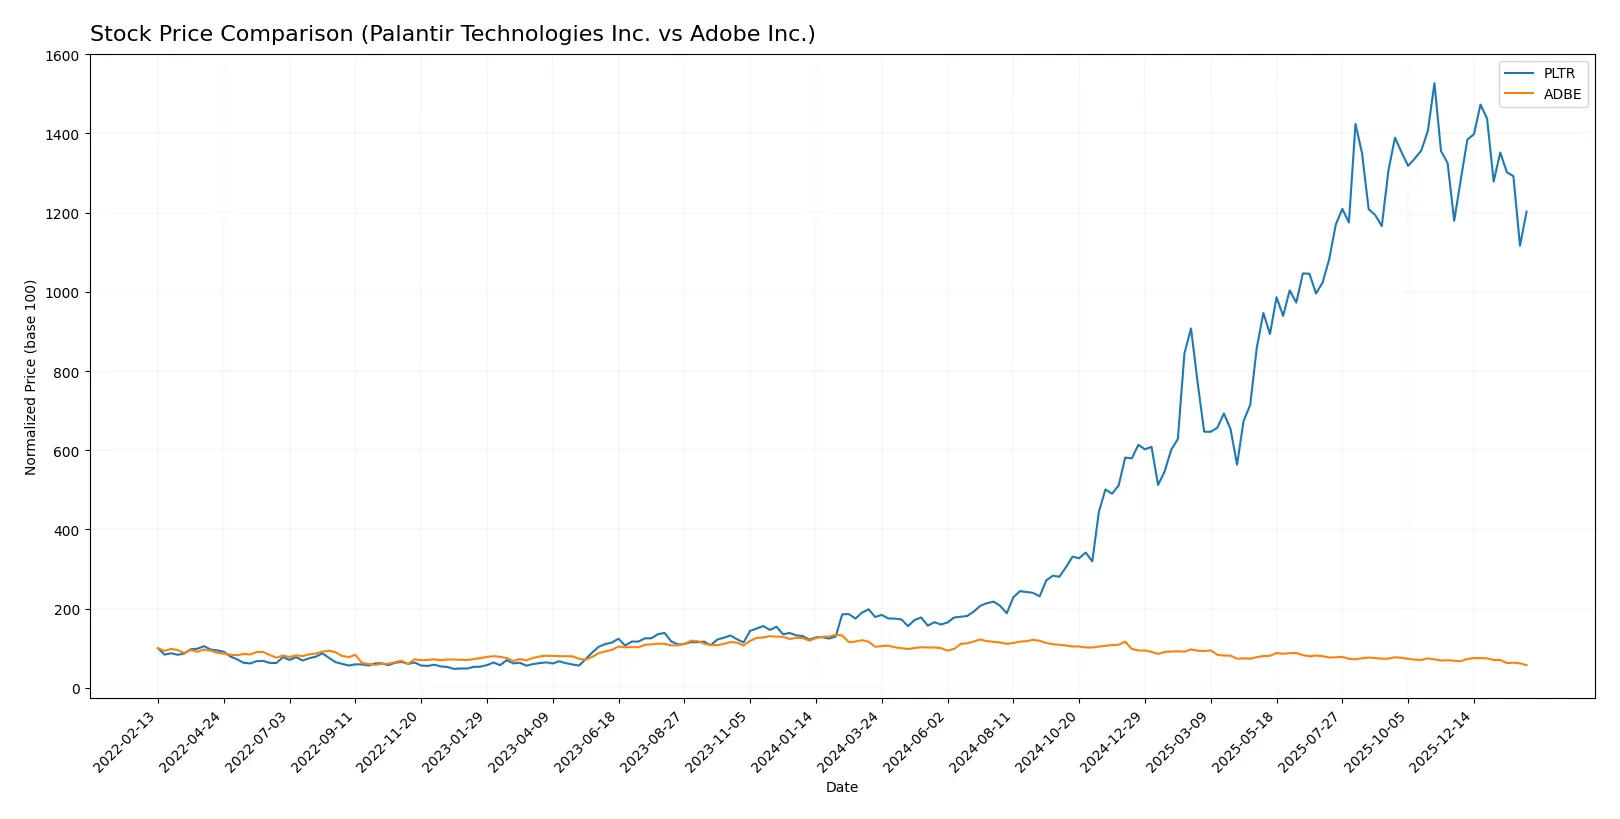
Trend Comparison
Palantir Technologies Inc. posts a 572.12% price increase over the past 12 months, signaling a bullish trend with decelerating growth. The stock peaked at 200.47 and troughed at 20.47, showing high volatility (std dev 59.72).
Adobe Inc. shows a -44.78% decline in the same period, confirming a bearish trend with decelerating losses. It hit a high of 578.34 and a low of 271.93, with elevated volatility (std dev 79.2).
Palantir outperformed Adobe significantly, delivering the highest market return despite decelerating momentum. Adobe’s performance remains firmly negative with no recovery signs.
Target Prices
Analysts show a bullish outlook with solid upside potential for Palantir Technologies Inc. and Adobe Inc.
| Company | Target Low | Target High | Consensus |
|---|---|---|---|
| Palantir Technologies Inc. | 180 | 230 | 198.8 |
| Adobe Inc. | 280 | 500 | 386.76 |
Palantir’s consensus target of 199 exceeds its current 158 price, signaling upside potential. Adobe’s target near 387 is notably above its 272 price, suggesting significant expected growth.

Don’t Let Luck Decide Your Entry Point
Optimize your entry points with our advanced ProRealTime indicators. You’ll get efficient buy signals with precise price targets for maximum performance. Start outperforming now!
How do institutions grade them?
Palantir Technologies Inc. Grades
Here are recent institutional grades for Palantir Technologies Inc.:
| Grading Company | Action | New Grade | Date |
|---|---|---|---|
| UBS | Maintain | Neutral | 2026-02-03 |
| Citigroup | Maintain | Buy | 2026-02-03 |
| DA Davidson | Maintain | Neutral | 2026-02-03 |
| Citigroup | Upgrade | Buy | 2026-01-12 |
| Cantor Fitzgerald | Maintain | Neutral | 2025-11-04 |
| Goldman Sachs | Maintain | Neutral | 2025-11-04 |
| DA Davidson | Maintain | Neutral | 2025-11-04 |
| B of A Securities | Maintain | Buy | 2025-11-04 |
| Morgan Stanley | Maintain | Equal Weight | 2025-11-04 |
| Baird | Maintain | Neutral | 2025-11-04 |
Adobe Inc. Grades
Here are recent institutional grades for Adobe Inc.:
| Grading Company | Action | New Grade | Date |
|---|---|---|---|
| UBS | Maintain | Neutral | 2026-01-26 |
| Oppenheimer | Downgrade | Perform | 2026-01-13 |
| BMO Capital | Downgrade | Market Perform | 2026-01-09 |
| Jefferies | Downgrade | Hold | 2026-01-05 |
| Citigroup | Maintain | Neutral | 2025-12-17 |
| Keybanc | Downgrade | Underweight | 2025-12-15 |
| BMO Capital | Maintain | Outperform | 2025-12-15 |
| Jefferies | Maintain | Buy | 2025-12-11 |
| DA Davidson | Maintain | Buy | 2025-12-11 |
| Wolfe Research | Maintain | Outperform | 2025-12-11 |
Which company has the best grades?
Palantir has a stronger consensus with multiple Buy ratings and few Neutral grades. Adobe shows a recent trend of downgrades, lowering investor sentiment. This divergence may influence risk assessments and portfolio positioning.
Risks specific to each company
The following categories identify the critical pressure points and systemic threats facing Palantir Technologies Inc. and Adobe Inc. in the 2026 market environment:
1. Market & Competition
Palantir Technologies Inc.
- Faces intense competition in data analytics with emerging AI startups challenging market share.
Adobe Inc.
- Dominates diversified software with strong brand loyalty but faces disruption from cloud-native competitors.
2. Capital Structure & Debt
Palantir Technologies Inc.
- Maintains very low debt levels (D/E 0.05), signaling strong balance sheet and financial flexibility.
Adobe Inc.
- Has moderate leverage (D/E 0.57), which raises some risk but is manageable given interest coverage.
3. Stock Volatility
Palantir Technologies Inc.
- Exhibits higher beta (1.687), indicating greater price swings and investor risk sensitivity.
Adobe Inc.
- Shows slightly lower beta (1.515), suggesting relatively more stable stock price behavior.
4. Regulatory & Legal
Palantir Technologies Inc.
- Operates in sensitive government sectors, exposing it to strict compliance and geopolitical legal risks.
Adobe Inc.
- Faces regulatory scrutiny mainly around data privacy and antitrust in digital advertising markets.
5. Supply Chain & Operations
Palantir Technologies Inc.
- Depends heavily on software deployment in government and enterprise; operational disruptions could impact revenue.
Adobe Inc.
- Relies on cloud infrastructure and global distribution networks, vulnerable to tech outages and vendor risks.
6. ESG & Climate Transition
Palantir Technologies Inc.
- Limited ESG disclosures pose reputational risks amid rising investor demands for transparency.
Adobe Inc.
- Progressive ESG initiatives improve sustainability profile but face challenges in carbon footprint reduction.
7. Geopolitical Exposure
Palantir Technologies Inc.
- Significant exposure to US and allied government contracts, sensitive to geopolitical tensions.
Adobe Inc.
- More diversified global footprint, reducing concentrated geopolitical risk but increasing regulatory complexity.
Which company shows a better risk-adjusted profile?
Palantir’s biggest risk lies in geopolitical and regulatory exposure, given its government-focused contracts. Adobe’s main concern is moderate leverage combined with evolving regulatory pressures in digital markets. Adobe’s slightly lower volatility and stronger profitability metrics suggest a better risk-adjusted profile. Notably, Palantir’s sky-high P/E ratio signals market skepticism on valuation despite strong liquidity, reinforcing my caution.
Final Verdict: Which stock to choose?
Palantir’s superpower lies in its rapid growth and improving profitability, driven by cutting-edge data analytics technology. Its soaring valuation signals investor optimism but also demands caution. This stock suits aggressive growth portfolios willing to tolerate elevated multiples for potential breakthrough gains.
Adobe commands a durable moat with strong recurring revenue and high returns on invested capital. Its stable cash flow and robust profitability offer better downside protection compared to Palantir. Adobe fits well within GARP portfolios seeking quality growth without excessive valuation risk.
If you prioritize high-growth potential and can accept elevated valuation risk, Palantir stands out due to its accelerating revenue and margin expansion. However, if you seek a well-established leader with a proven economic moat and steadier returns, Adobe offers better stability and sustainable value creation. Both profiles warrant careful risk management given current market volatility.
Disclaimer: Investment carries a risk of loss of initial capital. The past performance is not a reliable indicator of future results. Be sure to understand risks before making an investment decision.
Go Further
I encourage you to read the complete analyses of Palantir Technologies Inc. and Adobe Inc. to enhance your investment decisions: